
Bitcoin Weekly Forecast: BTC textbook breakout move in play
By Manish Chhetri
Updated: 17 Apr 2026


POPULAR ARTICLES

Bitcoin (BTC) extends gains, up 6% so far this week, trading above $75,000 on Friday, with a technical bullish breakout pattern scenario in play. Easing geopolitical tensions in the Middle East further boosted risk sentiment, driving assets such as BTC higher.
- Bitcoin price action shows a technical bullish breakout pattern amid signs of possible de-escalation in the Middle East.
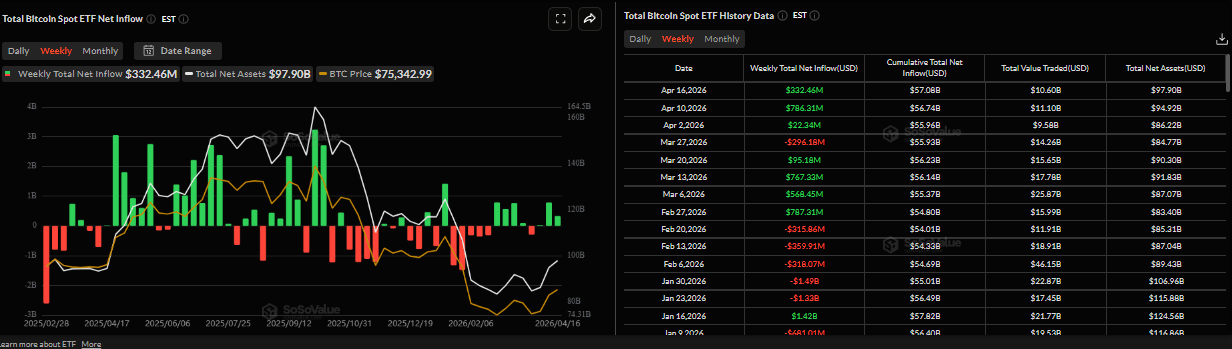
- US-listed spot Bitcoin ETFs recorded inflows of $332.46 million through Thursday, pointing to the third consecutive week of positive flows.
- Profit-taking and a concentrated distribution effort by large holders cap BTC’s upside in the short term.
Bitcoin (BTC) extends gains, up 6% so far this week, trading above $75,000 on Friday, with a technical bullish breakout pattern scenario in play. Easing geopolitical tensions in the Middle East further boosted risk sentiment, driving assets such as BTC higher. Institutional demand also supports the Crypto King price as spot Exchange Traded Funds (ETFs) recorded positive flows through Thursday. However, traders should be cautious, as on-chain data indicate profit-taking and distribution activity that could cap BTC’s upside.
Middle East ceasefire optimism fuels risk sentiment
Bitcoin began the week on a positive note, as improving market sentiment due to developments in the Middle East supports risk assets. The largest cryptocurrency hit a two-month high of $76,038 on Tuesday. It then pulled back and steadied around $74,800 the next day.
US President Donald Trump stated earlier in the week that the war was “close to over.” A Bloomberg report on Wednesday highlighted speculation about a possible extension of the current ceasefire by another two weeks. However, Trump downplayed the need for such a measure, pointing to ongoing negotiations to end the conflict.
Meanwhile, a 10-day truce between Israel and Lebanon fueled hopes about a potential US-Iran peace deal. In fact, Donald Trump struck an optimistic note, telling reporters on Thursday that Iran was close to making a deal.
According to the Wall Street Journal, Washington and Tehran have agreed in principle to hold fresh talks, though neither side has set a time or venue for the meeting.
These improving sentiments around the Middle East boosted a positive risk tone, with US equities such as the S&P 500 index hitting a new all-time high above $7,000, while Bitcoin continues to hold its recent gains on Friday.
Institutional and corporate demand for BTC remains robust
Institutional demand remained robust so far this week, supporting BTC’s price amid easing geopolitical tensions. According to SoSoValue data, spot Bitcoin ETFs have recorded a net inflow of $332.46 million through Thursday. If this trend continues up to Friday, it would mark the third consecutive week of inflows. In case these inflows keep coming in and intensify, BTC could see a rally ahead.
On the corporate side, Michael Saylor announced on X on Monday that his firm, Strategy (MSTR), had purchased 13,927 BTC for $1 billion, bringing its total holdings to 780,897 BTC. This highlights its continued aggressive accumulation strategy, while the firm’s average purchase price for all its holdings is $75,577, inches away from current market prices.
In addition, Tether acquired 951 BTC on Wednesday, bringing its total holdings to 97,141 BTC, highlighting growing corporate demand.
Formation of a short-squeeze scenario
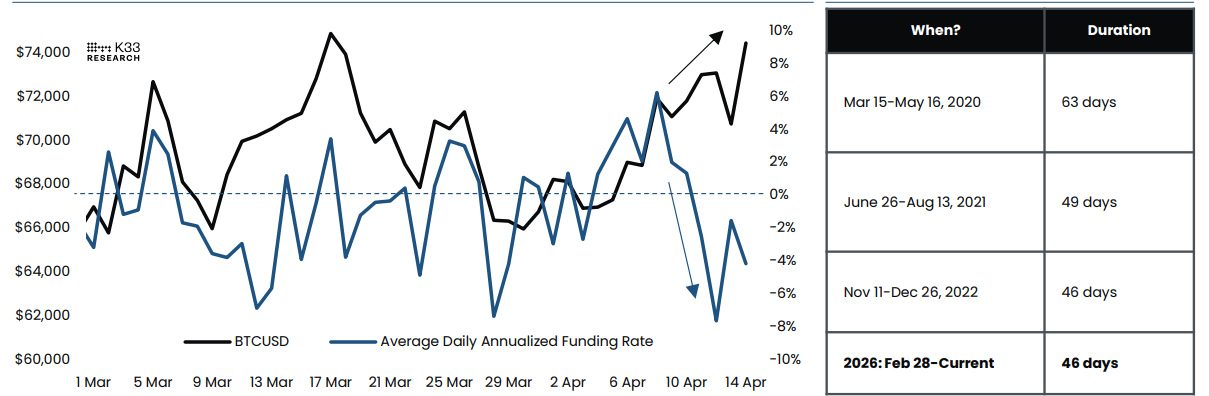
K33 Research reported that funding rates on the Binance exchange for the BTC/USDT pair remained negative for 11 consecutive intervals over the weekend and have shown limited acceleration following BTC’s strong rally on Monday.
The K33 Research analyst noted that while BTC price has risen, funding rates have remained negative alongside growing Open Interest.
“This points to elevated aggression from traders entering short positions, with many betting on BTC failing to break out of its consolidation range. This tendency increases the likelihood of short squeezes ahead”, said the analyst.
The 30-day average funding rate in BTC, as shown below, has now been negative for 46 consecutive days, matching the duration of the negative funding regime from November 11 to December 26, 2022.
“We are now only four days away from surpassing the length of the negative funding regime seen in the summer of 2021. With recent funding rate compression and the unusually persistent negative regime, we see increasing odds of higher highs and a breakout from BTC’s 68-day consolidation. Comparable risk-off regimes have historically been attractive entry points for BTC”, the report concluded.
Building safeguards for greater protection against future quantum risks
WuBlockchain reported on Wednesday that Bitcoin developers and researchers have proposed Bitcoin Improvement Proposal (BIP) 361 to address potential vulnerabilities posed by quantum computing. The proposal suggests freezing early Bitcoin addresses — primarily P2PK addresses with publicly exposed public keys — to prevent future quantum computers from deriving private keys from public data and stealing funds.
This comes after Google Quantum AI recently released a white paper warning that, under advanced quantum scenarios, encrypted wallets could be compromised in under 10 minutes.
This highlights the growing urgency within the crypto ecosystem to proactively address quantum-related threats, as developers move toward building stronger protective safeguards.
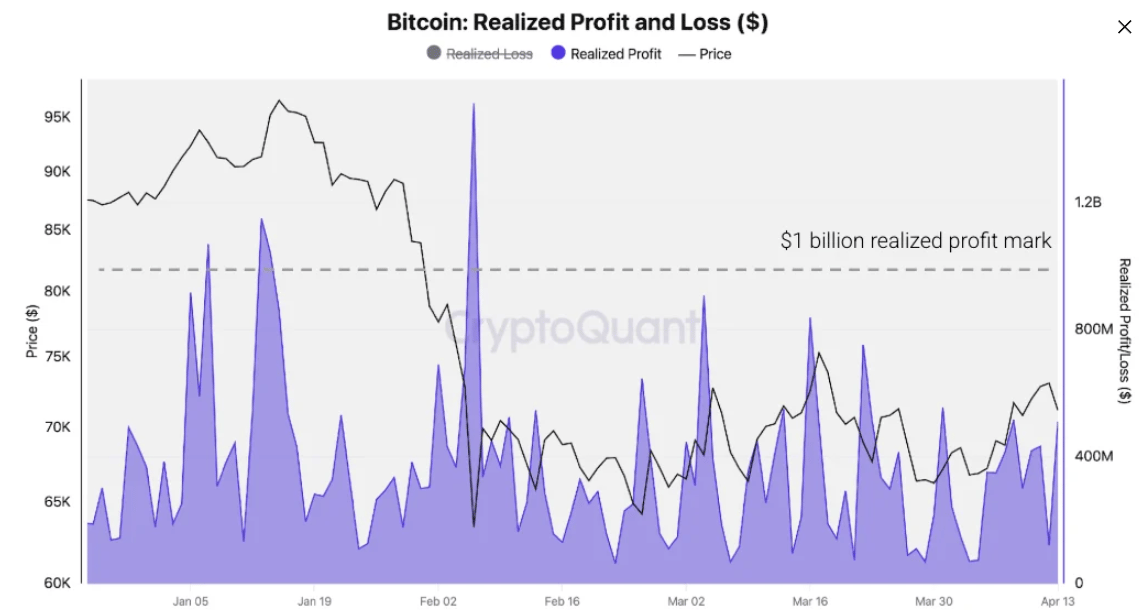
Profit-taking caps BTC’s upside move
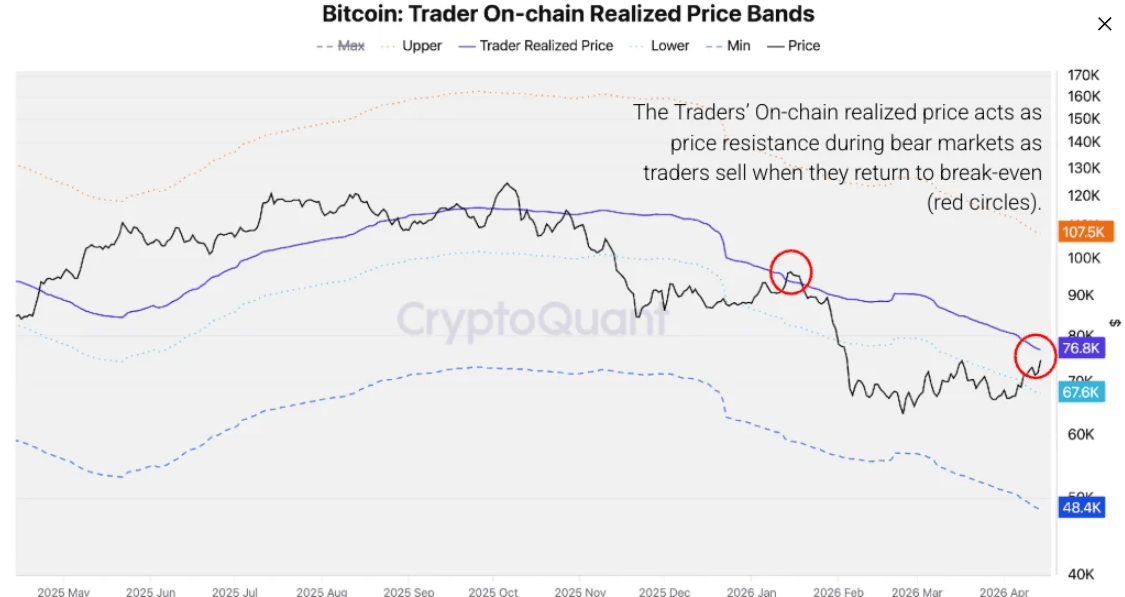
Apart from the above-mentioned bullish sentiment, on-chain data shows some signs of concern. As reported in the previous BTC weekly forecast, the Crypto King was aiming for the Traders Realized Price at approximately $79,000, according to CryptoQuant’s weekly report. As of this week, BTC is nearing this key resistance zone that, at the time of writing, hovers around $75,000.
“A major bear market resistance level that has historically capped relief rallies,” said CryptoQuant’s analyst.
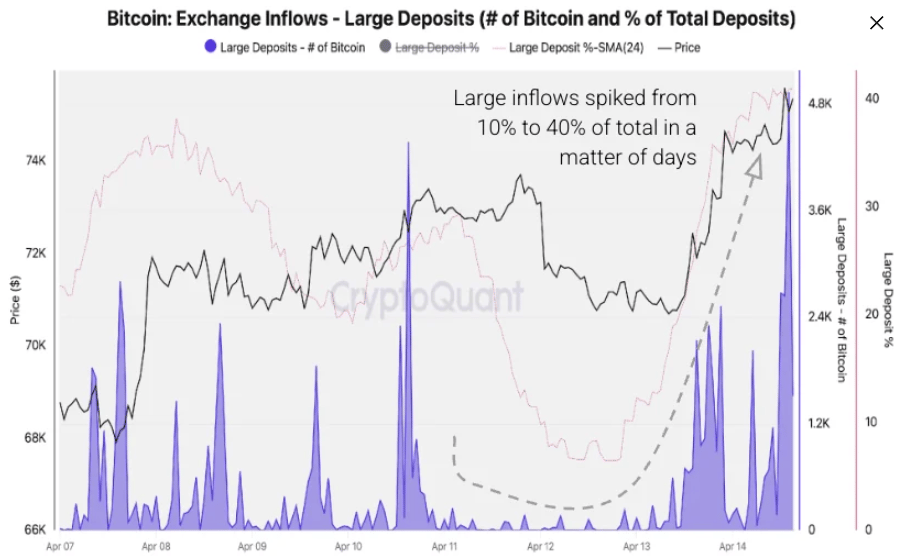
In addition, the chart below shows that the large deposits increased from less than 10% to more than 40% of total exchange inflows within days. This sharp rise indicates that institutional and large-holder distribution is driving the spike, which has historically coincided with elevated near-term selling pressure, something traders should be cautious of.
The daily realized profits activity is also rising, standing near $500 million on Wednesday, below the $1 billion threshold that historically marks a significant spike in profit realization in bear markets.
The analyst at CryptoQuant concludes that “This relatively subdued reading suggests that profit-taking is still in its early stages. Bitcoin holders who accumulated between $65,000 and $76,000 are now in profit, creating a growing pool of unrealized gains. In bear market rallies, realized profit spikes above $1 billion have historically coincided with, or slightly preceded, local price tops. If Bitcoin sustains above $76,000 or pushes higher toward the $76,800 Traders’ Realized price, daily realized profits could accelerate meaningfully toward and above the $1 billion mark, adding further selling pressure and increasing the probability of a rally stall or reversal.”
Technical outlook: Textbook breakout move in play
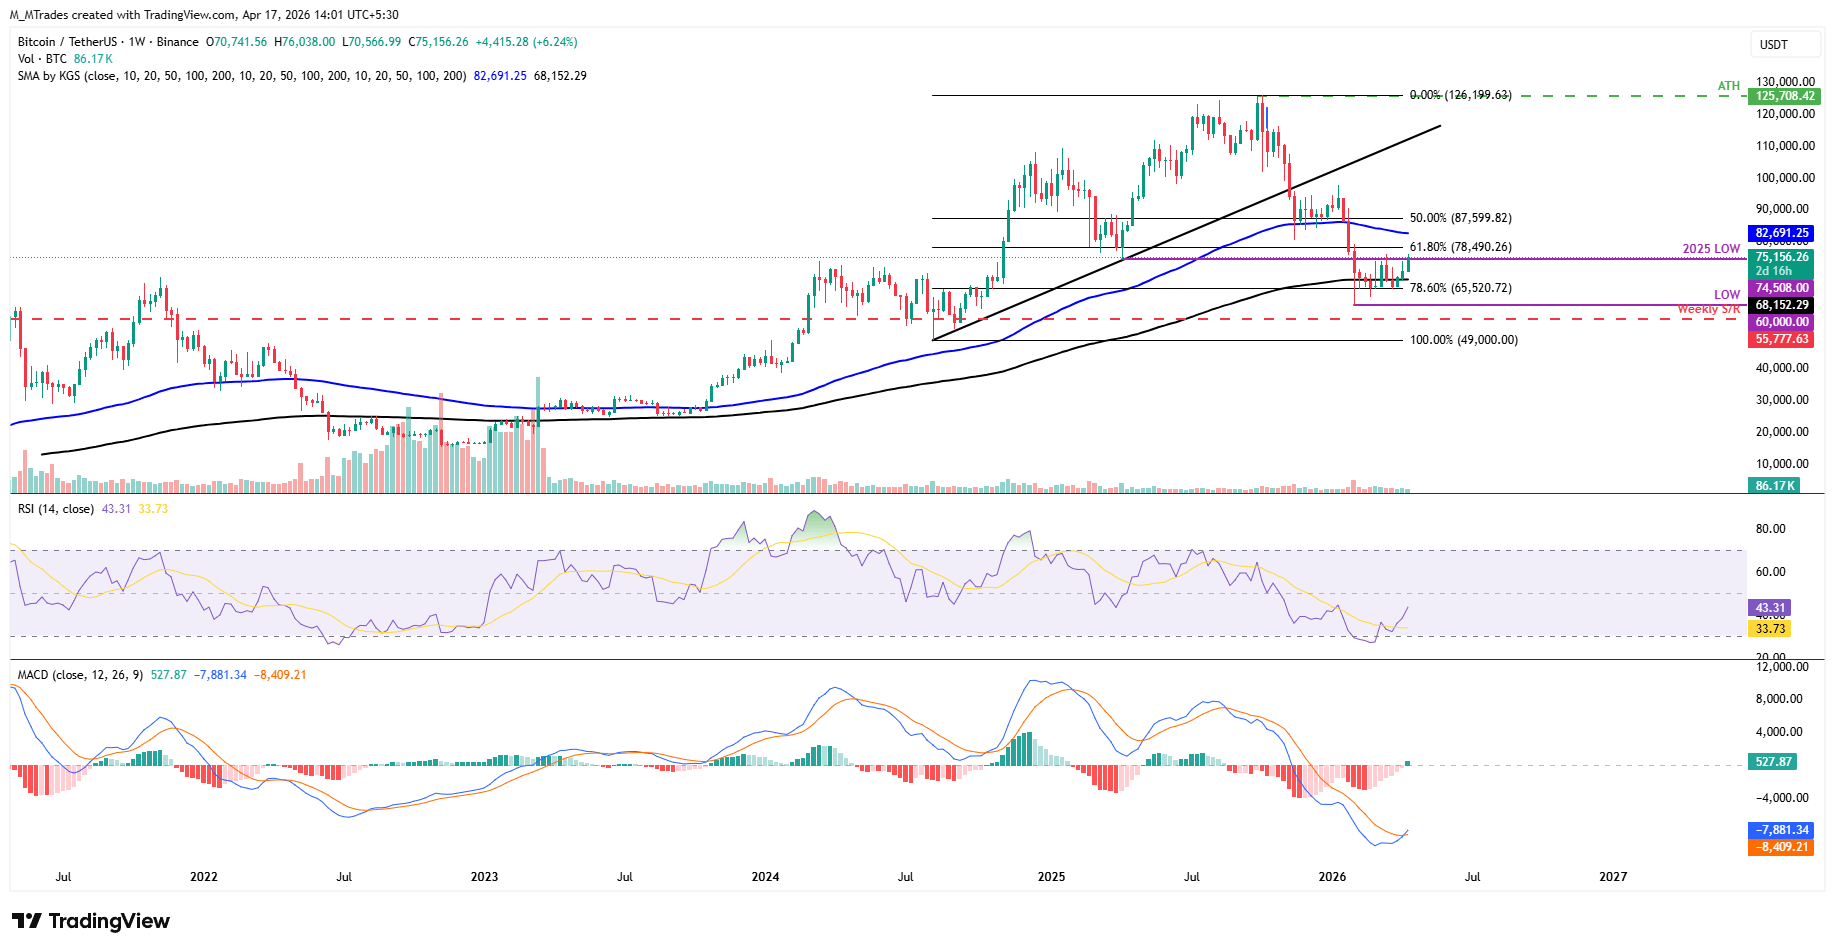
As seen on the weekly chart below, the Crypto King rose 2.47% and closed above the 200-Week Exponential Moving Average (EMA) at $68,152 last week. As of this week, BTC has extended its gains by 6% so far, trading above its 2025 yearly low of $74,508 on Friday.
If BTC continues its upward move and closes above this 2025 yearly low, it could extend gains toward the 61.80% Fibonacci retracement level at $78,490 (drawn from the August 2024 low of $49,000 to the October 2025 all-time high of $126,199), which roughly aligns with the Traders’ Realized Price explained above.
The Relative Strength Index (RSI) reads 43 on the weekly chart, above the oversold territory, pointing upward toward the neutral level of 50, indicating fading bearish momentum. The Moving Average Convergence Divergence (MACD) indicator on the same chart shows a bullish crossover, with a positive histogram supporting the bullish thesis.
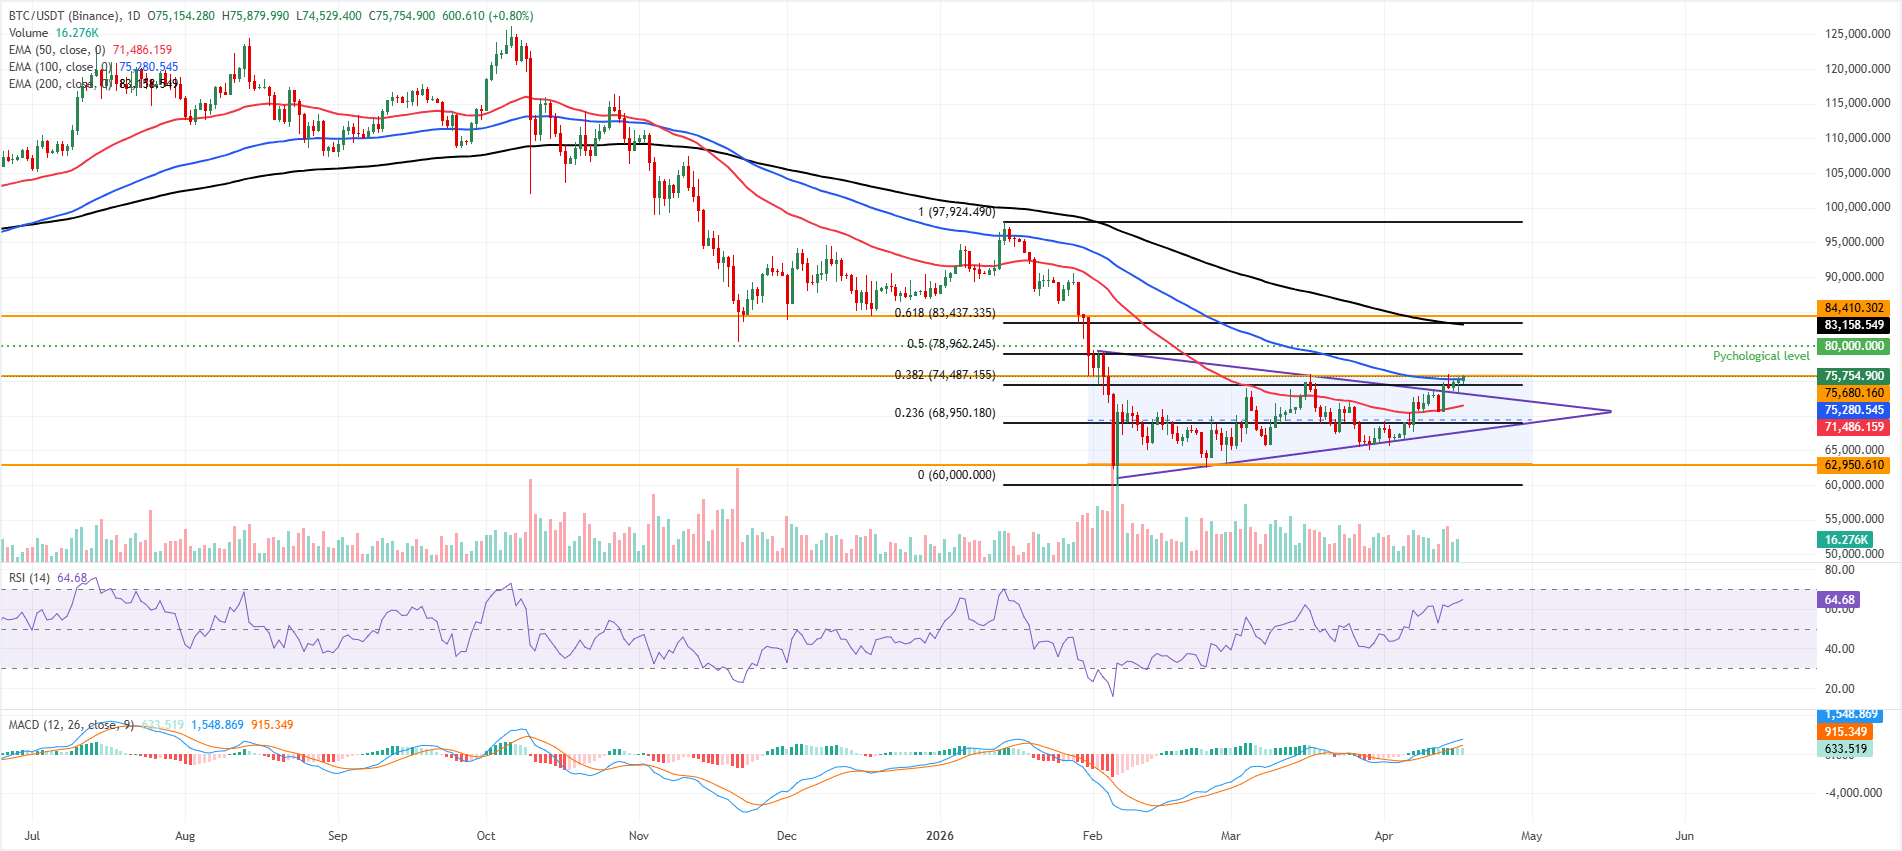
On the daily chart, BTC broke above the upper boundary of an ascending triangle pattern (drawn by connecting highs and lows with two trendlines since early February) near $73,400 at the start of this week, and successfully retested the breakout level, finding support—signaling a textbook breakout-and-retest setup.
The RSI on the daily chart hovers near 64, and the MACD histogram remains positive, both suggesting firm bullish momentum as long as BTC holds above the breakout point near $73,400.
On the downside, initial support is seen at the 50-day EMA at $71,486. A deeper pullback would expose the 23.6% Fibonacci retracement at $68,950 (drawn from the January 14 high to the February 6 low), the rising trendline support (triangle pattern) near $67,412, and ultimately the more distant horizontal floor around $62,950.
On the topside, a sustained close above the 100-day EMA around $75,280 and the nearby $75,680 horizontal resistance would open the door toward the 50% retracement at $78,962 and the psychological $80,000 mark.
(The technical analysis of this story was written with the help of an AI tool.)
Bitcoin, altcoins, stablecoins FAQs
Bitcoin is the largest cryptocurrency by market capitalization, a virtual currency designed to serve as money. This form of payment cannot be controlled by any one person, group, or entity, which eliminates the need for third-party participation during financial transactions.
Altcoins are any cryptocurrency apart from Bitcoin, but some also regard Ethereum as a non-altcoin because it is from these two cryptocurrencies that forking happens. If this is true, then Litecoin is the first altcoin, forked from the Bitcoin protocol and, therefore, an “improved” version of it.
Stablecoins are cryptocurrencies designed to have a stable price, with their value backed by a reserve of the asset it represents. To achieve this, the value of any one stablecoin is pegged to a commodity or financial instrument, such as the US Dollar (USD), with its supply regulated by an algorithm or demand. The main goal of stablecoins is to provide an on/off-ramp for investors willing to trade and invest in cryptocurrencies. Stablecoins also allow investors to store value since cryptocurrencies, in general, are subject to volatility.
Bitcoin dominance is the ratio of Bitcoin's market capitalization to the total market capitalization of all cryptocurrencies combined. It provides a clear picture of Bitcoin’s interest among investors. A high BTC dominance typically happens before and during a bull run, in which investors resort to investing in relatively stable and high market capitalization cryptocurrency like Bitcoin. A drop in BTC dominance usually means that investors are moving their capital and/or profits to altcoins in a quest for higher returns, which usually triggers an explosion of altcoin rallies.

More than a million users rely on FXStreet for real-time market data, charting tools, expert insights, and forex news. Its comprehensive economic calendar and educational webinars help traders stay informed and make calculated decisions. FXStreet is supported by a team of about 60 professionals, split between the Barcelona headquarters and various global regions.
Read More


