
Crypto Today: Bitcoin, Ethereum, XRP correction deepens as capitulation persists
By John Isige
Updated: 30 Jun 2026


POPULAR ARTICLES

The cryptocurrency market continues to face downward momentum on Tuesday, with Bitcoin (BTC) sliding below $60,000, Ethereum (ETH) breaching the $1,600 mark, and Ripple (XRP) retreating toward its critical $1.00 psychological threshold.
- Bitcoin extends its correction below $60,000 amid unceasing ETF outflows and risk-averse sentiment.
- Ethereum sellers tighten their grip as the token slides below $1,600, weighed down by institutions incessantly reducing risk exposure.
- XRP remains under sustained bearish pressure as buyers actively defend the key $1.00 psychological support.
The cryptocurrency market continues to face downward momentum on Tuesday, with Bitcoin (BTC) sliding below $60,000, Ethereum (ETH) breaching the $1,600 mark, and Ripple (XRP) retreating toward its critical $1.00 psychological threshold.
Sentiment remains low amid ongoing ETF outflows
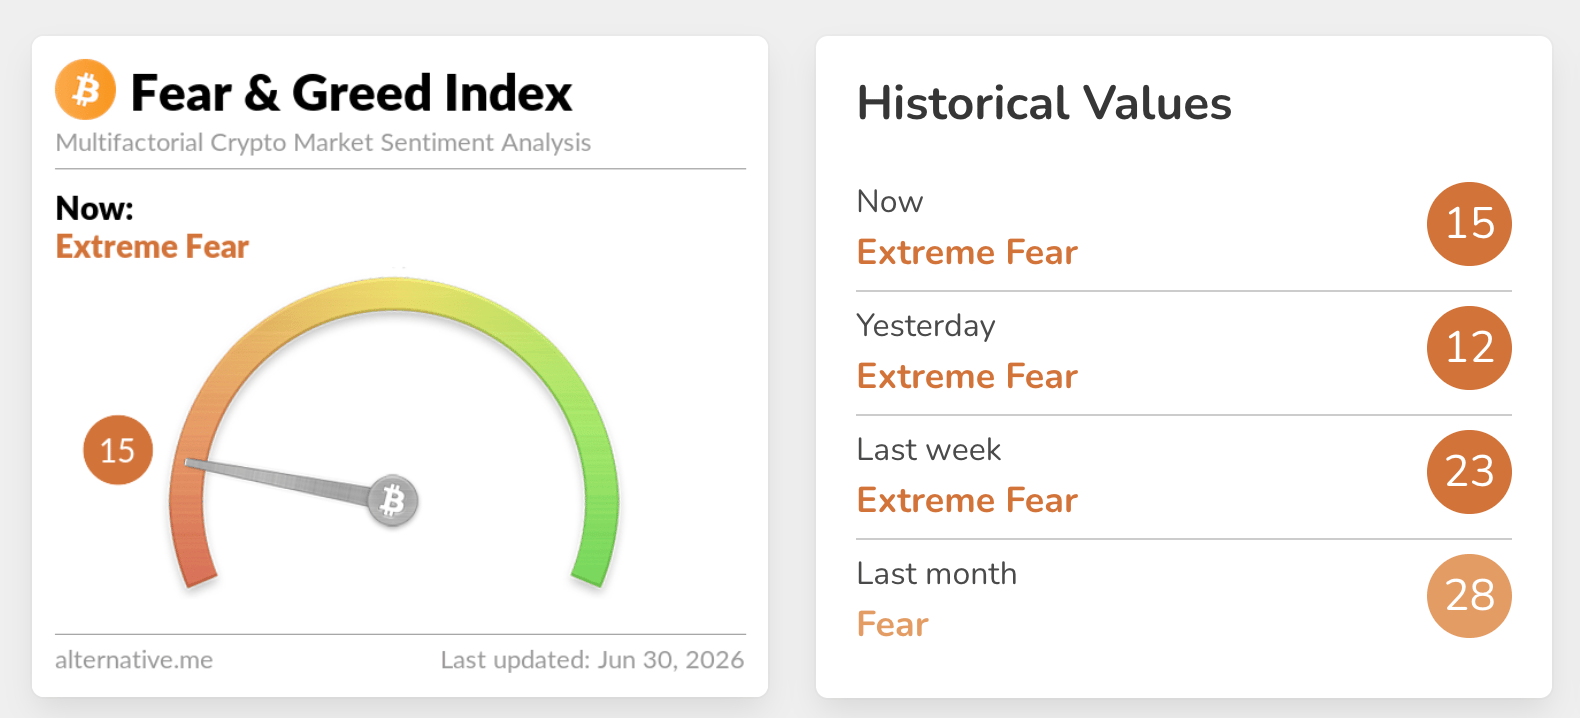
Sentiment in the broader crypto market has remained significantly subdued, as reflected in the Fear & Greed Index, which holds in Extreme Fear territory at 15 on Monday, up only slightly from 12 the previous day. Persistently weak risk appetite dampens demand for risk assets and constrains price movement across the market.
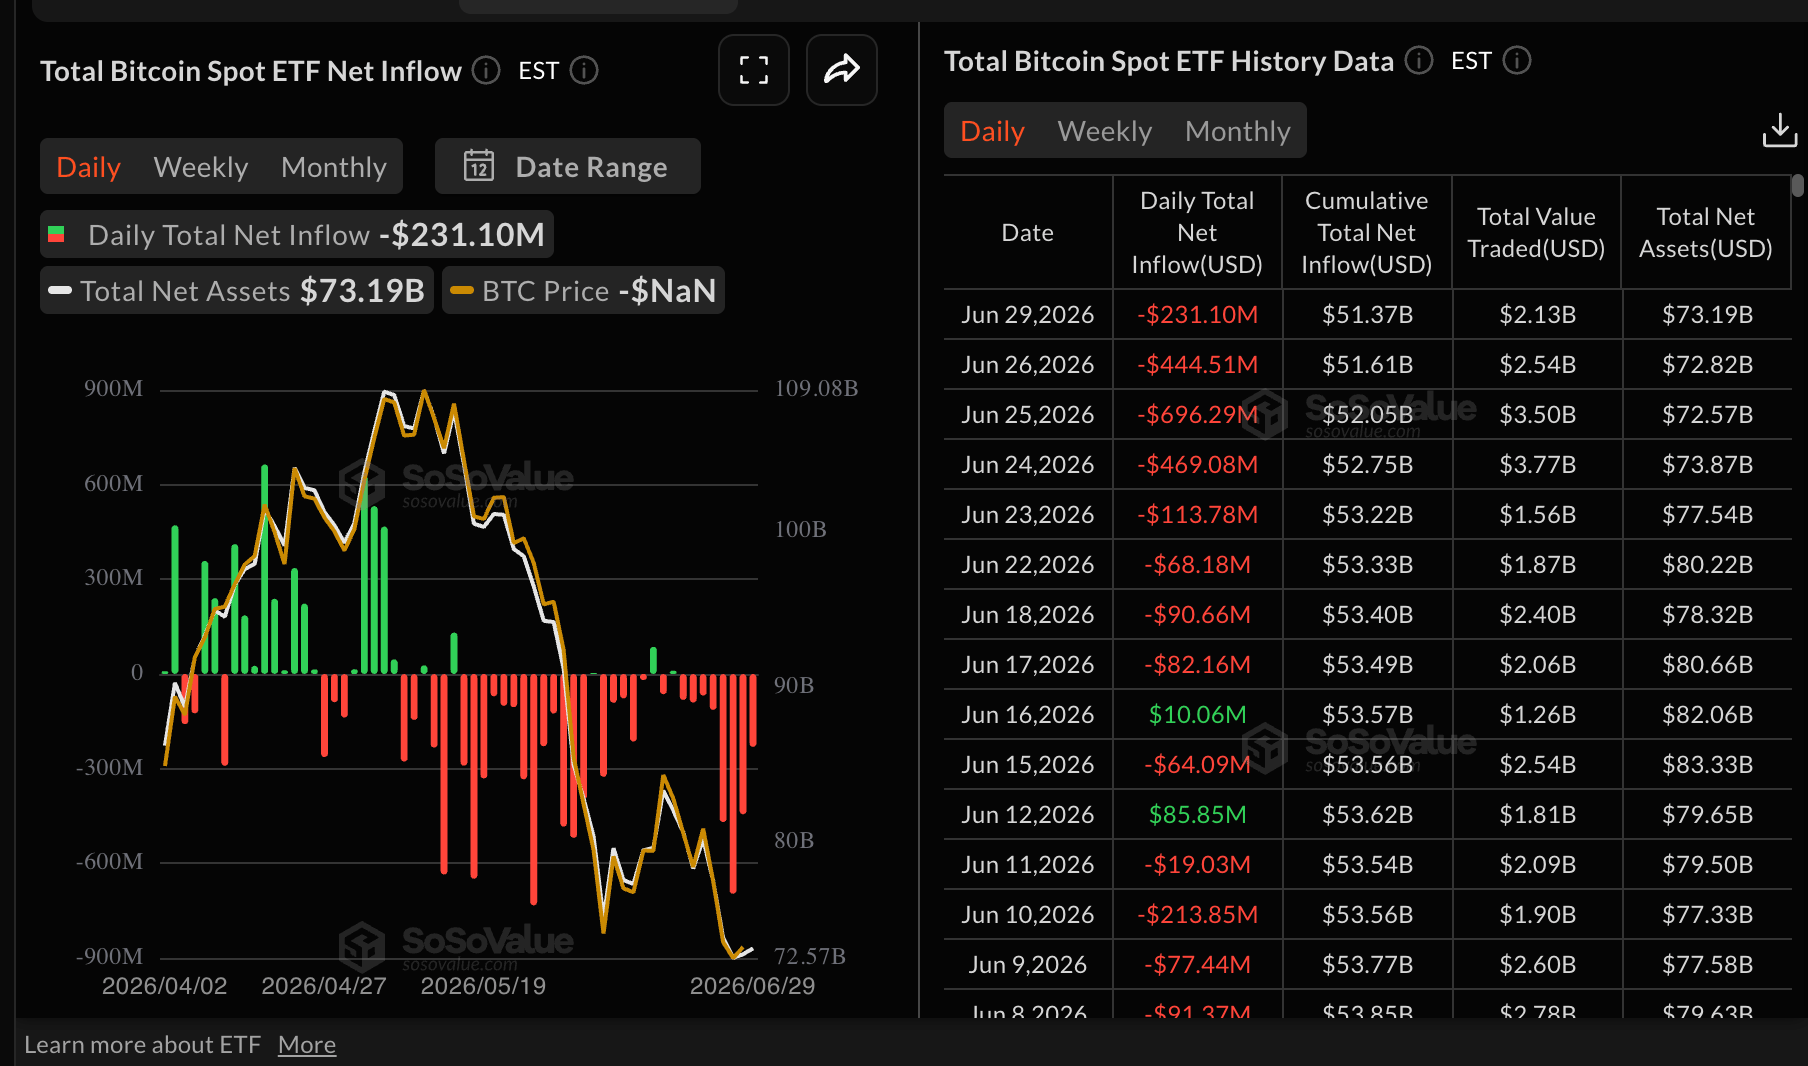
Outflows from US-listed Bitcoin spot ETFs underscore waning institutional interest, with $231 million withdrawn on Monday alone. This marks the eighth consecutive day of net redemptions, reinforcing the ongoing bearish narrative.
Despite the outflows, cumulative inflows remain positive at $51.37 billion while net assets under management average $71.19 billion.
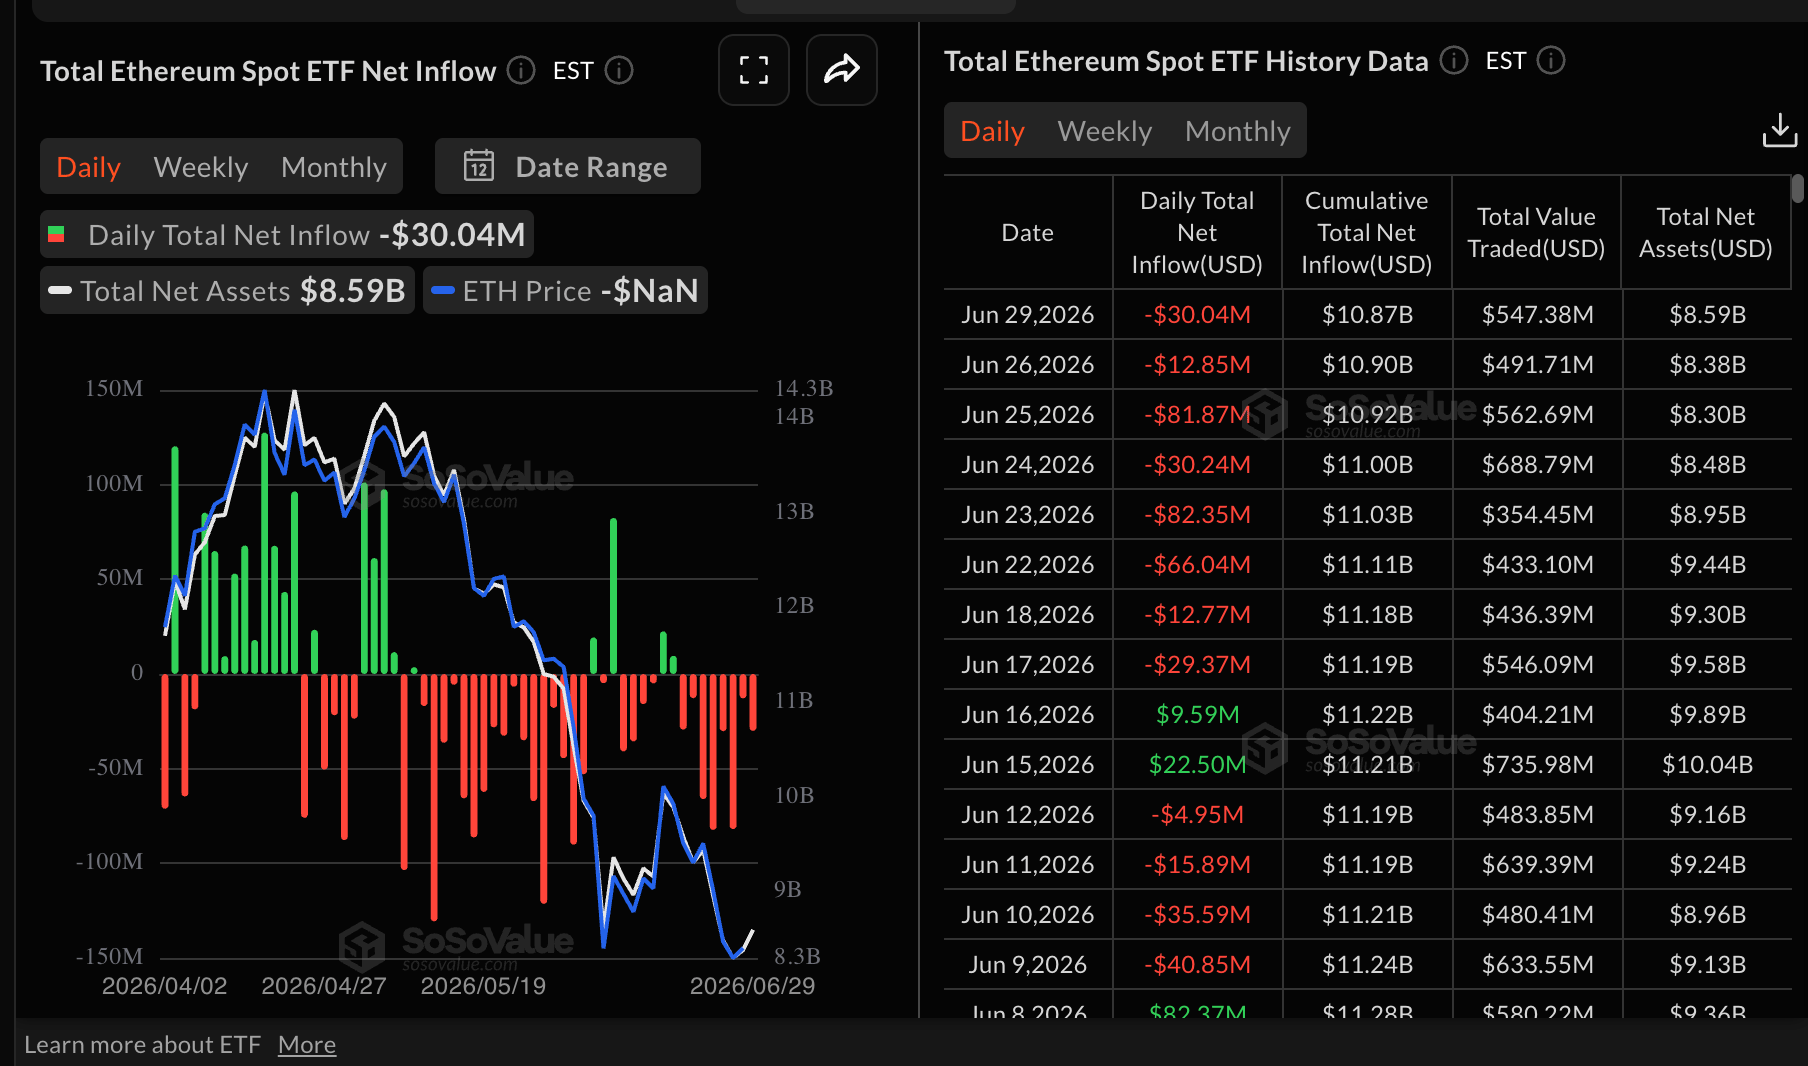
Ethereum spot ETFs present a similar grim picture to Bitcoin, with outflows totaling $30 million on Monday, up from nearly $13 million on Friday. According to SoSoValue, ETH ETF outflows have persisted for the eighth consecutive day, reflecting ongoing market caution.
Nevertheless, cumulative inflows remain robust at $10.87 billion, while total assets under management stand at $8.59 billion, demonstrating that long-term investor interest has not fully diminished.
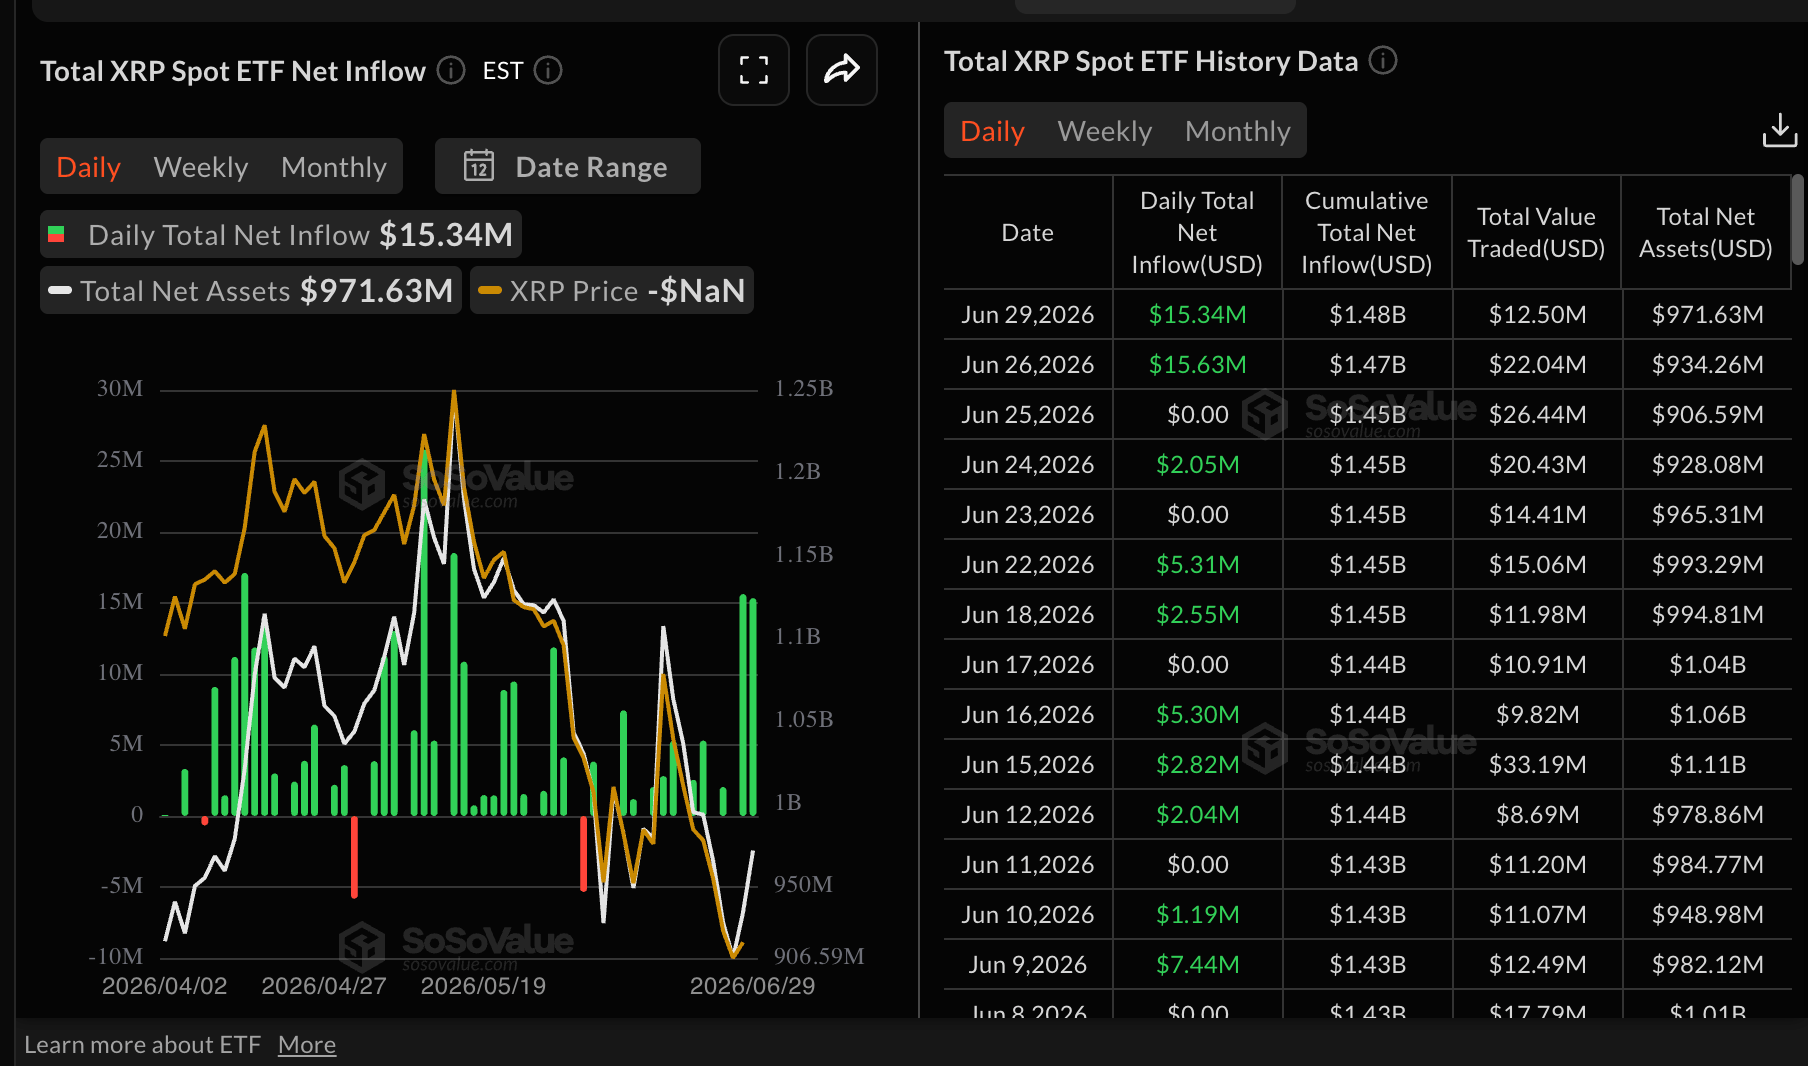
XRP spot ETFs, on the other hand, continue to post inflows defying the current bearish outlook in the crypto market. Inflows into US-listed ETFs steadied above $15 million on Monday, bringing cumulative deposits to $1.48 billion and net assets under management to $972 million.
The sustained uptake of XRP ETFs shows that institutions see a bullish picture and are willing to increase exposure even as prices falter near the psychological support level of $1.00.
Price analysis: Bitcoin stays under pressure amid weak technicals
Bitcoin trades at $59,419, holding a clear bearish bias. The spot price remains decisively below the 50-day, 100-day and 200-day Exponential Moving Averages (EMAs) at $66,623, $70,329 and $76,399 respectively, keeping the broader trend under downside pressure.
Bollinger Bands show spot trading beneath the midline at $62,687 and closer to the lower band at $58,279, underscoring persistent selling interest despite a modest uptick in momentum.
Meanwhile, the Moving Average Convergence Divergence (MACD) histogram has remained positive on the daily chart, while the Relative Strength Index (RSI) at 32 edges away from oversold territory, hinting at the potential for a corrective bounce rather than a trend reversal.
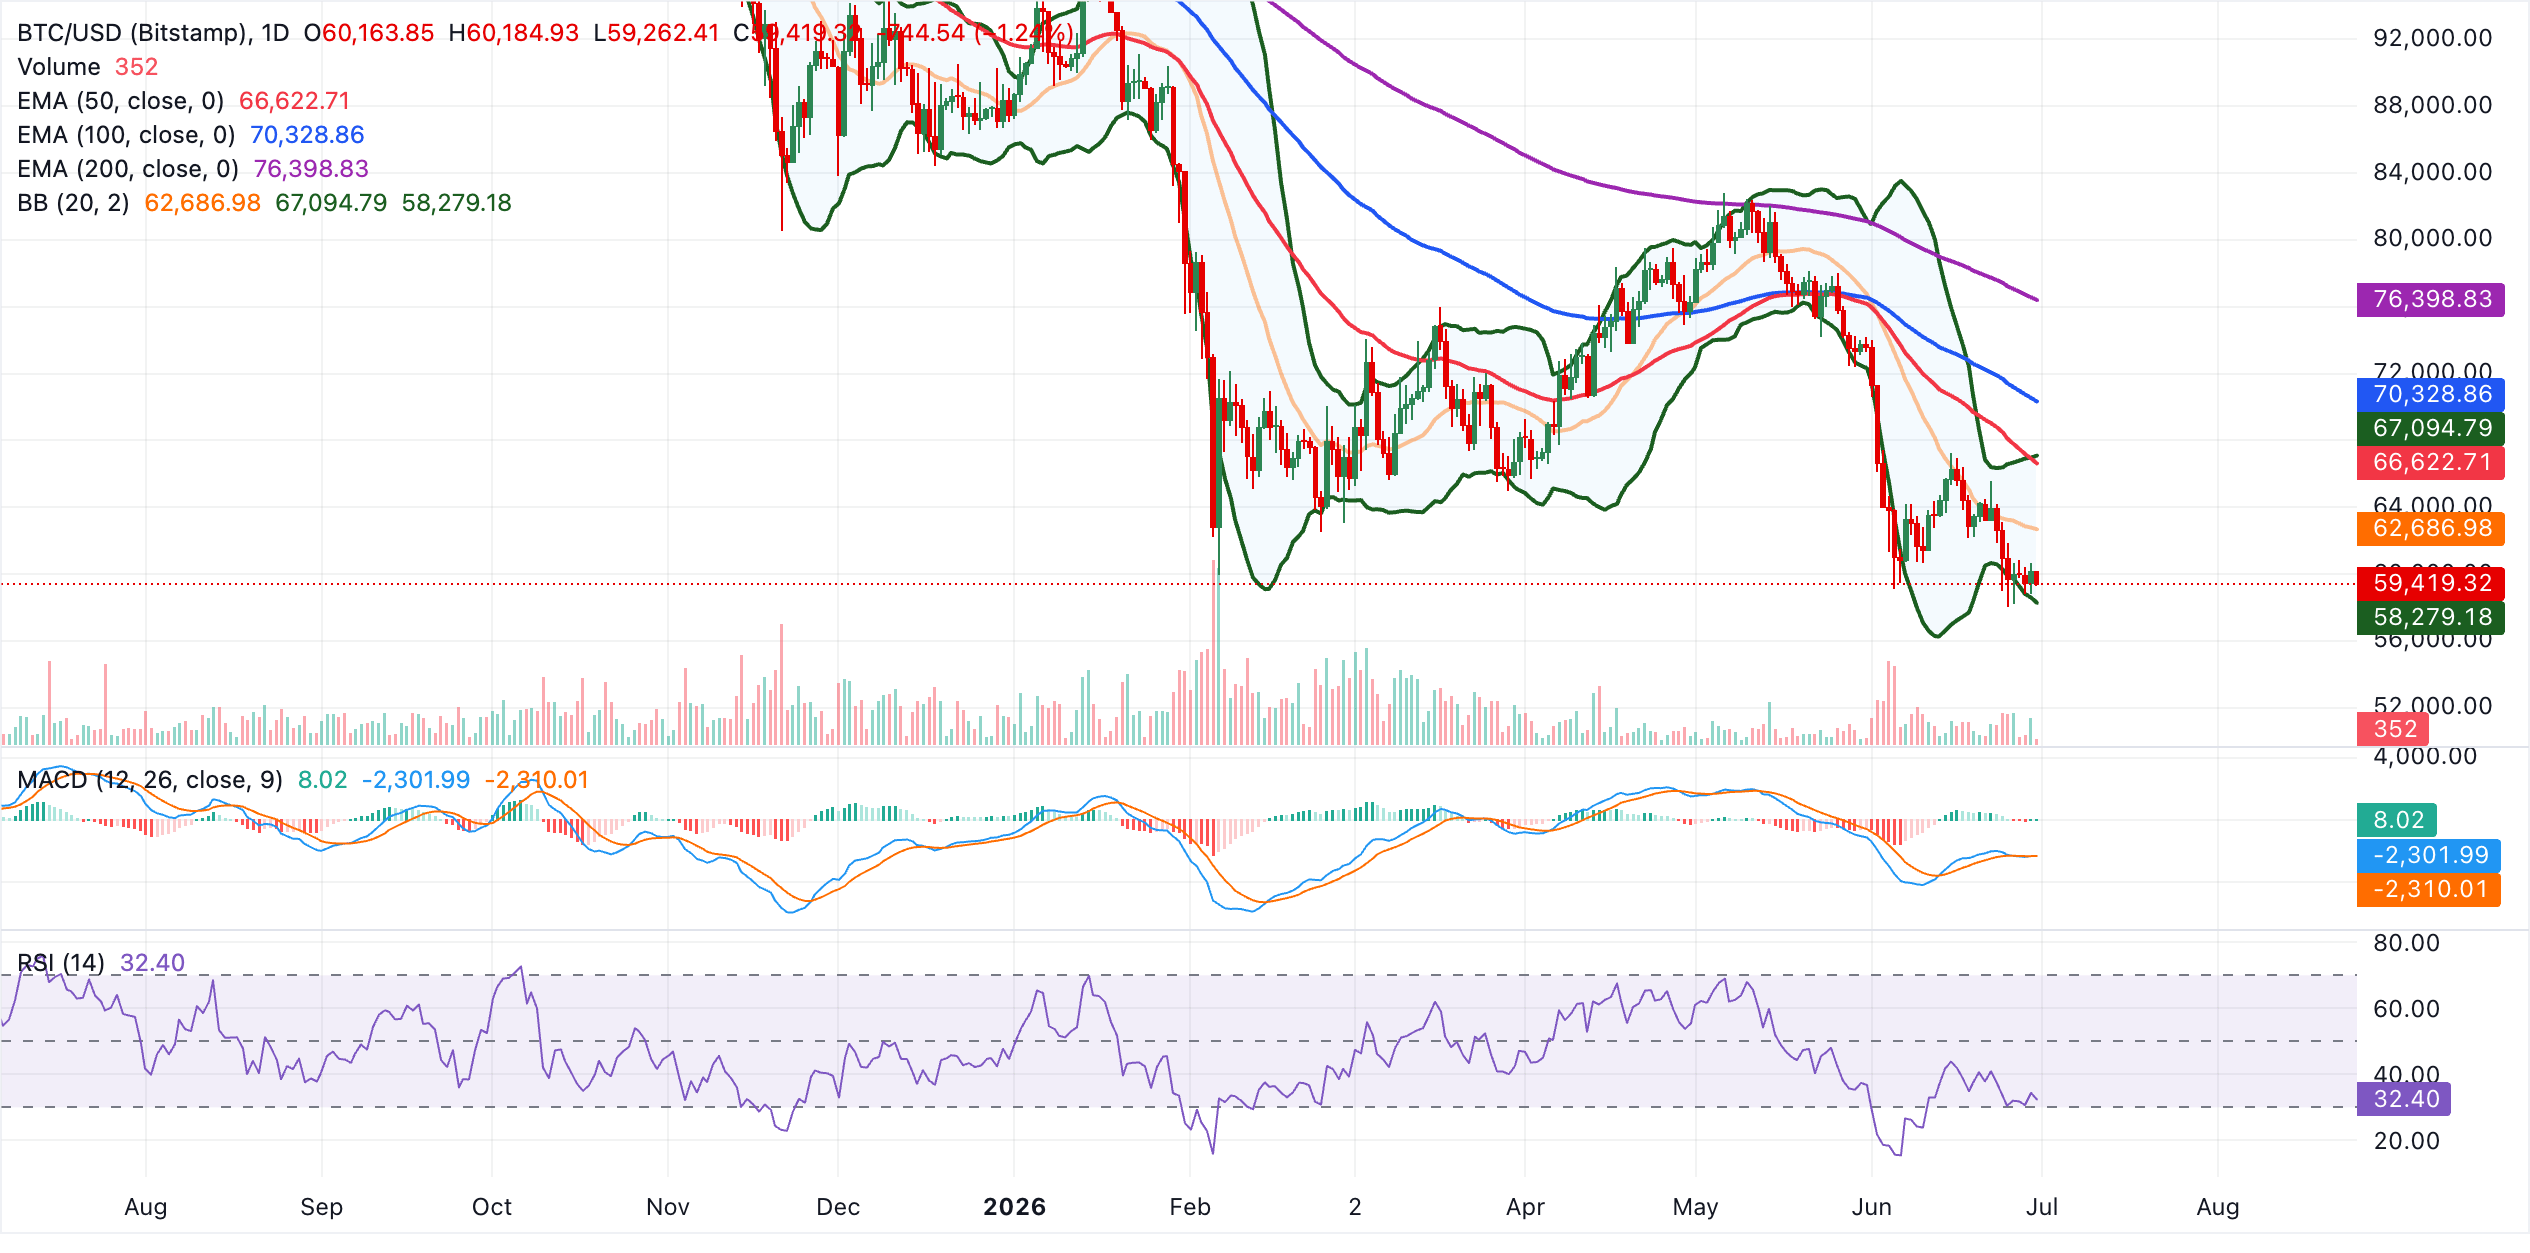
Initial resistance emerges at the Bollinger middle band around $62,687, with a more significant cap at the 50-day EMA near $66,623, which clusters with the upper Bollinger band at $67,095. Above these barriers, the 100-day EMA at $70,329 and the 200-day EMA at $76,399 form a broader structural ceiling that would need to be reclaimed to soften the prevailing bearish outlook.
Looking down, immediate support lies at the Bollinger lower band at $58,279. A sustained break below this level would expose fresh weakness and open the door toward lower psychological levels, while holding above it would merely keep BTC in a corrective consolidation within a still-dominant downtrend.
Altcoins technical outlook: Ethereum and XRP edge lower
Ethereum trades at $1,585, maintaining a bearish near-term bias as price holds well below the key moving averages. The 50-day EMA at $1,823, the 100-day EMA at $2,002 and the 200-day EMA at $2,292 all sit overhead, reinforcing a capped structure.
At the same time, a modestly positive MACD histogram on the daily chart, hints at only tentative recovery attempts within a broader downtrend. The RSI near 36 on the same chart remains below the midline on the same chart, suggesting weak but not extreme selling pressure.
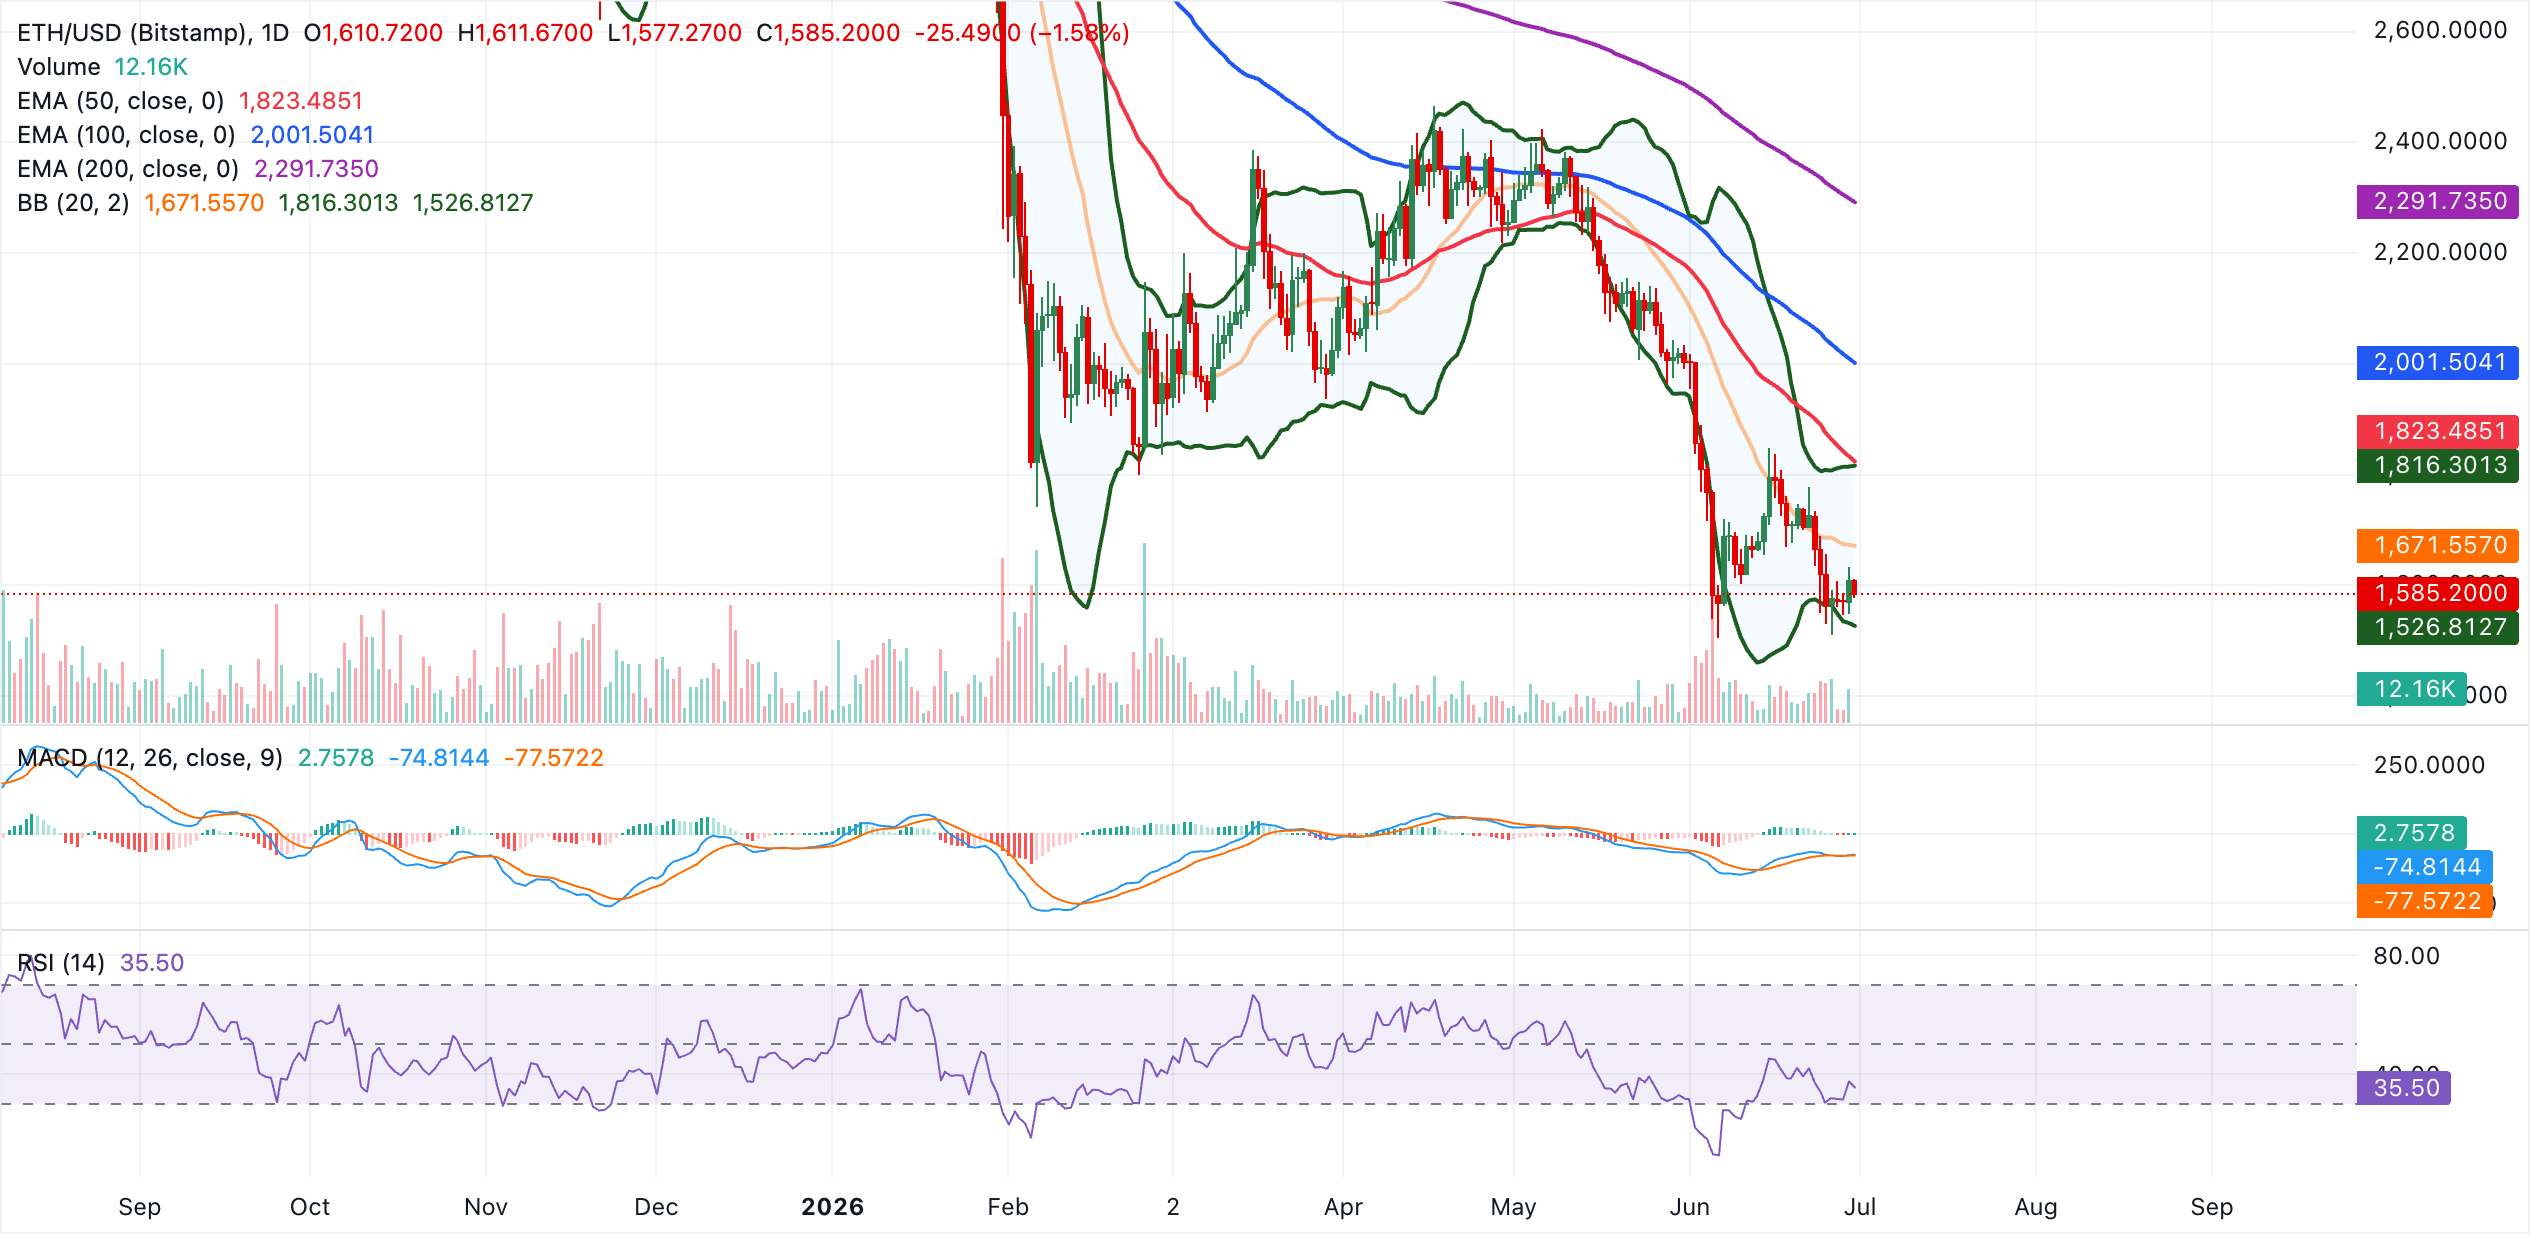
On the topside, initial resistance emerges at the Bollinger Bands centerline near $1,672, with the upper Bollinger band at $1,816 forming the next barrier ahead of the 50-day EMA at $1,823. Further up, the 100-day EMA at $2,002 and the 200-day EMA at $2,292 define a broader supply zone that would likely cap any deeper corrective bounce.
On the downside, immediate support is provided by the lower Bollinger band at $1,527. A decisive break below this level would open the door to renewed bearish extension toward lower psychological and historical levels.
XRP, on the other hand, trades at $1.04, extending a bearish phase well beneath the short and long-term moving averages. The 50-day EMA at $1.20, the 100-period EMA at $1.31 and the 200-period EMA at $1.52 all sit overhead, reinforcing a capped tone while the pair drifts near the lower end of its Bollinger envelope.
The RSI around 33 stays in weak territory on the daily chart, and the MACD histogram slightly negative, together suggesting that downside momentum persists even as the recent sell-off starts to moderate.
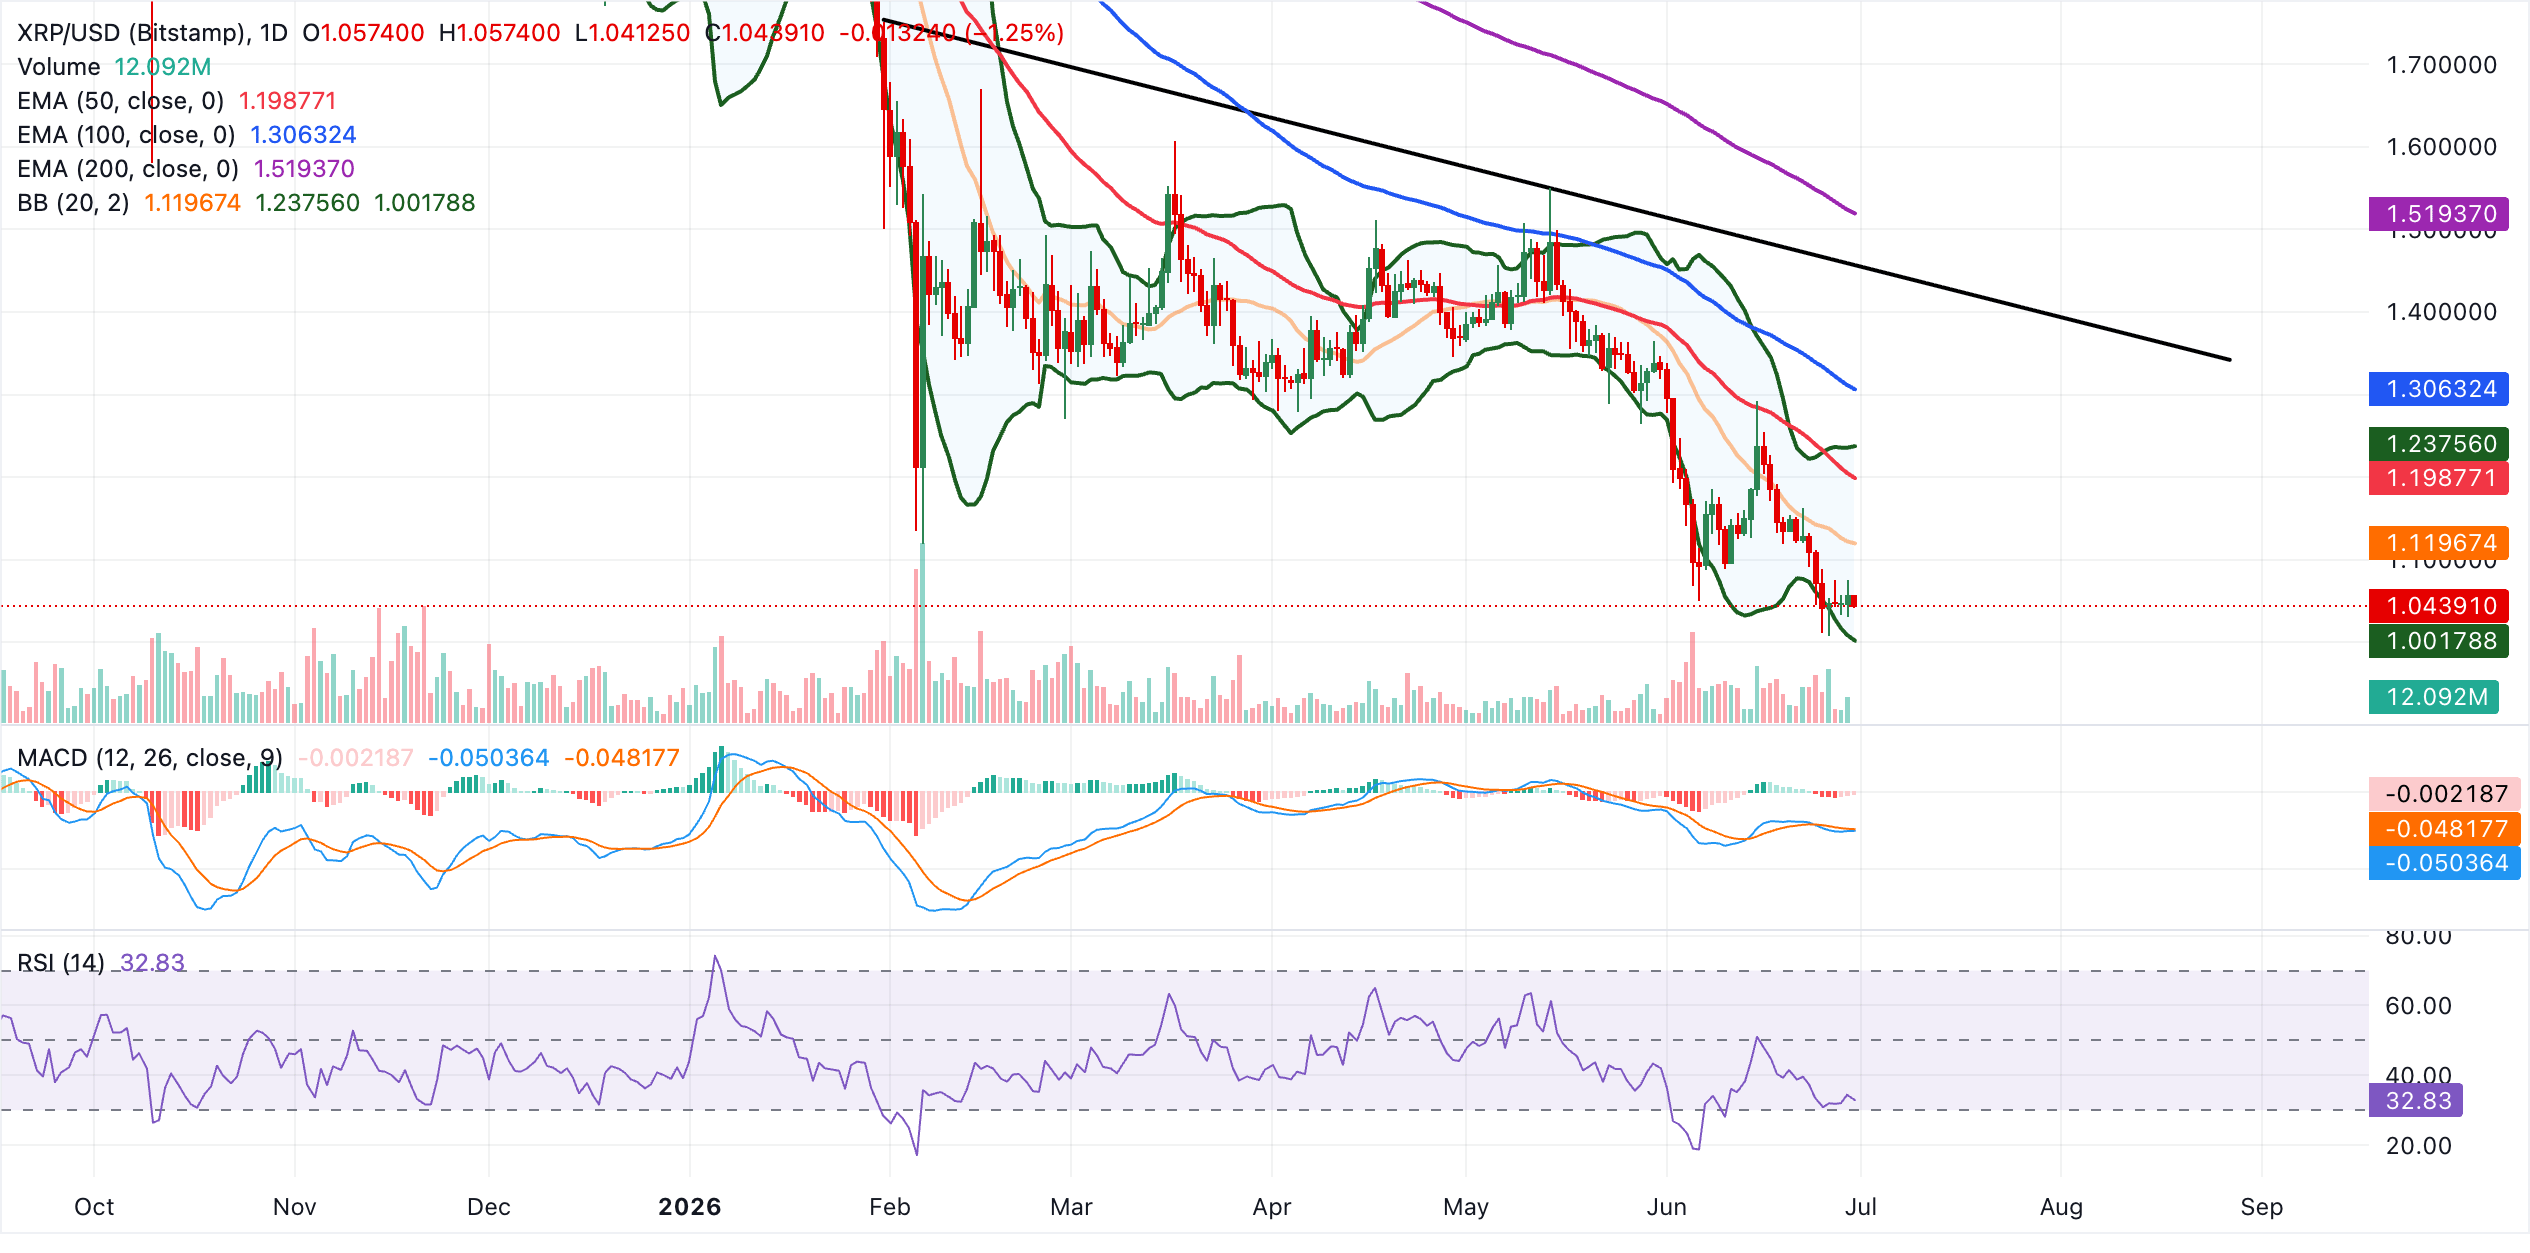
Initial resistance lies at the Bollinger middle band near $1.12, followed by the 50-day EMA around $1.20 and the Bollinger upper band close to $1.24. Above these, the 100-day EMA near $1.31 and the distant 200-day EMA around $1.52, alongside the prevailing downtrend resistance line, define a broader ceiling that would need to be reclaimed to ease the bearish bias.
On the downside, immediate support is offered by the Bollinger lower band near $1.00, where failure would open the door to fresh lows and extend the current downtrend.
(The technical analysis of this story was written with the help of an AI tool.)
Crypto ETF FAQs
An Exchange-Traded Fund (ETF) is an investment vehicle or an index that tracks the price of an underlying asset. ETFs can not only track a single asset, but a group of assets and sectors. For example, a Bitcoin ETF tracks Bitcoin’s price. ETF is a tool used by investors to gain exposure to a certain asset.
Yes. The first Bitcoin futures ETF in the US was approved by the US Securities & Exchange Commission in October 2021. A total of seven Bitcoin futures ETFs have been approved, with more than 20 still waiting for the regulator’s permission. The SEC says that the cryptocurrency industry is new and subject to manipulation, which is why it has been delaying crypto-related futures ETFs for the last few years.
Yes. The SEC approved in January 2024 the listing and trading of several Bitcoin spot Exchange-Traded Funds, opening the door to institutional capital and mainstream investors to trade the main crypto currency. The decision was hailed by the industry as a game changer.
The main advantage of crypto ETFs is the possibility of gaining exposure to a cryptocurrency without ownership, reducing the risk and cost of holding the asset. Other pros are a lower learning curve and higher security for investors since ETFs take charge of securing the underlying asset holdings. As for the main drawbacks, the main one is that as an investor you can’t have direct ownership of the asset, or, as they say in crypto, “not your keys, not your coins.” Other disadvantages are higher costs associated with holding crypto since ETFs charge fees for active management. Finally, even though investing in ETFs reduces the risk of holding an asset, price swings in the underlying cryptocurrency are likely to be reflected in the investment vehicle too.

More than a million users rely on FXStreet for real-time market data, charting tools, expert insights, and forex news. Its comprehensive economic calendar and educational webinars help traders stay informed and make calculated decisions. FXStreet is supported by a team of about 60 professionals, split between the Barcelona headquarters and various global regions.
Read More


