
Crypto Today: Bitcoin, Ethereum, XRP edge down, testing support as resistance holds
By John Isige
Updated: 15 May 2026


POPULAR ARTICLES

Cryptocurrency prices are broadly correcting on Friday, following a failed attempt to recover losses incurred earlier in the week after the United States (US) Senate Banking Committee advanced the Digital Asset Market Clarity Act, commonly known as the Clarity Act of 2025.
- Bitcoin corrects toward $80,000 support on Friday after being rejected by the 200-day EMA.
- Ethereum extends its decline below major moving averages, weighed down by fading retail interest.
- XRP trades within a narrow $1.40-$1.50 range, as inflows into ETFs fail to spark upward momentum.
Cryptocurrency prices are broadly correcting on Friday, following a failed attempt to recover losses incurred earlier in the week after the United States (US) Senate Banking Committee advanced the Digital Asset Market Clarity Act, commonly known as the Clarity Act of 2025.
Altcoins, including Ethereum (ETH) and Ripple (XRP), appear to be faltering alongside Bitcoin, with ETH testing a short-term support at $2,250 and XRP edging lower by over 1% to trade at $1.46.
Bitcoin and XRP lead ETF inflows as Ethereum lags
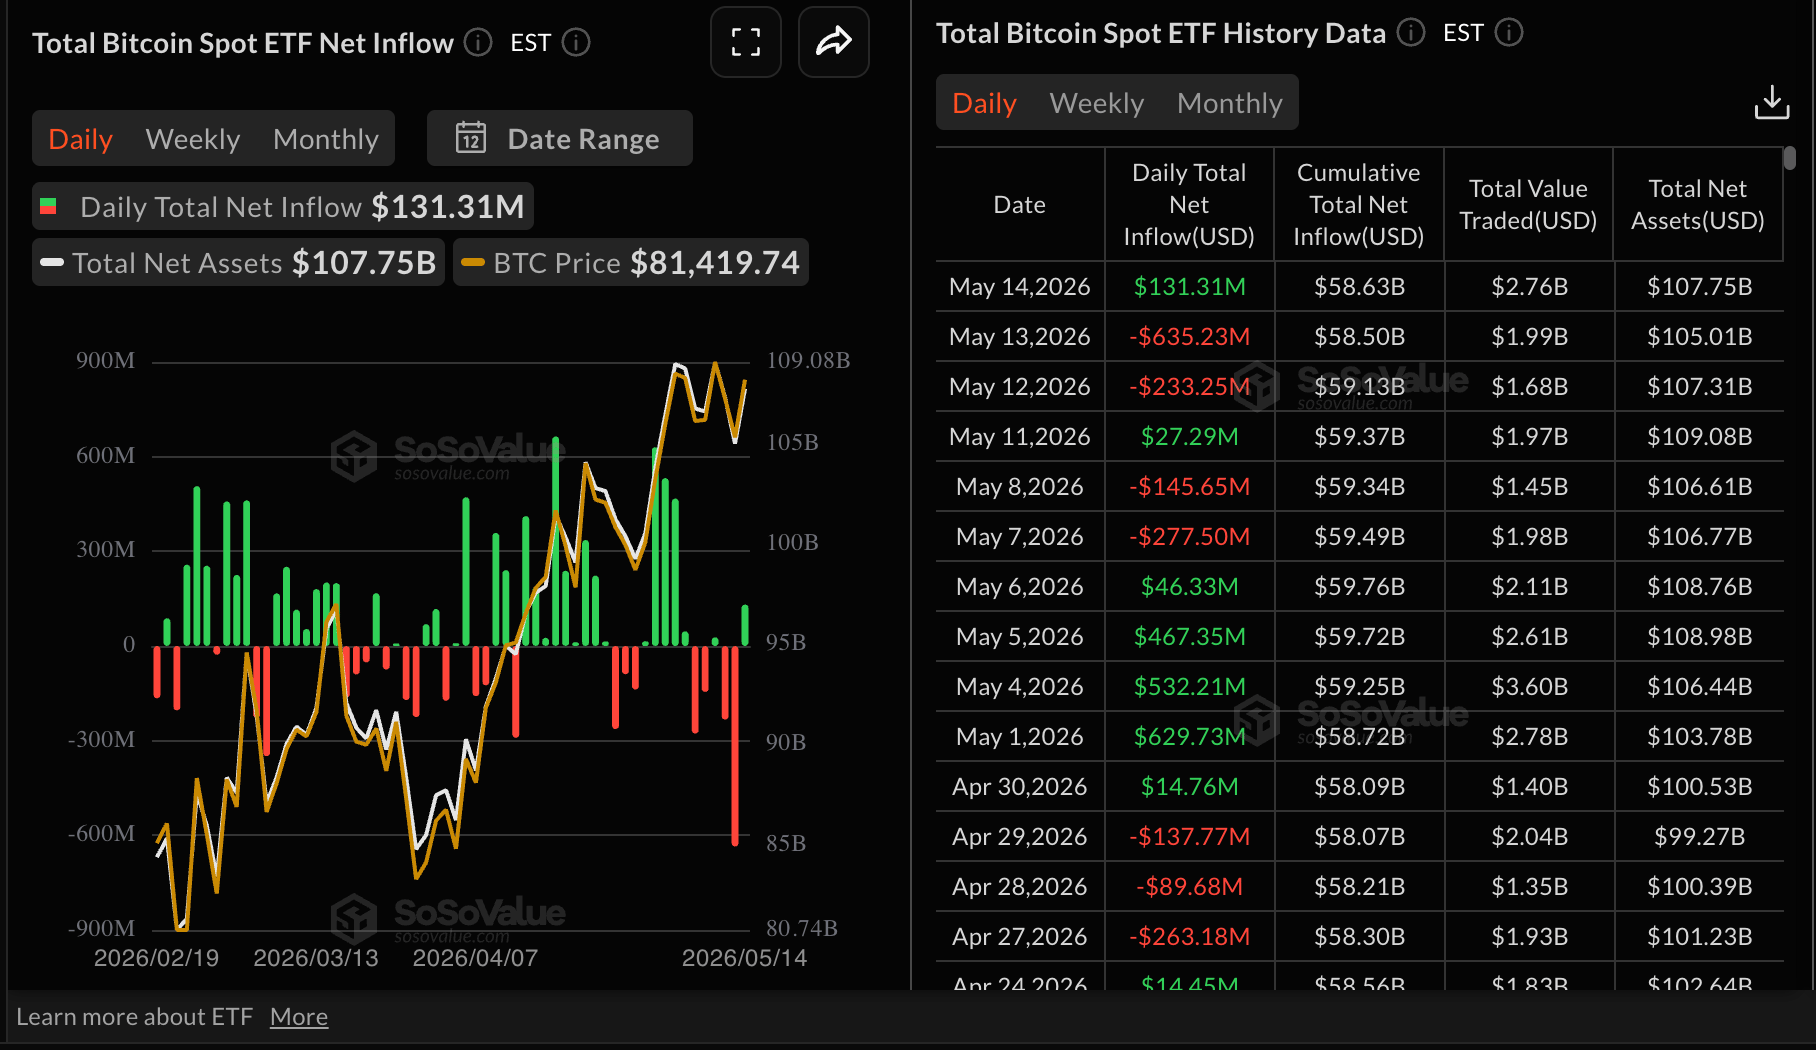
Bitcoin saw a return of institutional interest on Thursday, as inflows into spot Exchange-Traded Funds (ETFs) totaled roughly $131 million.
The turnaround broke a two-day bearish streak, where outflows totaled $233 million on Tuesday and $635 million on Wednesday. SoSoValue data shows that cumulative inflows stand at $58.63 billion, while net assets under management average $107.75 billion.
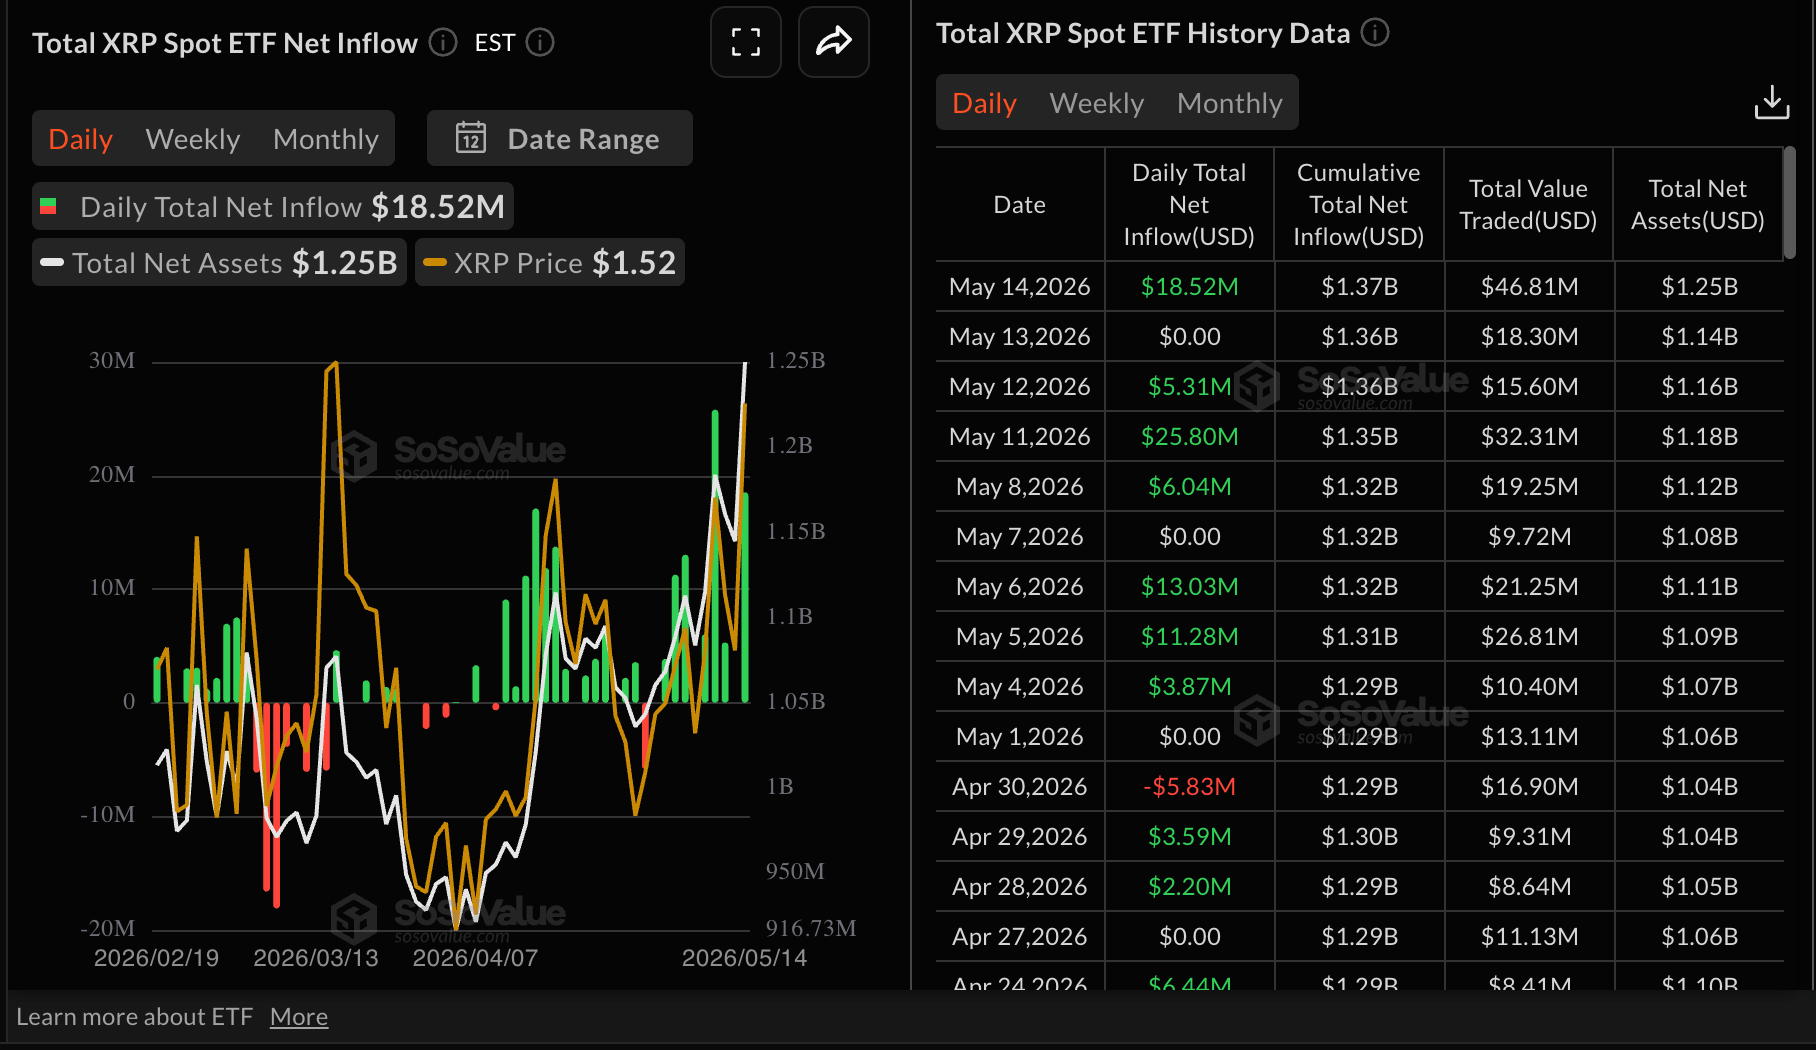
XRP spot ETFs showed significant improvement, attracting nearly $19 million in inflows on Thursday following muted activity the previous day. Cumulative inflows climbed slightly to $1.37 billion, up from $1.36 a day earlier. Total assets under management reached a four-month high of $1.25 billion, underscoring institutions' growing risk appetite.
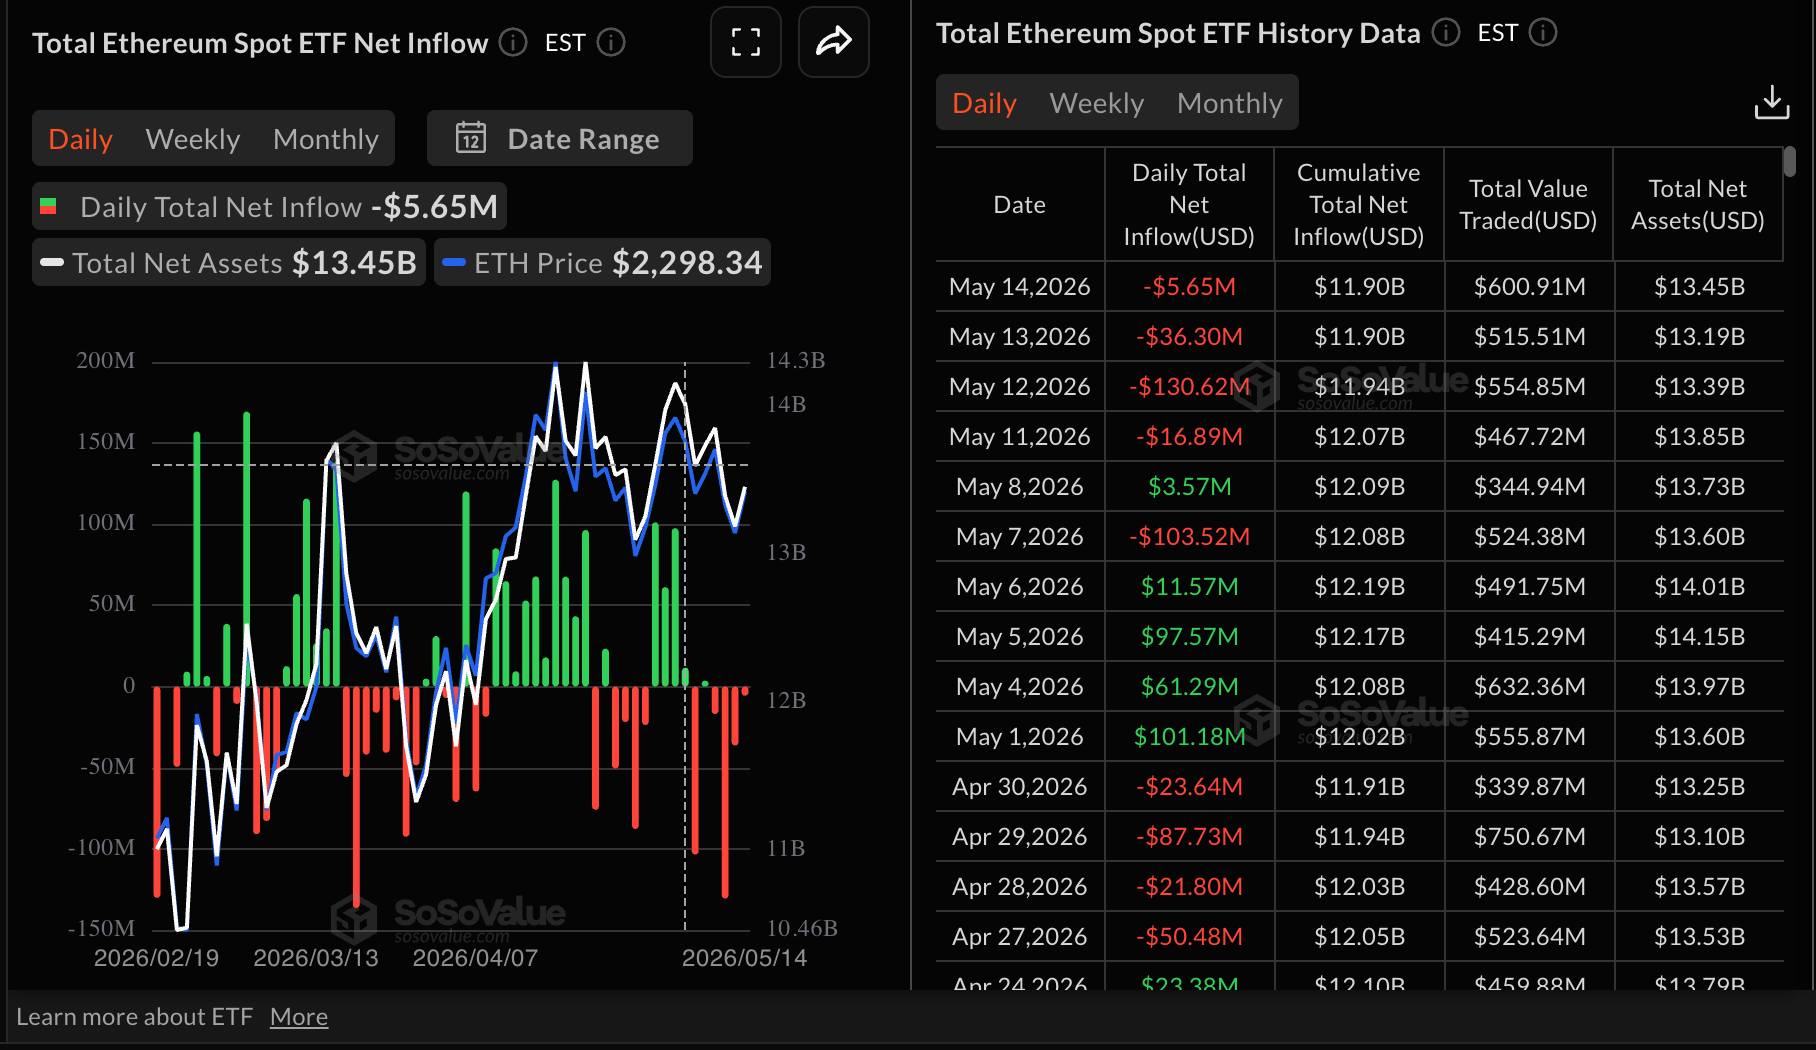
Ethereum spot ETFs, on the other hand, lagged BTC and XRP, as the trend turned bearish, with nearly $6 million in outflows recorded on Thursday. SoSoValue data shows that Ethereum has logged four consecutive days of outflows, bringing cumulative inflows to $11.90 billion and net assets under management to $13.45 billion.
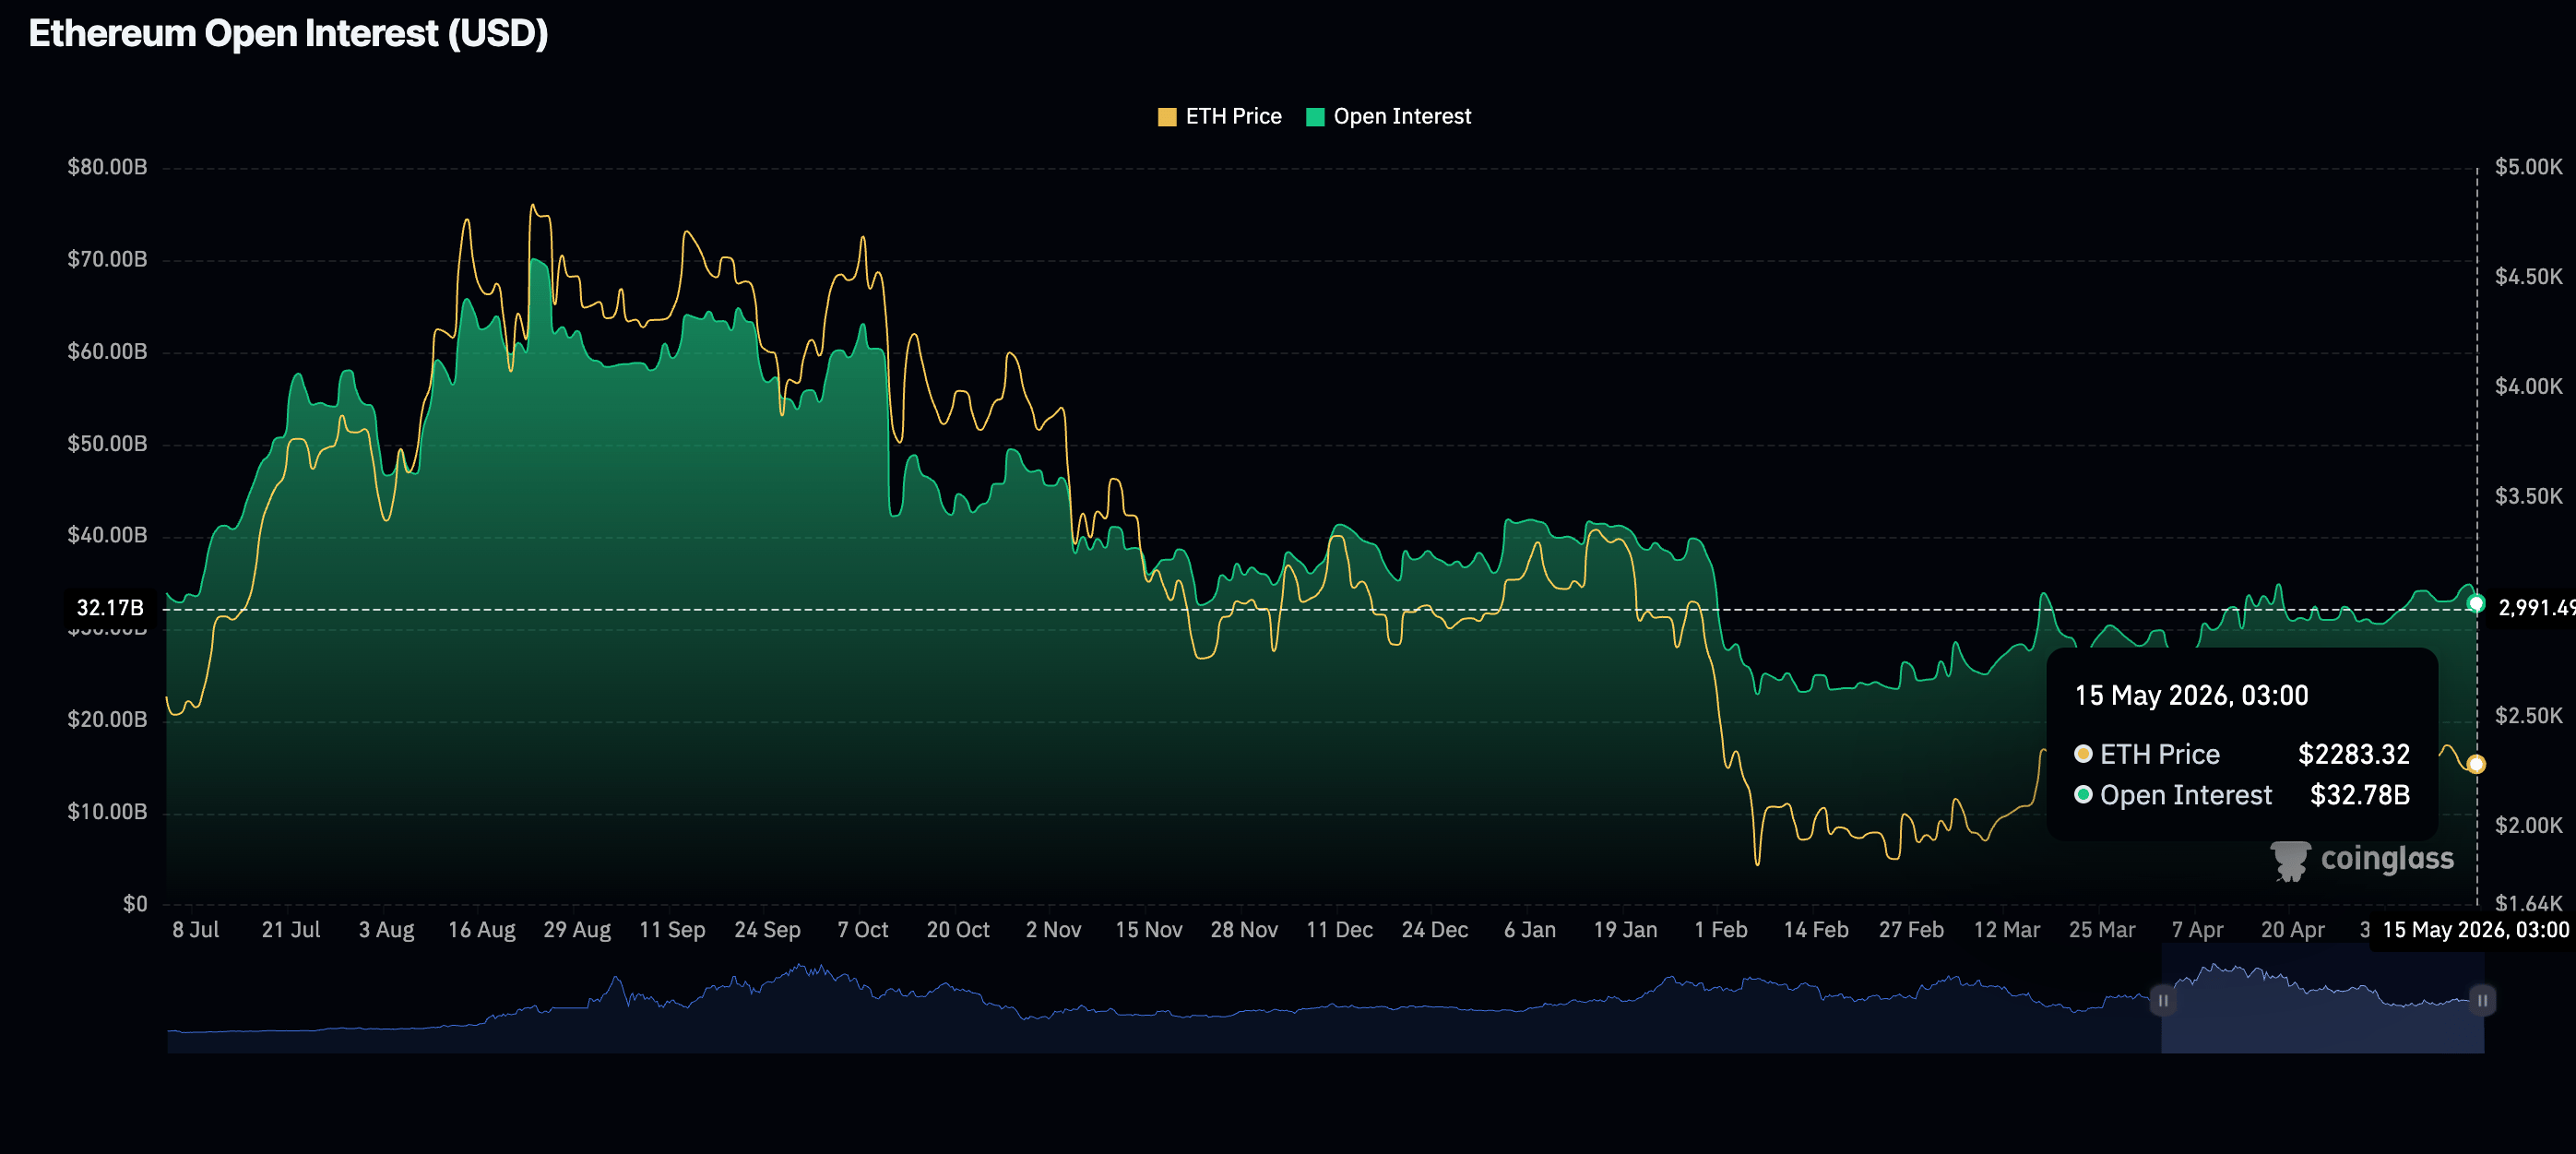
Open Interest (OI) in Ethereum perpetual futures contracted to $32.78 billion on Thursday, a notable drop from $34.82 billion the day before. This trend underscores waning trader confidence in ETH’s recovery prospects, as participants remain reluctant to initiate new positions. Persistently declining OI heightens downside risk for Ethereum, potentially paving the way for a retest of the $2,000 demand zone.
Price analysis: Bitcoin holds $80,000 lifeline support
Bitcoin trades at $80,676, retaining a capped tone as it sits below the 200-day Exponential Moving Average (EMA) at $81,743 while still holding above the rising 50-day and 100-day EMAs clustered just under $76,900. This configuration suggests the broader uptrend remains intact but faces headwinds, with the Parabolic SAR printed higher at $82,688, reinforcing overhead pressure.
Momentum appears mixed. The Relative Strength Index (RSI) at 58 remains in bullish territory on the daily chart, but the Moving Average Convergence Divergence (MACD) histogram has slipped further below the zero line, hinting that bullish attempts may struggle while price remains below the 200-day EMA.
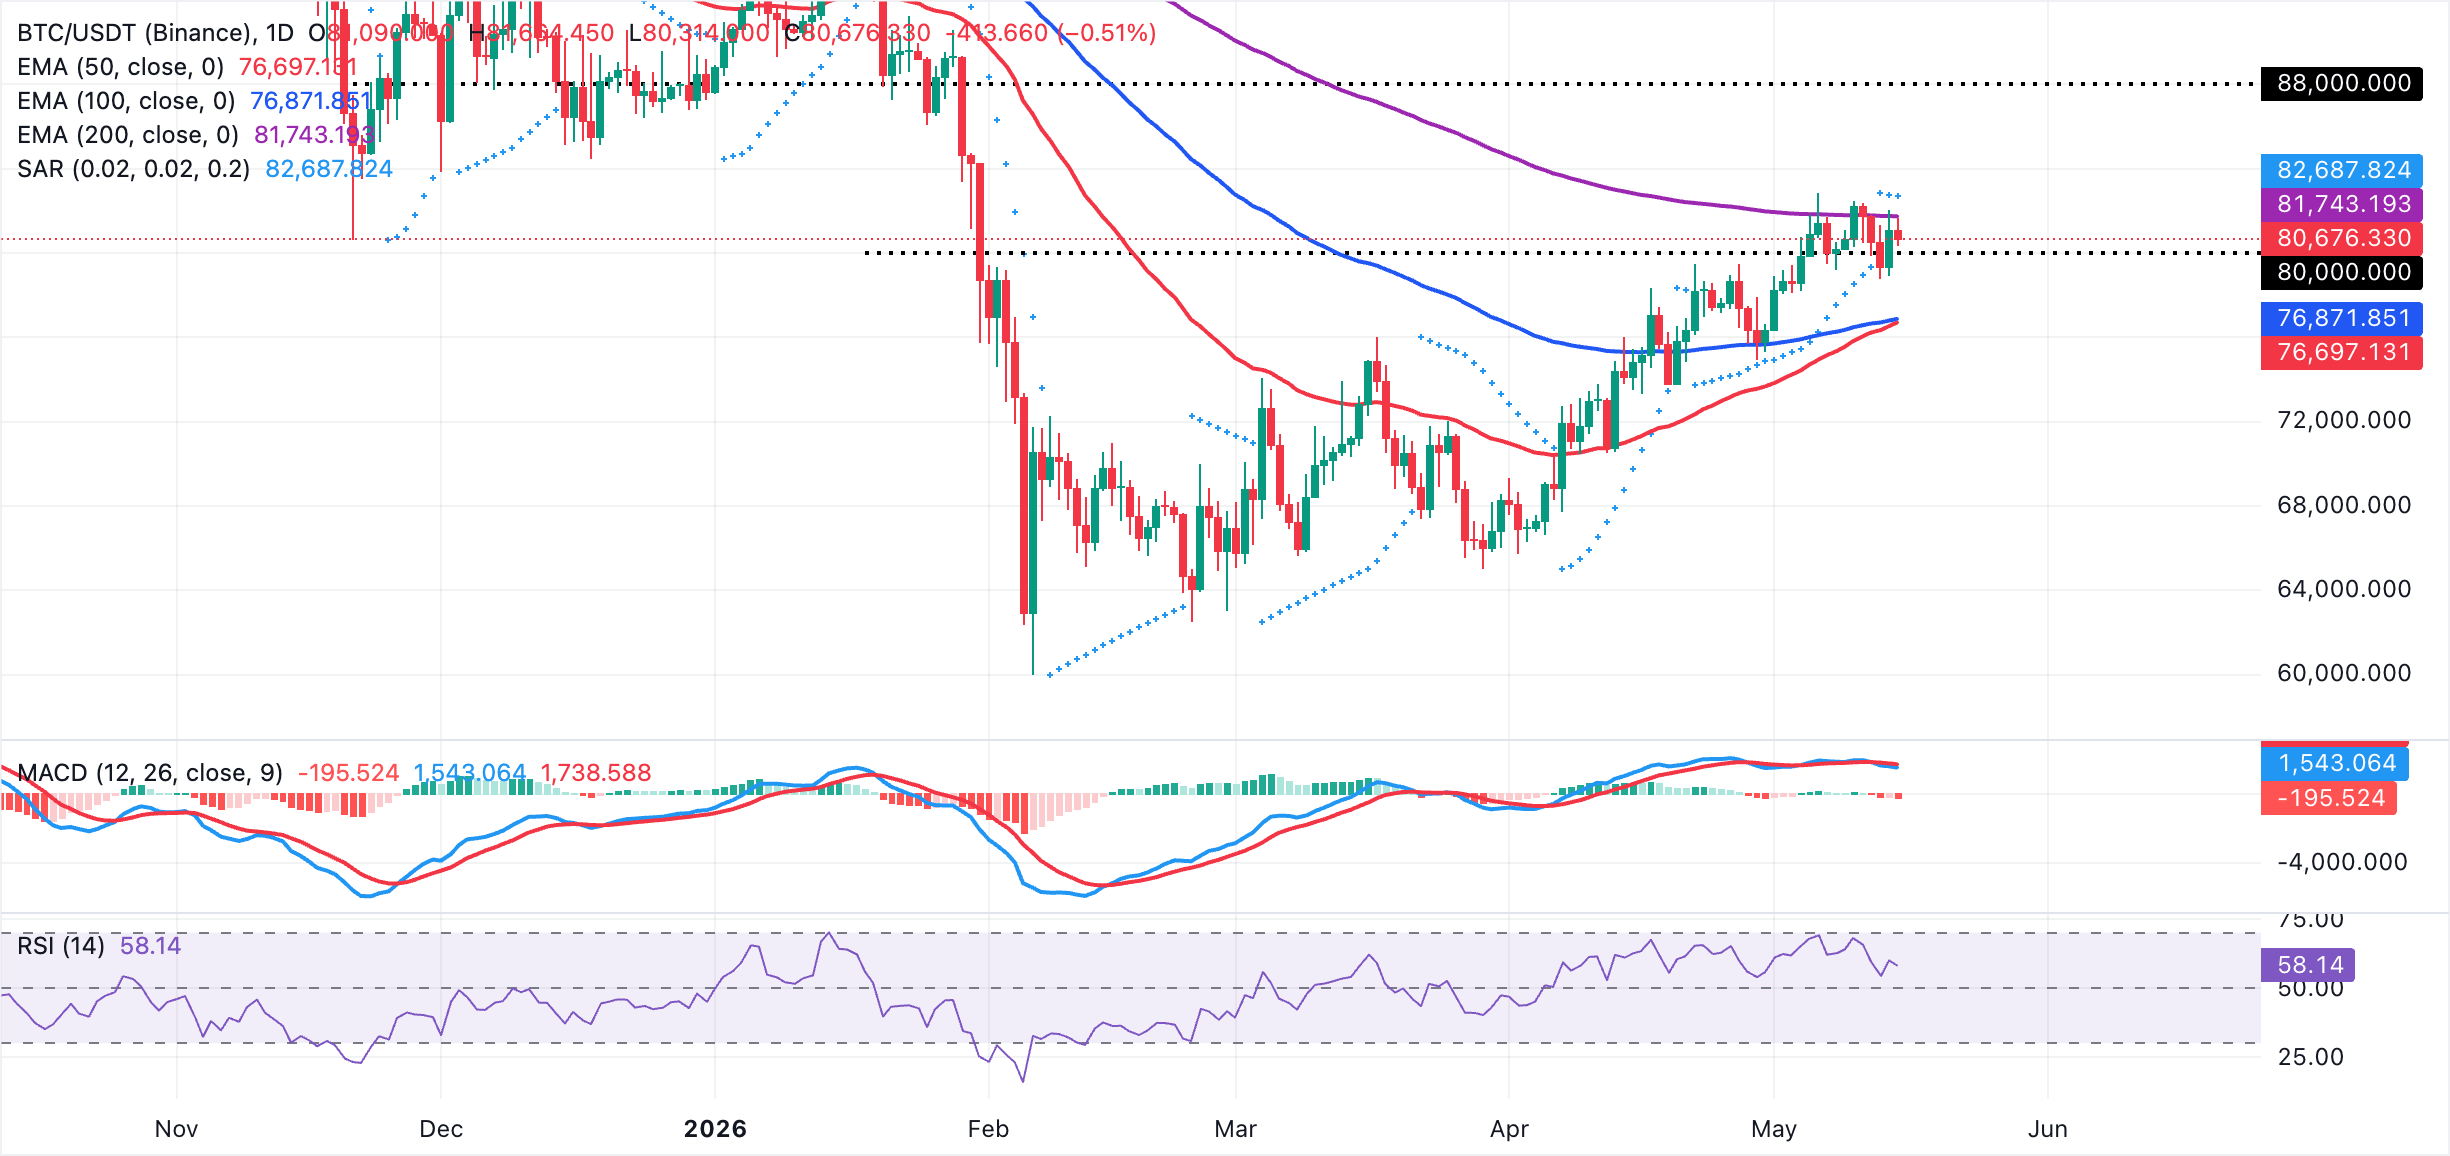
On the topside, initial resistance lies at the mentioned 200-day EMA around $81,743, and a daily close above this barrier would open the way for a retest of the Parabolic SAR level at $82,688. On the downside, immediate support is provided by the 100-day EMA at $76,872, followed closely by the 50-day EMA at $76,698. A break below this support cluster would weaken the near-term structure and expose deeper losses, despite the still-constructive medium-term trend backdrop.
Altcoins technical outlook: Ethereum and XRP slide as selling pressure intensifies
Ethereum trades at $2,258, retaining a bearish near-term tone as price holds beneath a dense band of EMAs. The 50-day EMA at $2,274, the 100-day EMA at $2,337, and the 200-day EMA near $2,547 all sit overhead as layered resistance, reinforced by the Parabolic SAR print around $2,406.
Momentum conditions back this capped structure, with the RSI hovering near 46 on the daily chart and the MACD histogram extending further into negative territory, suggesting downside pressure remains dominant even as volatility cools.
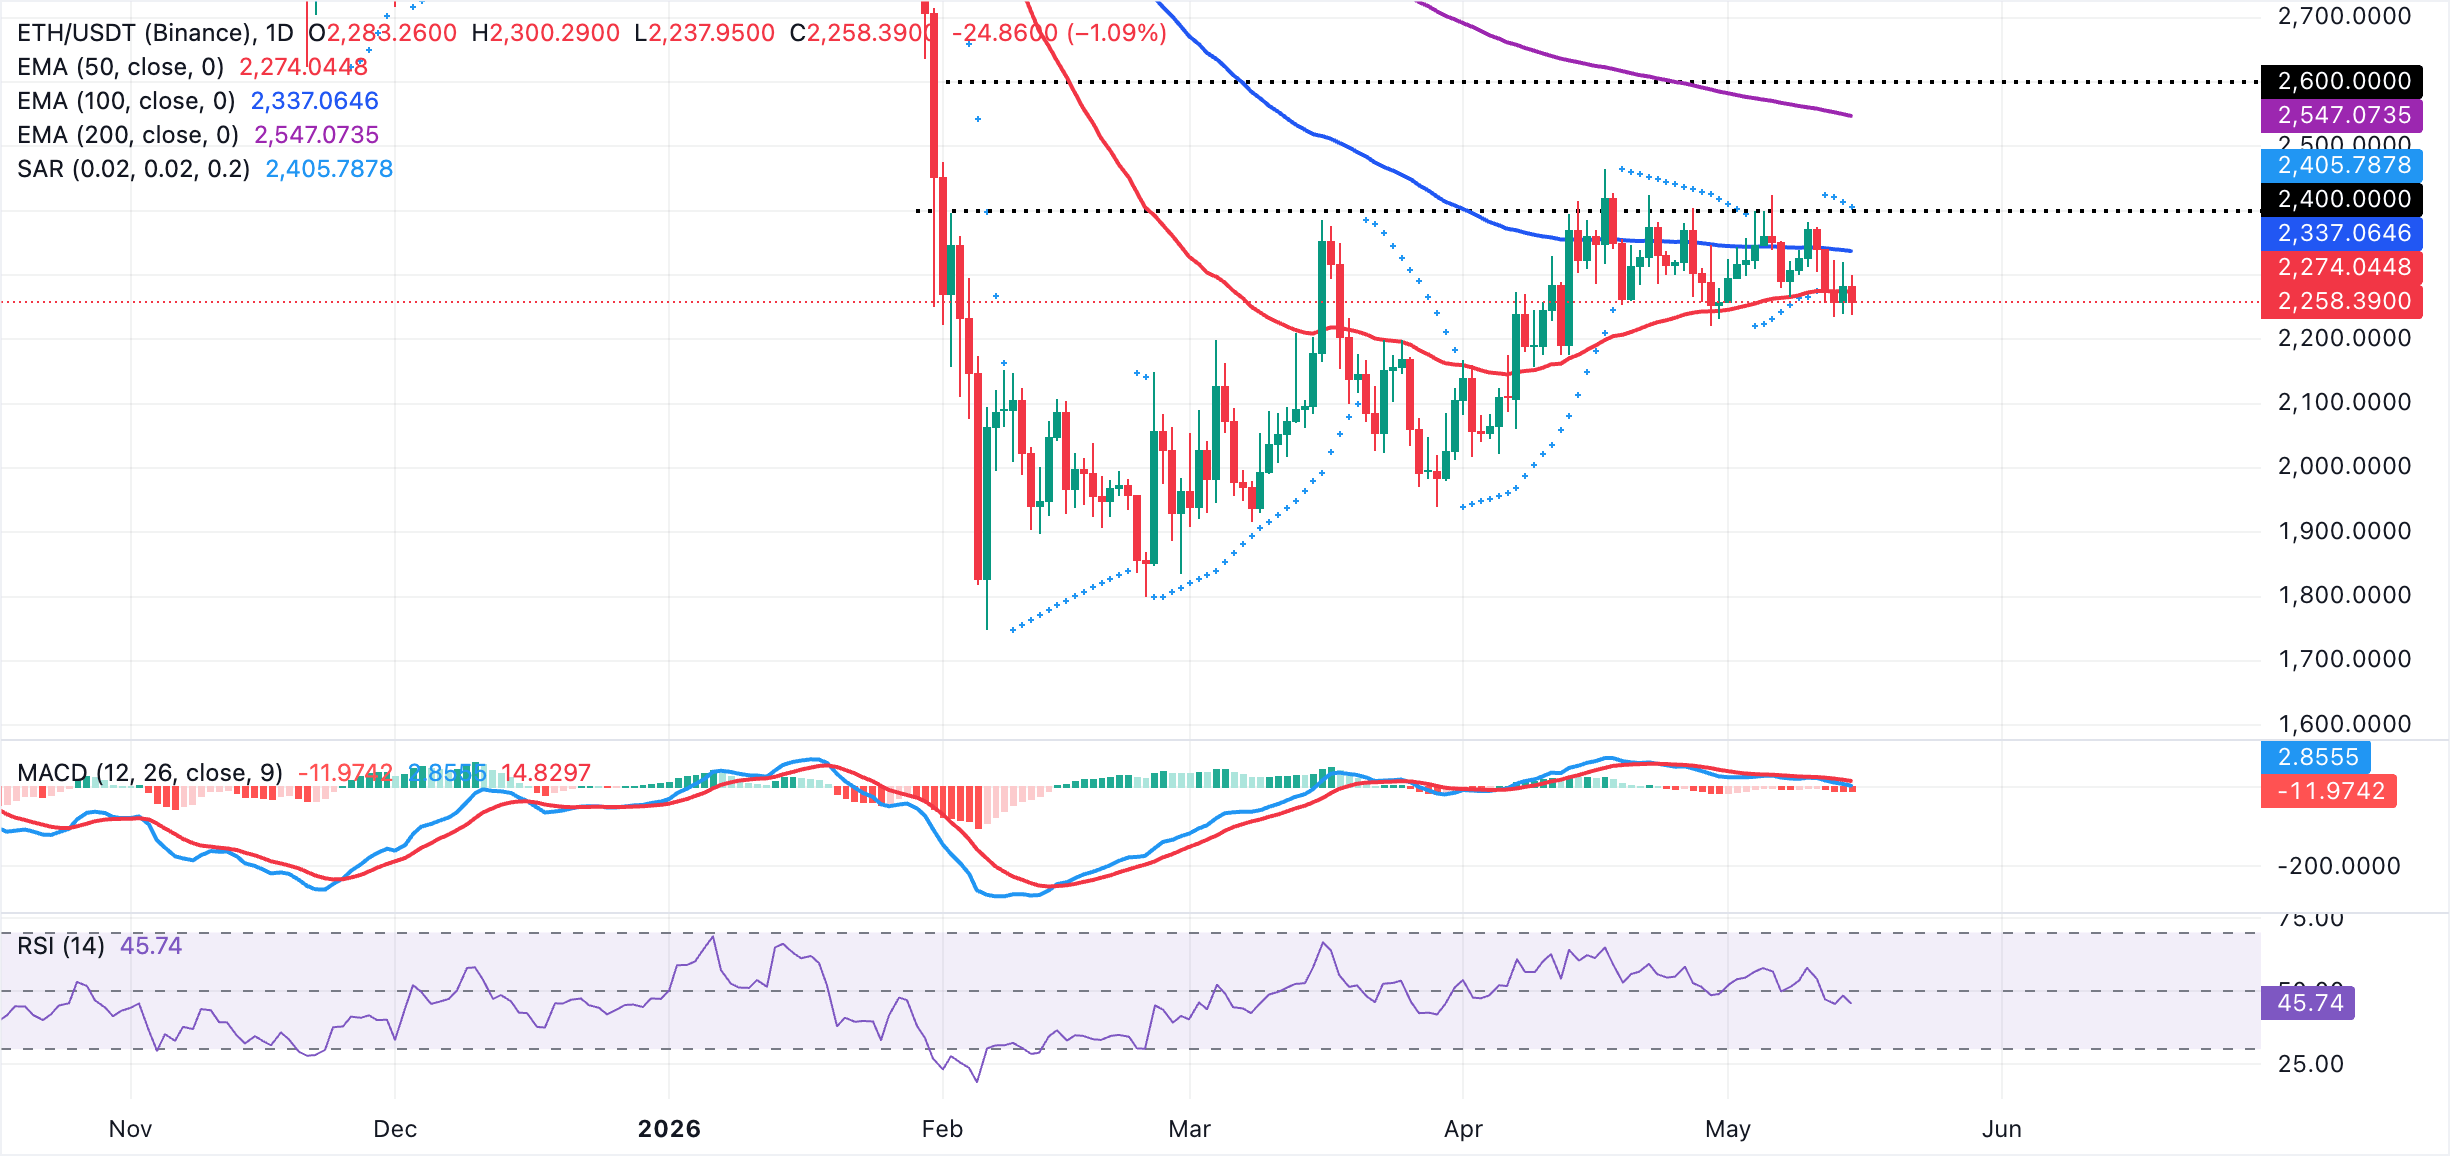
On the topside, initial resistance is now defined by the 50-day EMA at $2,274, with further supply expected around the 100-day EMA at $2,337. The Parabolic SAR level near $2,406 precedes a more strategic barrier at the 200-day EMA at $2,547, which would need to be reclaimed to ease the broader bearish bias. With no clear indicator-based supports on the daily chart, traders may look to prior swing lows and psychological handles at $2,200 and $2,000 for potential demand.
XRP, on the other hand, trades above $1.46, extending a constructive bullish bias as price holds well above the 50-day EMA at $1.42, which converges with the Bollinger Bands middle line.
Momentum readings back the positive tone, with the RSI hovering near 58 in bullish territory on the daily chart and the MACD histogram remaining in positive ground. Such an outlook suggests that dips could attract buying interest while the short-term trend stays supported above the nearby averages.
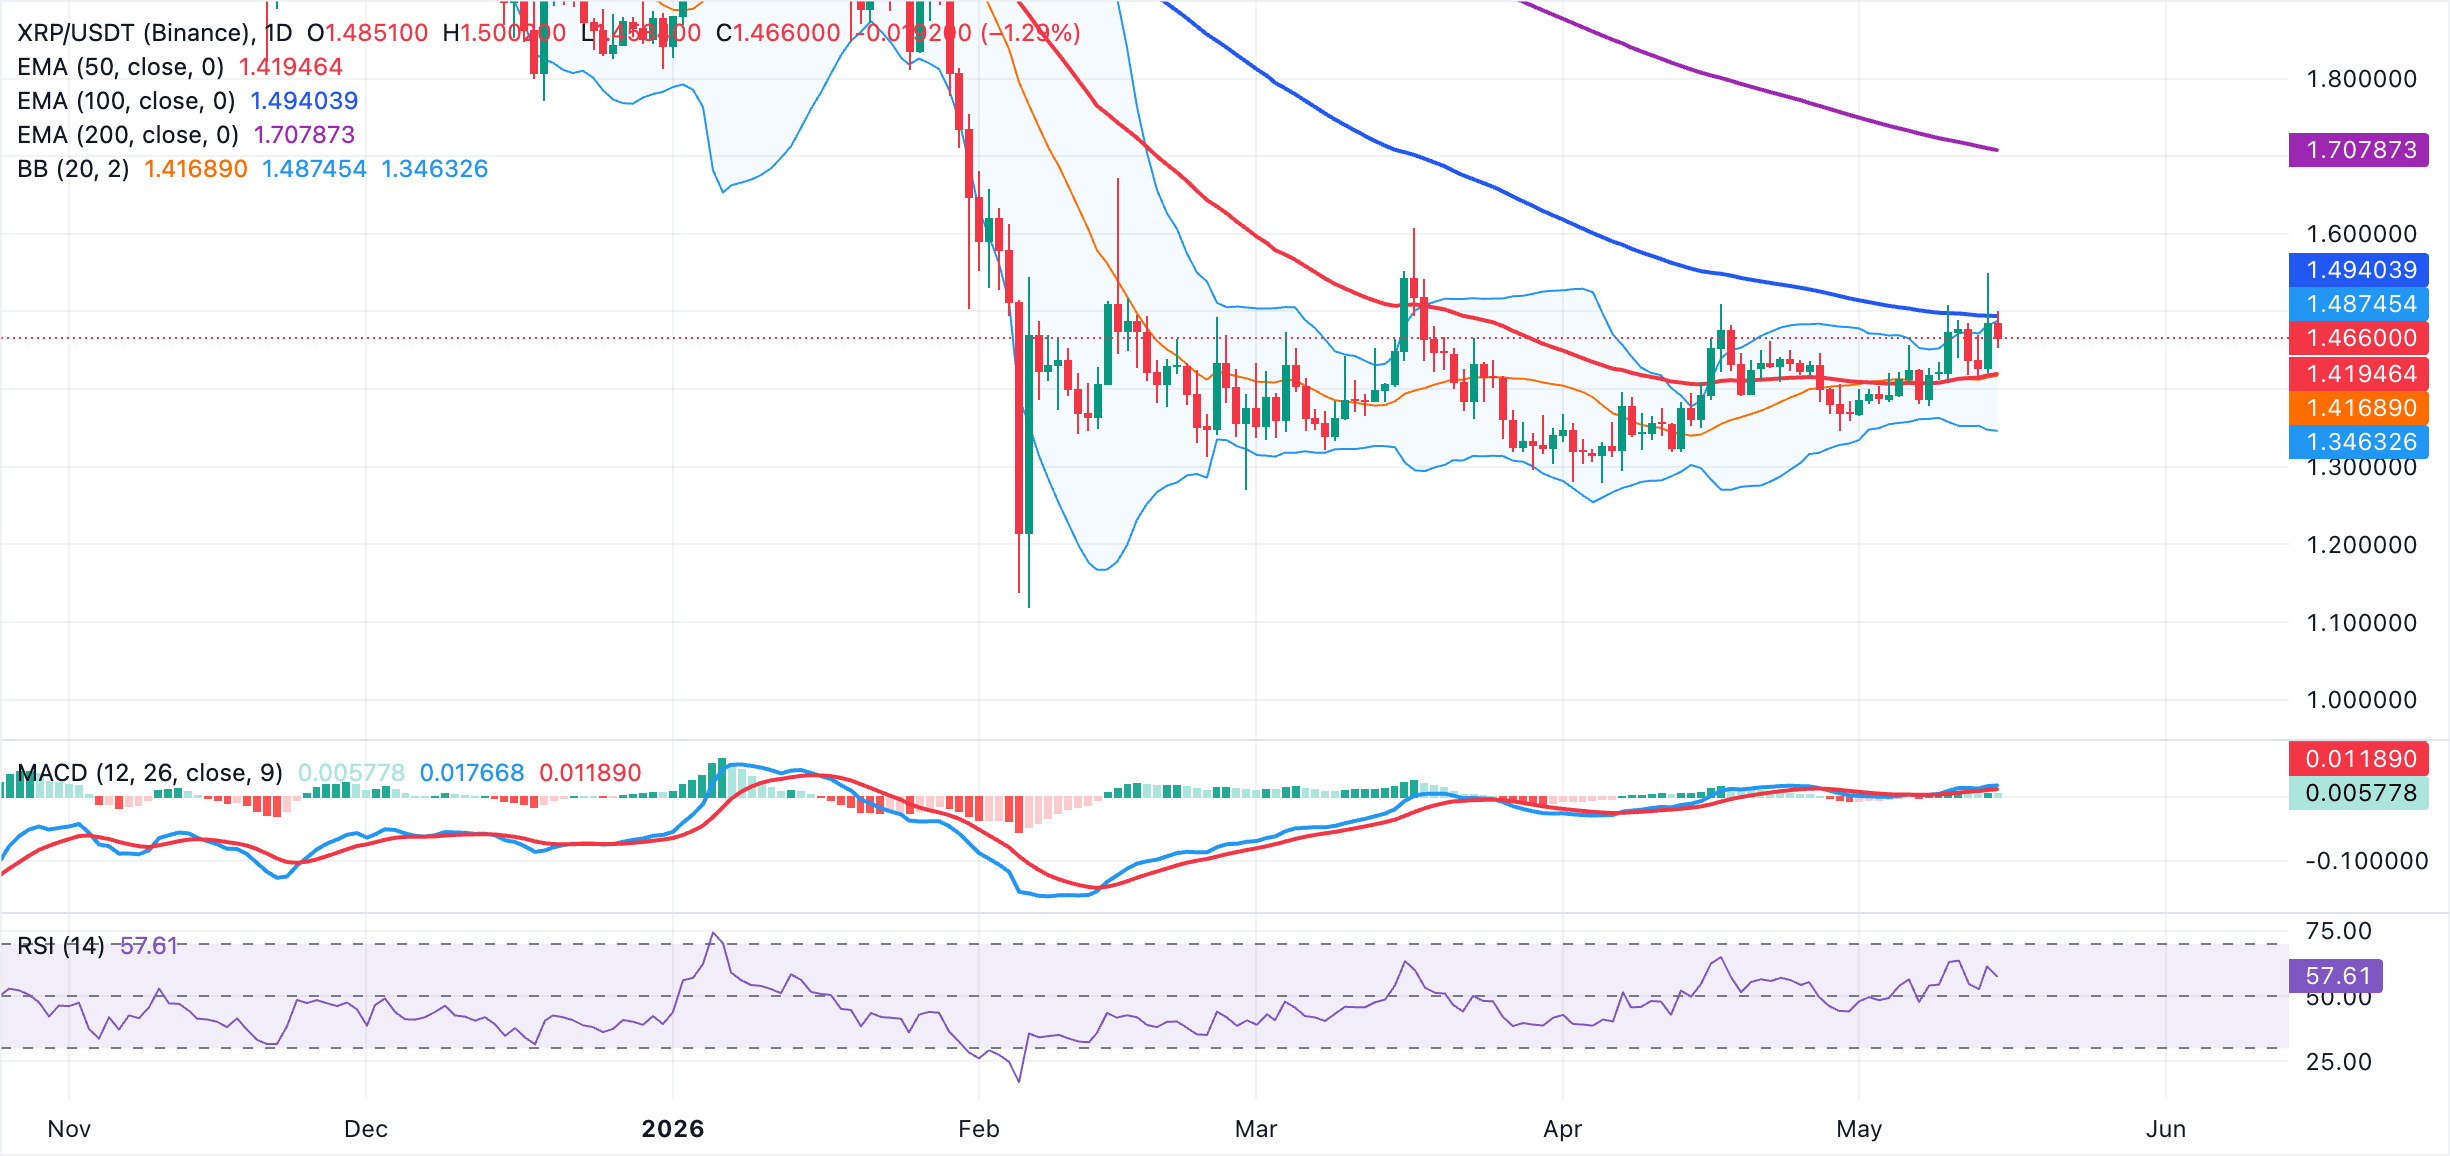
On the topside, immediate resistance is aligned with the upper Bollinger Band at $1.49, which also coincides with the 100-day EMA, while the 200-day EMA, at $1.71, marks a more strategic bullish objective if buyers sustain control. On the downside, initial support is provided by the 50-day EMA at $1.42, reinforced by the Bollinger middle band. The lower Bollinger band, down at $1.35, is serving as a deeper demand area should a broader correction unfold.
(The technical analysis of this story was written with the help of an AI tool.)
Bitcoin, altcoins, stablecoins FAQs
Bitcoin is the largest cryptocurrency by market capitalization, a virtual currency designed to serve as money. This form of payment cannot be controlled by any one person, group, or entity, which eliminates the need for third-party participation during financial transactions.
Altcoins are any cryptocurrency apart from Bitcoin, but some also regard Ethereum as a non-altcoin because it is from these two cryptocurrencies that forking happens. If this is true, then Litecoin is the first altcoin, forked from the Bitcoin protocol and, therefore, an “improved” version of it.
Stablecoins are cryptocurrencies designed to have a stable price, with their value backed by a reserve of the asset it represents. To achieve this, the value of any one stablecoin is pegged to a commodity or financial instrument, such as the US Dollar (USD), with its supply regulated by an algorithm or demand. The main goal of stablecoins is to provide an on/off-ramp for investors willing to trade and invest in cryptocurrencies. Stablecoins also allow investors to store value since cryptocurrencies, in general, are subject to volatility.
Bitcoin dominance is the ratio of Bitcoin's market capitalization to the total market capitalization of all cryptocurrencies combined. It provides a clear picture of Bitcoin’s interest among investors. A high BTC dominance typically happens before and during a bull run, in which investors resort to investing in relatively stable and high market capitalization cryptocurrency like Bitcoin. A drop in BTC dominance usually means that investors are moving their capital and/or profits to altcoins in a quest for higher returns, which usually triggers an explosion of altcoin rallies.

More than a million users rely on FXStreet for real-time market data, charting tools, expert insights, and forex news. Its comprehensive economic calendar and educational webinars help traders stay informed and make calculated decisions. FXStreet is supported by a team of about 60 professionals, split between the Barcelona headquarters and various global regions.
Read More


