
Crypto Today: Bitcoin, Ethereum, XRP recover after US-Iran war ceasefire
By John Isige
Updated: 8 Apr 2026


POPULAR ARTICLES

Cryptocurrency prices are broadly holding steady on Wednesday after United States (US) President Donald Trump wrote on his Truth Social platform, "I agree to suspend the bombing and attack of Iran for a period of two weeks".
- Bitcoin holds above $71,000 as sentiment improves slightly after Trump suspended attacks on Iran.
- Ethereum extends gains above $2,250, supported by an improving technical structure and rising risk appetite.
- XRP trades above $1.37 as momentum indicators rise, with the MACD confirming a buy signal.
Cryptocurrency prices are broadly holding steady on Wednesday after United States (US) President Donald Trump wrote on his Truth Social platform, "I agree to suspend the bombing and attack of Iran for a period of two weeks".
Bitcoin (BTC) holds above $71,000, from the previous day’s low of $67,732, while Ethereum (ETH) edges up above $2,250. Meanwhile, XRP has recovered to trade above $1.37, buoyed by ceasefire-driven positive market sentiment.
BTC, ETH and XRP rebound as Iran agrees to reopen the Strait of Hormuz
US President Trump announced on Tuesday that he has suspended attacks on Iran. The ceasefire is conditional on Iran keeping the Strait of Hormuz open. Earlier, global markets were on edge as Trump had warned that “a whole civilisation will die tonight” if Iran did not strike a deal before the deadline.
The Middle Eastern country reiterated Trump’s ceasefire announcement, saying that it will allow the safe passage of maritime traffic through the Strait of Hormuz for two weeks. Iranian Foreign Minister Abbas Araghchi added that the regime will stop military strikes as long as it is not attacked.
Iran closed the Strait of Hormuz, cutting off 20% of the world’s Oil and Gas supplies during the war, which started in late February. West Texas Intermediary Oil prices surged above $100, sending shockwaves through markets and forcing central banks to rethink their monetary policy.
A ceasefire could bring relief in markets and potentially ease macroeconomic uncertainty. The crypto market shows signs of risk appetite returning, supported by the Fear & Greed Index rising to 17 in the extreme fear territory on Wednesday, from 11 the previous day.
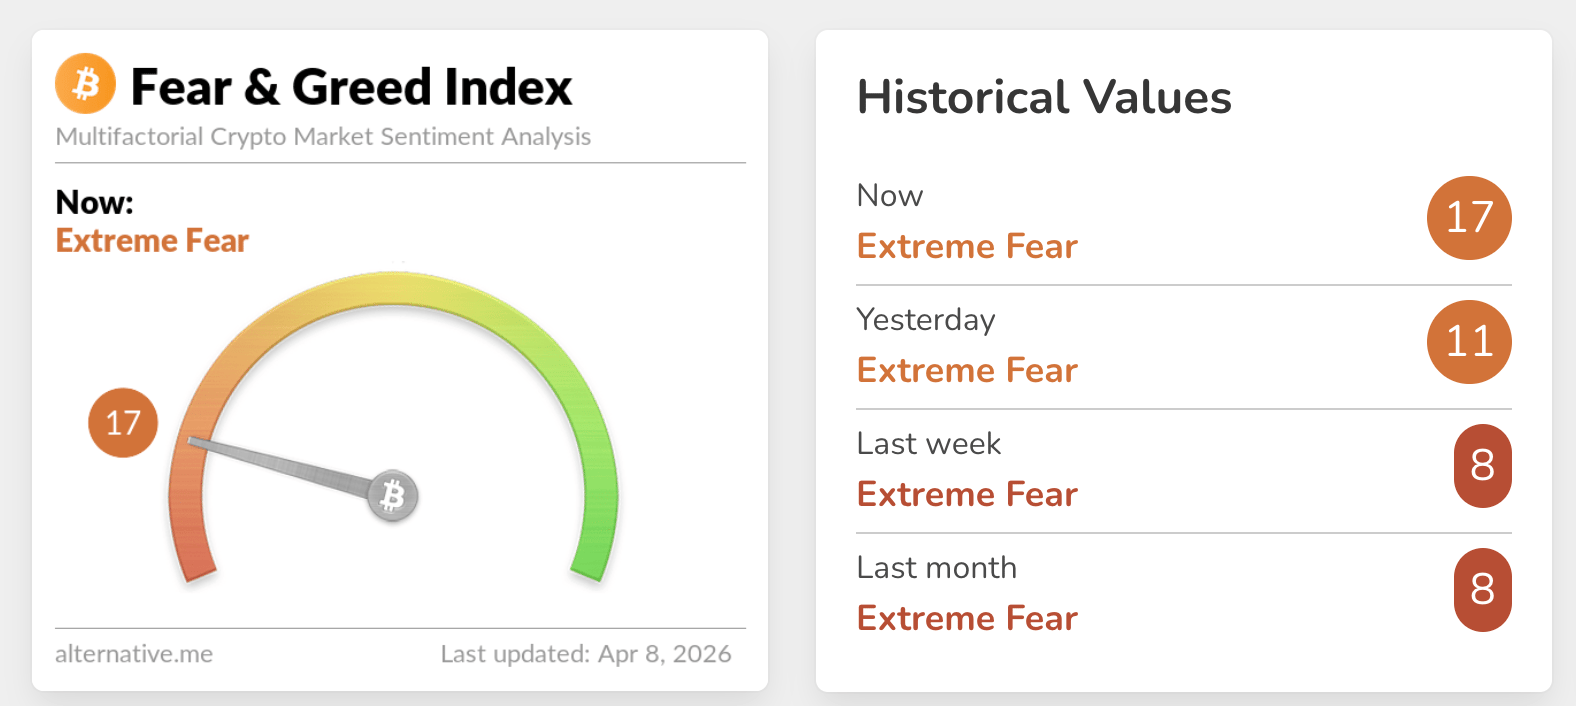
Chart of the day: Bitcoin seeks higher support
Bitcoin steadies above $71,000, with a mildly bullish near-term bias. The price holds above the 50-day Exponential Moving Average near $70,500, framing an established broader uptrend. Momentum, as measured by the Moving Average Convergence Divergence (MACD) indicator, has shifted back into positive territory, with the MACD above its signal line and the histogram expanding on the daily chart. This outlook reflects strengthening upside pressure, while the Relative Strength Index (RSI) on the same chart holds in the high-50s, confirming a positive but not overbought backdrop.
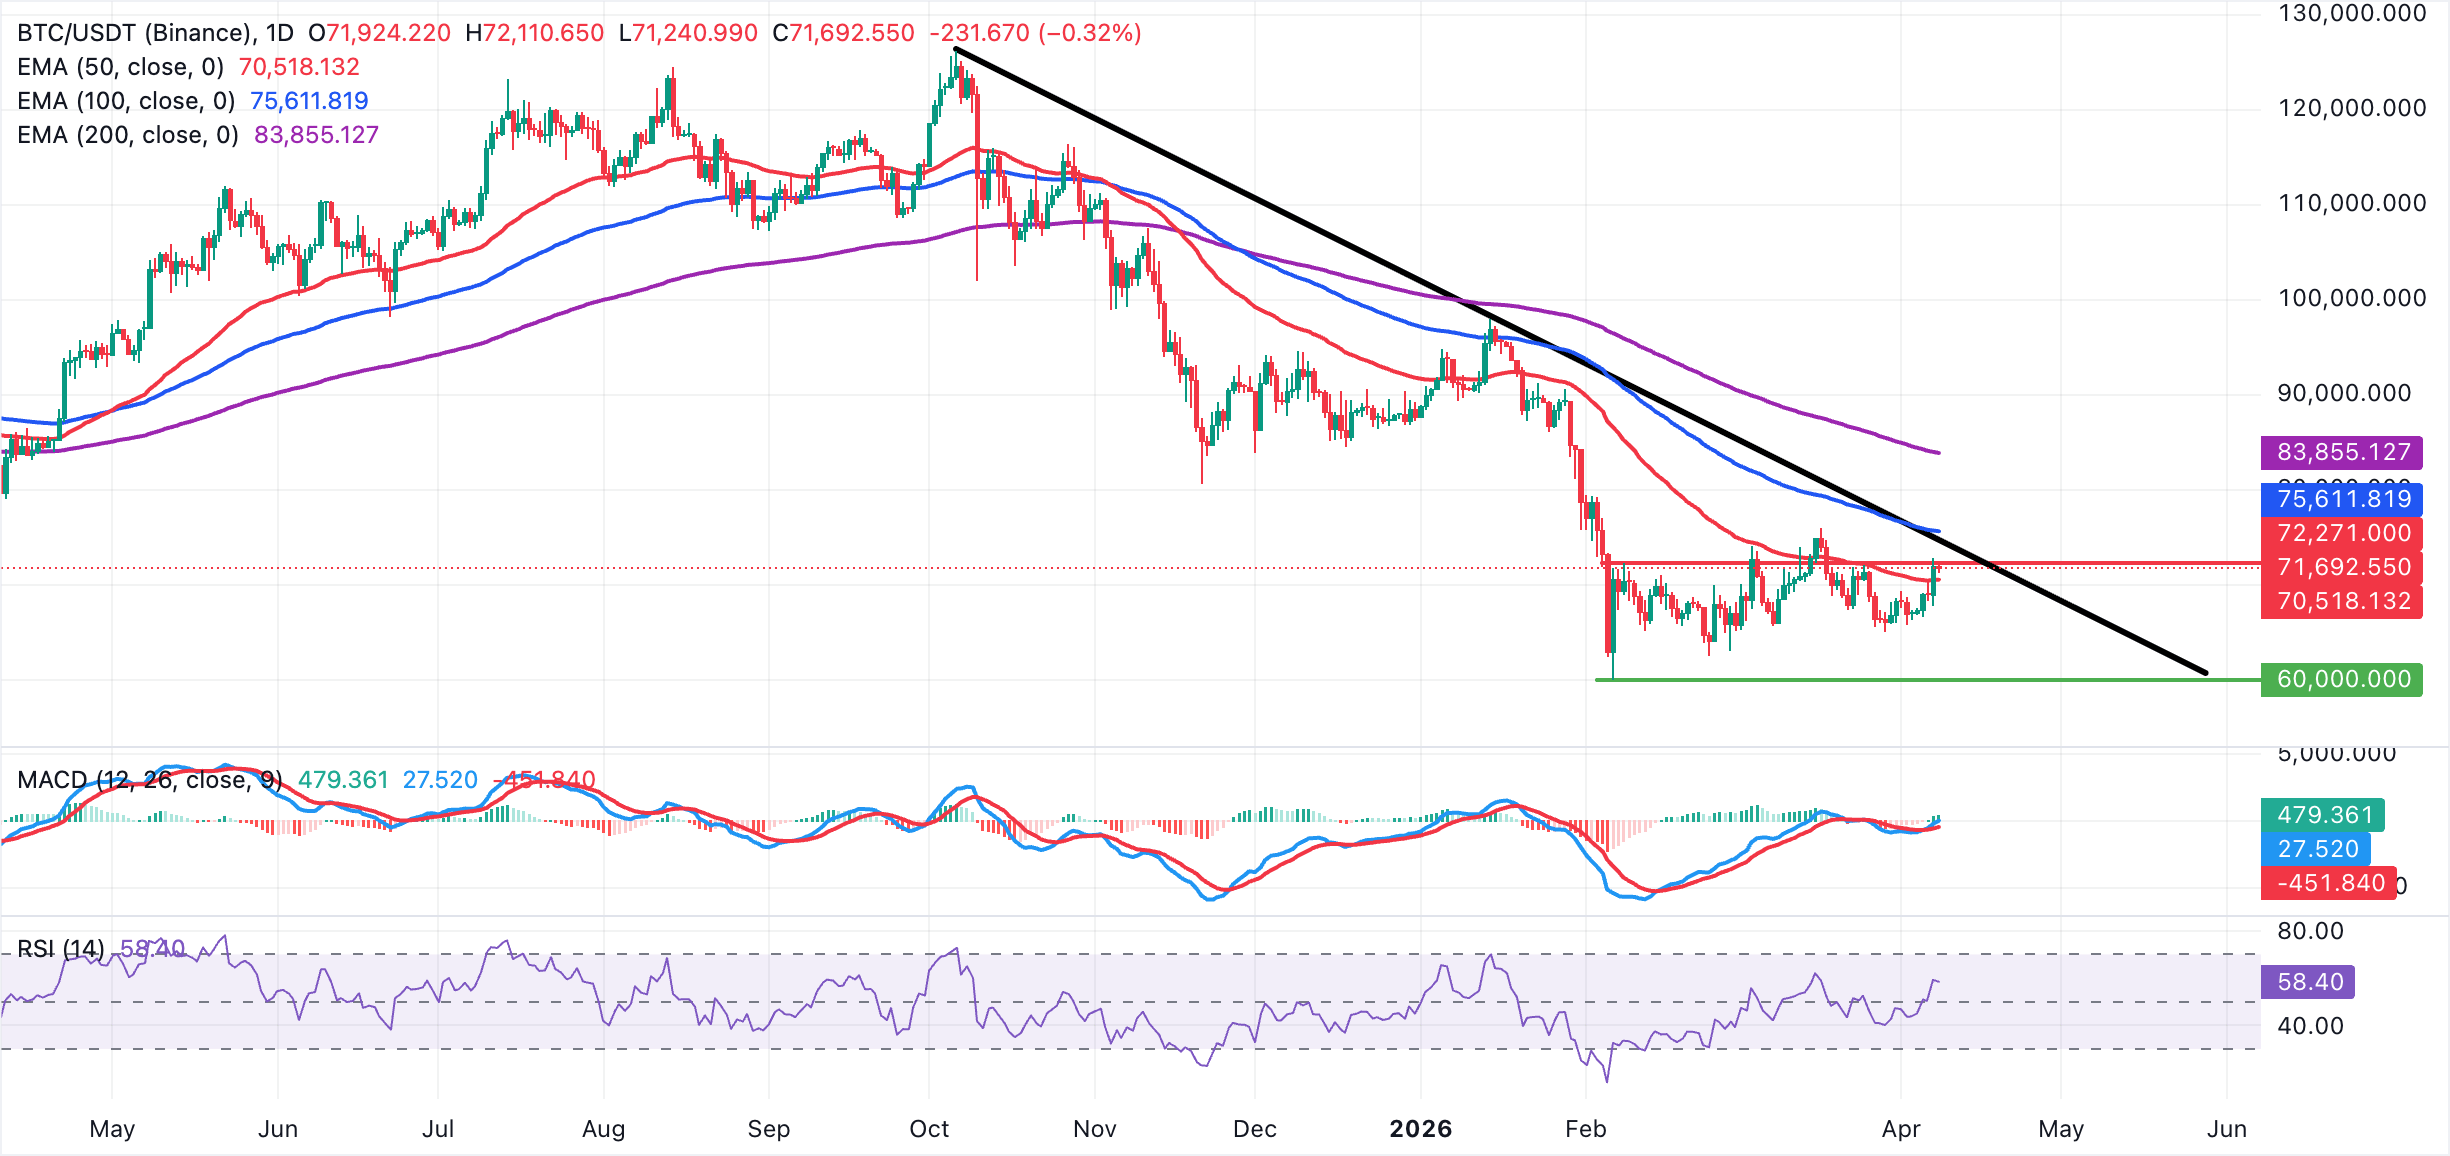
Initial resistance emerges at the recent swing high near $71,900, with a decisive break opening the path toward the horizontal hurdle at $72,271. Above these barriers, focus would shift to the 100-day EMA at $75,612 and the psychological $76,000 region as the next upside objective.
On the downside, immediate support is seen at the 50-day EMA around $70,500, with a daily close below exposing the $68,800–$68,300 band defined by recent reaction lows. A loss of that area would weaken the current bullish bias and bring the mid-$66,000s into view as deeper support within the broader uptrend structure.
Altcoins technical outlook: Ethereum and XRP extend gains
Ethereum is trading above $2,250 at the time of writing on Wednesday. Its near-term bias is cautiously bullish after price reclaimed the 50-day EMA near $2,150, with the broader 100-day and 200-day averages still well above and flagging a dominant longer-term downtrend.
The ETH price is stabilizing just under the long-standing descending resistance trendline, while the MACD indicator holds above the signal line on the daily chart, with the histogram extending modestly, suggesting improving upside momentum. The RSI at 61 stays in positive territory but below overbought, reinforcing a recovery tone rather than a runaway rally.
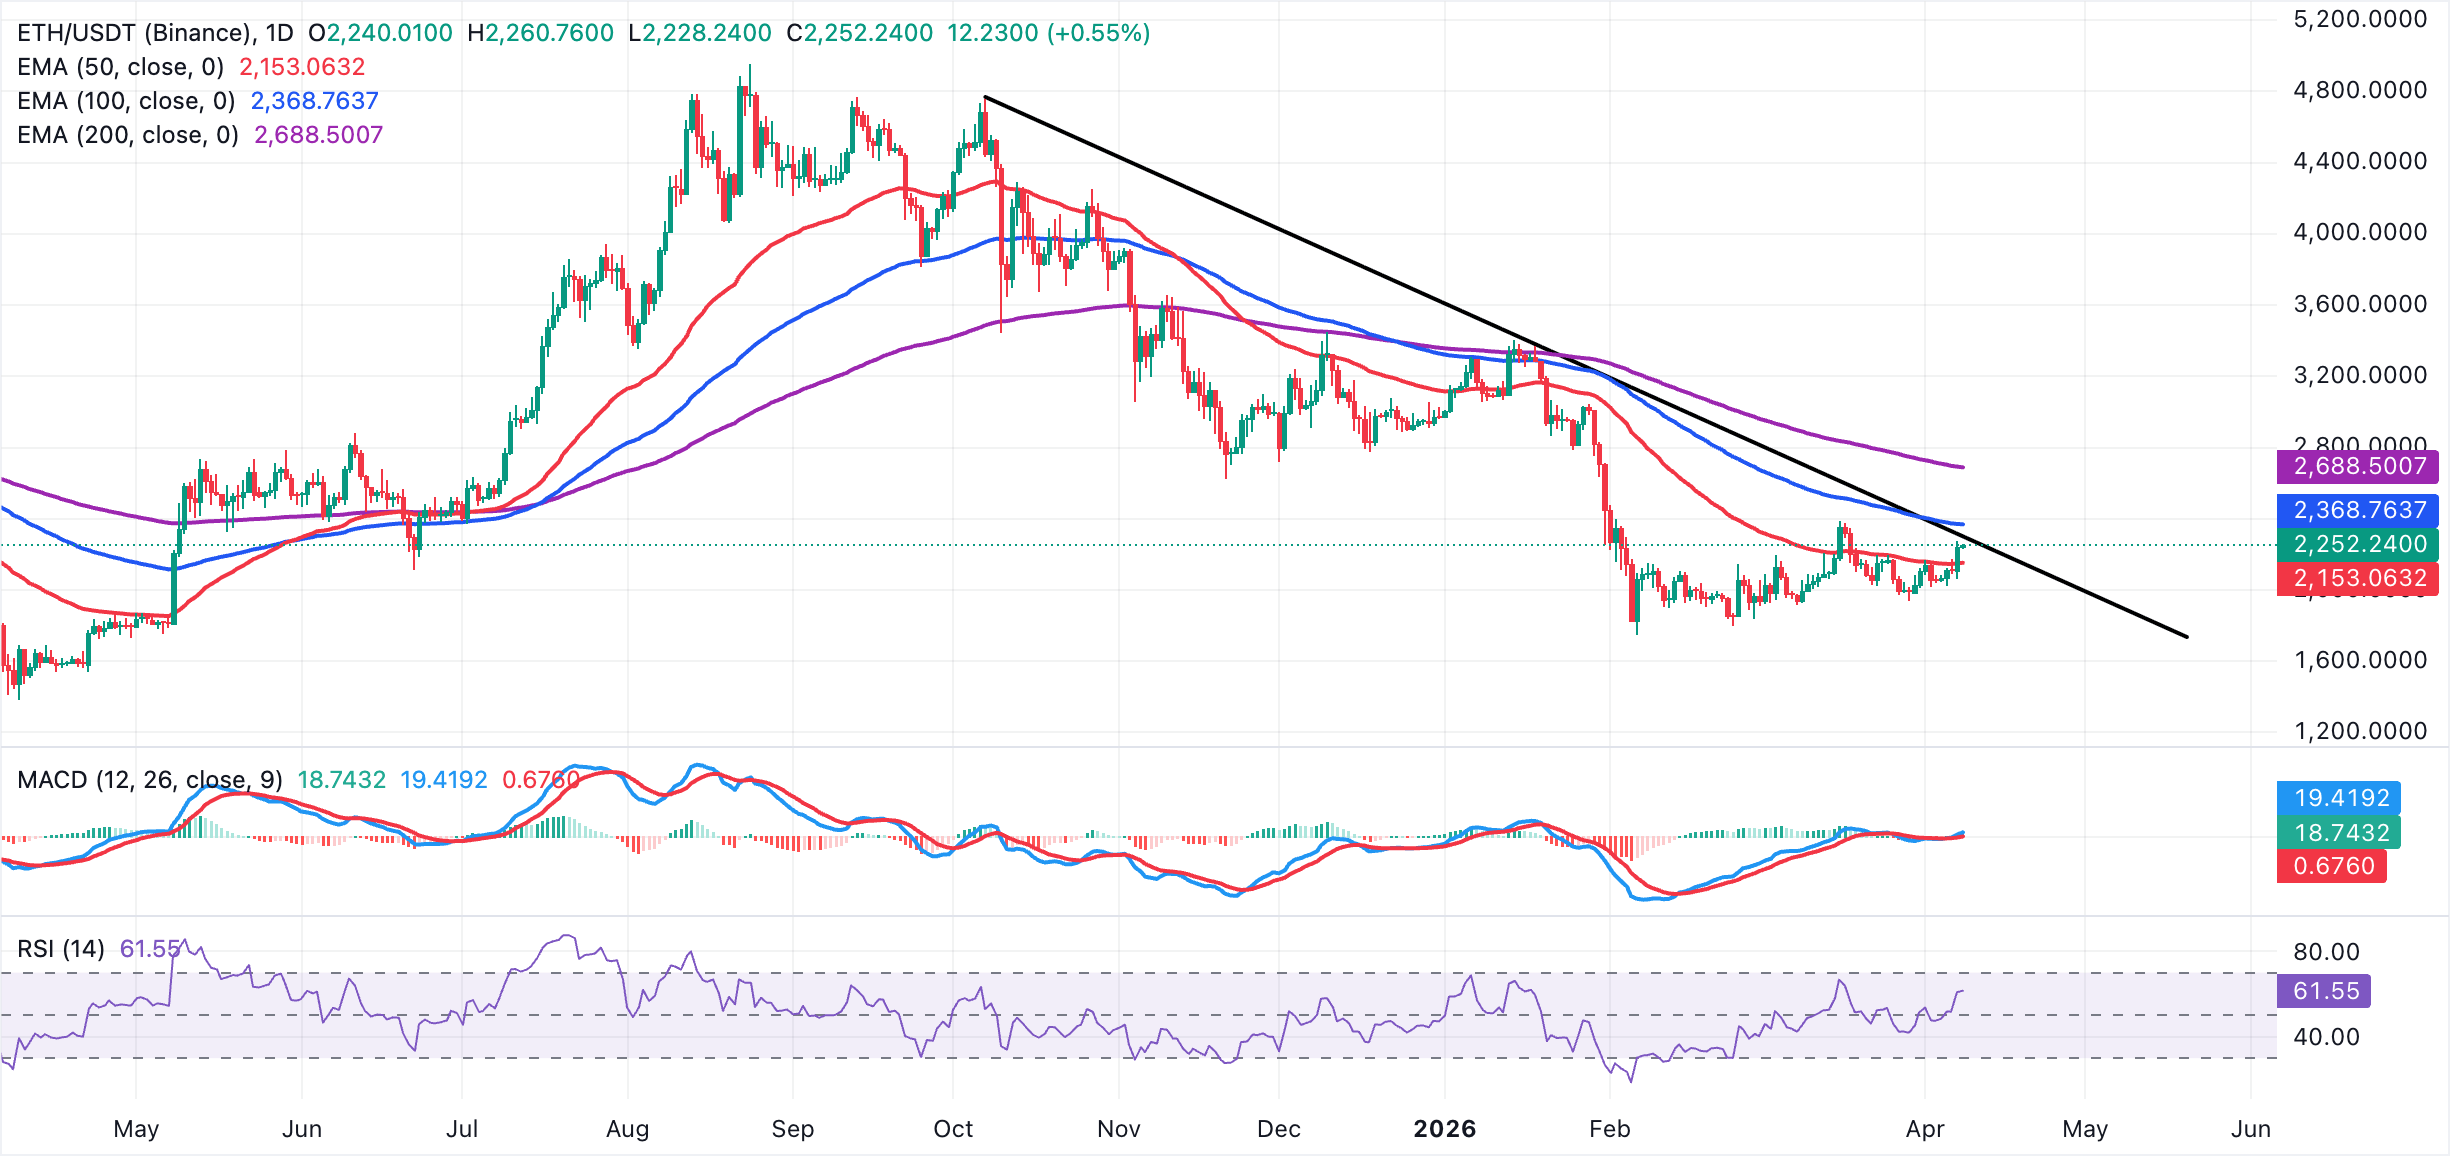
Ethereum's initial support emerges at $2,150, where the 50-day EMA aligns with recent pullback lows, followed by a deeper layer around $2,000 that capped the late-March sell-off and now underpins the current advance. A break below that support area would expose the $1,850 region, where previous consolidation developed.
On the topside, immediate resistance lies at $2,300, along the descending trendline with a sustained close above this barrier opening the way toward the 100-day EMA at $2,368 and then the $2,450 area as the next upside objectives. As long as ETH holds above $2,150, dips are likely to be treated as corrective within this nascent bullish phase.
As for XRP, its near-term bias is mildly bearish as price holds below the descending resistance trendline and remains capped beneath the falling 50-day EMA, which now tracks just above $1.40. The 100-day and 200-day EMAs are hovering above the spot and slope lower, framing the broader move as a corrective phase within a longer-term downtrend.
Momentum is stabilizing, as reflected by the MACD indicator sitting above its signal line on the daily chart, while the RSI is near 51, only pointing to a neutral, range-bound undertone after recovering from prior sub-50 readings.
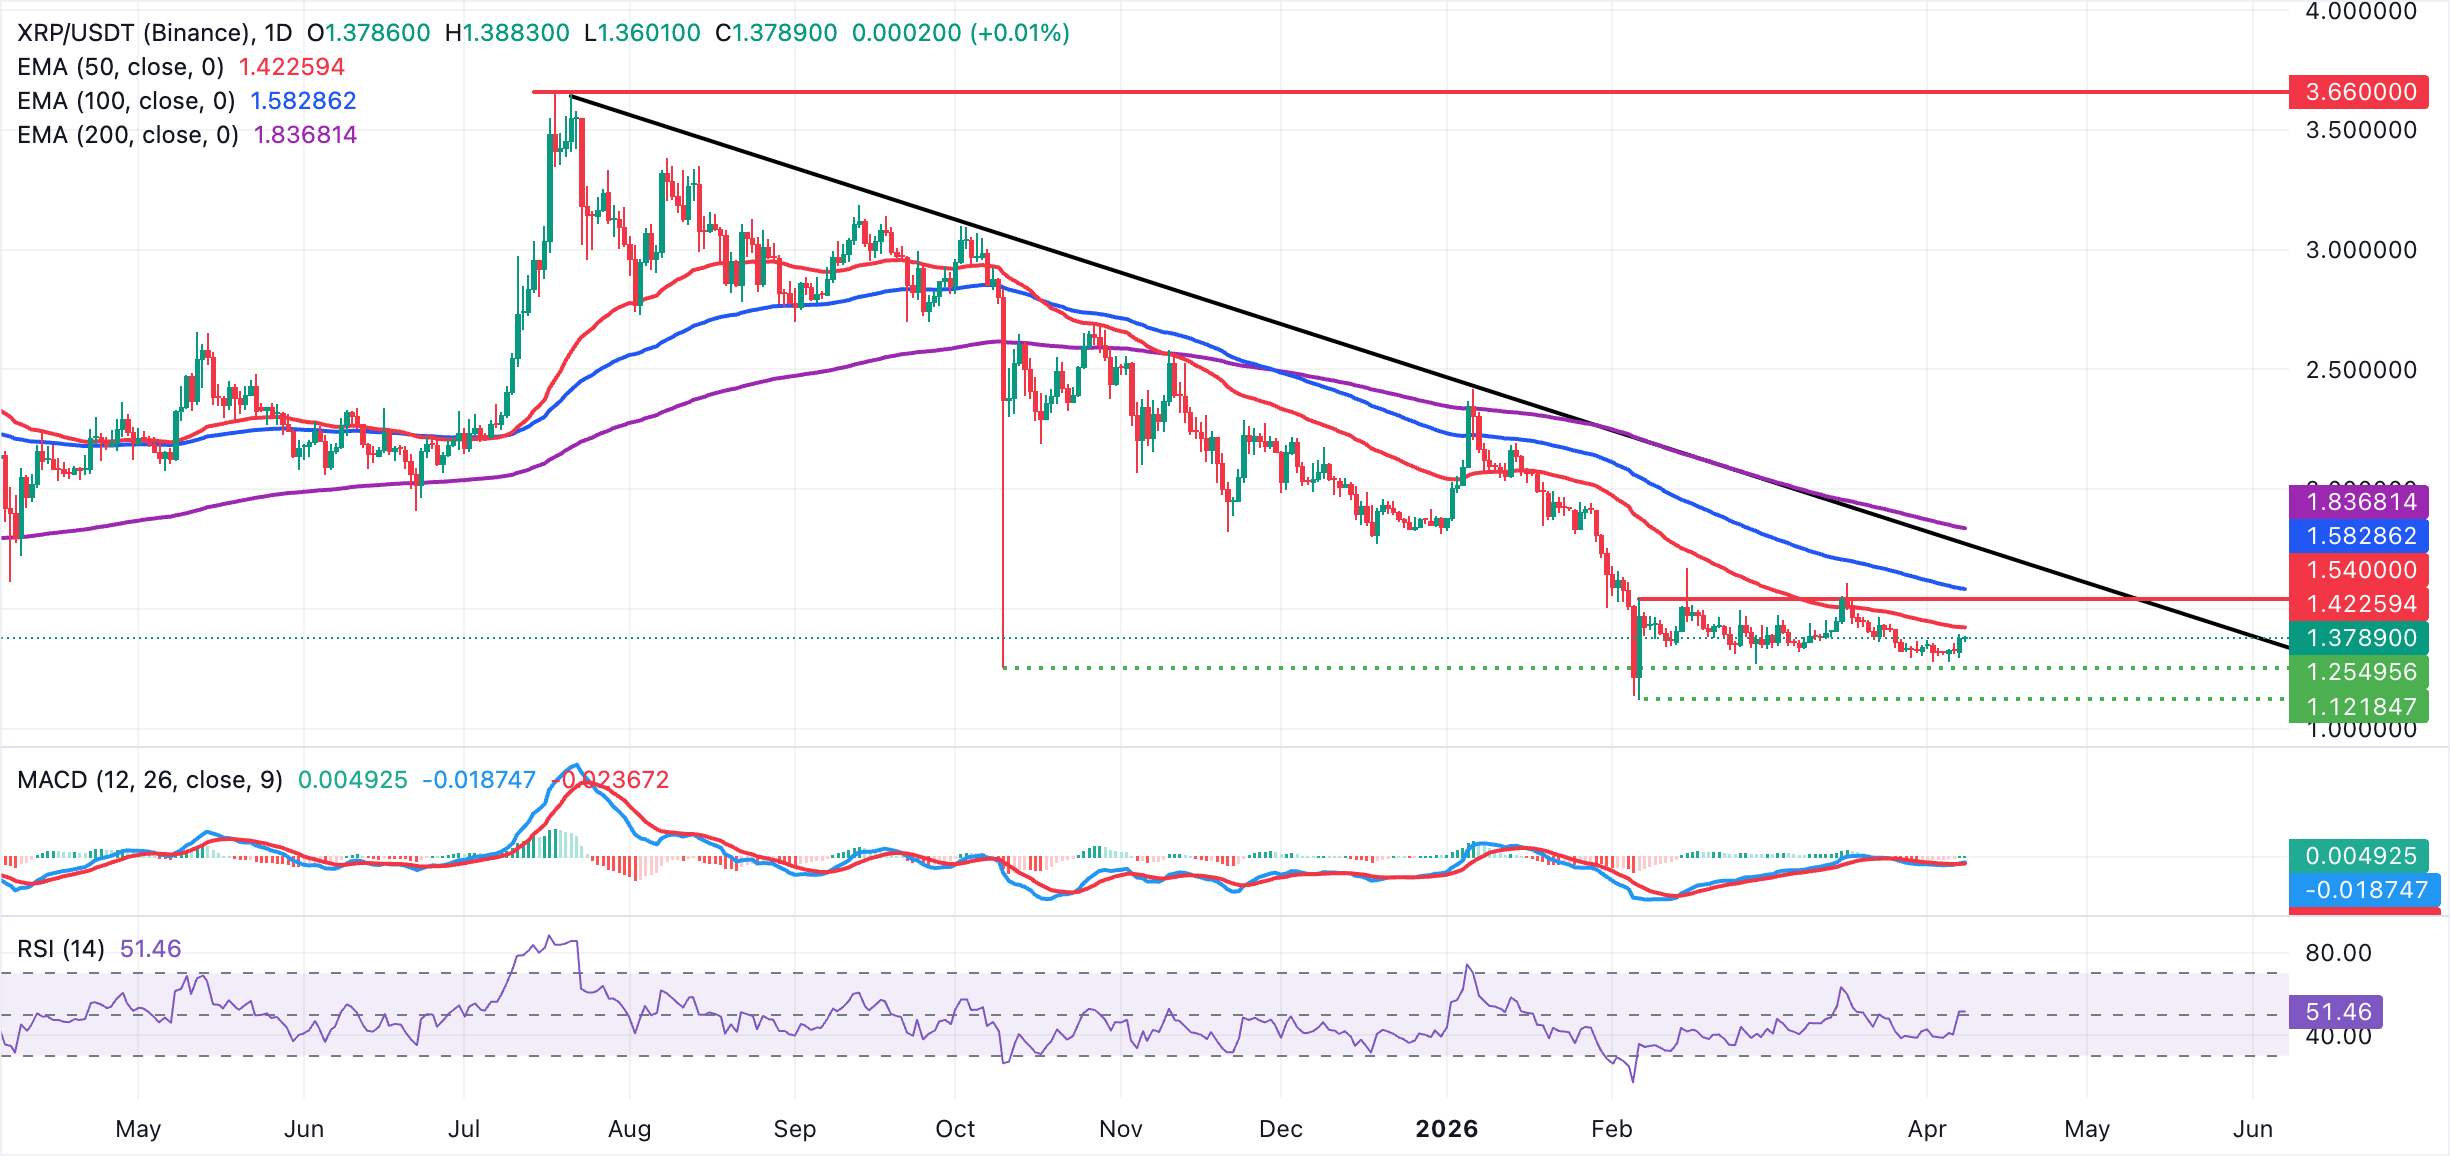
Initial resistance lies at the 50-day EMA around $1.42, where recent rebounds have stalled, followed by the late-March high near $1.45 and then the mid-March spike toward $1.54. A daily close above $1.54 would start to erode the prevailing bearish structure and expose the $1.60–$1.65 region ahead of the broken trendline area closer to $1.77.
On the downside, immediate support is seen at $1.32, guarding last week’s $1.30 congestion band, with further protection at $1.28. A break below the latter would reopen the $1.25 area, leaving XRP vulnerable to a deeper retracement.
Open Interest, funding rate FAQs
Higher Open Interest is associated with higher liquidity and new capital inflow to the market. This is considered the equivalent of increase in efficiency and the ongoing trend continues. When Open Interest decreases, it is considered a sign of liquidation in the market, investors are leaving and the overall demand for an asset is on a decline, fueling a bearish sentiment among investors.
Funding fees bridge the difference between spot prices and prices of futures contracts of an asset by increasing liquidation risks faced by traders. A consistently high and positive funding rate implies there is a bullish sentiment among market participants and there is an expectation of a price hike. A consistently negative funding rate for an asset implies a bearish sentiment, indicating that traders expect the cryptocurrency’s price to fall and a bearish trend reversal is likely to occur.
(The technical analysis of this story was written with the help of an AI tool.)

More than a million users rely on FXStreet for real-time market data, charting tools, expert insights, and forex news. Its comprehensive economic calendar and educational webinars help traders stay informed and make calculated decisions. FXStreet is supported by a team of about 60 professionals, split between the Barcelona headquarters and various global regions.
Read More


