
Gold slips below $4,800 as risk appetite drains safe-haven demand anew
By Christian Borjon Valencia
Updated: 15 Apr 2026


POPULAR ARTICLES

Gold price retreats during the session, down nearly 1%, as risk appetite improves and flows rotate toward US equities, pushing the S&P 500 index past the 7,000 figure, poised to test the all-time high at around 7.014.
- Gold tumbles on hopes for US-Iran progress as reduced demand weighs on the precious metal.
- Firmer Treasury yields and resilient equities added pressure on Gold prices.
- Traders still watch Hormuz risks and sticky inflation for fresh direction.
Gold price retreats during the session, down nearly 1%, as risk appetite improves and flows rotate toward US equities, pushing the S&P 500 index past the 7,000 figure, poised to test the all-time high at around 7.014. At the time of writing, XAU/USD trades below $4,800 after reaching a peak of $4,871.
Bullion eases as equity gains and firmer yields sap safe-haven demand
Speculation that talks between the US and Iran could end the conflict is growing after US President Donald Trump commented that the war was close to over, adding, “I think you’re going to be watching an amazing two days ahead,” to an ABC News reporter. Consequently, the safe-haven appeal of Gold, along with money returning to stocks, weighed on the yellow metal despite the overall weakness of the Greenback.
The US Dollar Index (DXY), which measures the performance of six currencies against the US Dollar, is down 0.06% to 98.05, slightly above the six-week low of 97.96. Meanwhile, the US 10-year Treasury note is up three basis points to 4.275%, underpinned by expectations of no interest rate cuts from the Federal Reserve (Fed) this year, a headwind for Bullion prices.
Despite the positive news, the US blockade of the Strait of Hormuz keeps tensions high. Reuters reported that Iran could consider allowing ships to sail through the Omani side of the Strait without interference or attack as part of a deal with the US.
Data-wise, Tuesday’s inflation report showed that the Producer Price Index (PPI) in March jumped to 4%, but remained shy of the expected 4.6%, largely due to a 15.7% increase in gasoline prices, according to the US Bureau of Labor Statistics (BLS).
The hot US PPI read is further cementing the case for no rate cuts by the Federal Reserve in 2026. Money markets are pricing in just eight basis points of easing toward the end of the year, according to Prime Market Terminal (PMT).
Federal Reserve interest rate probabilities
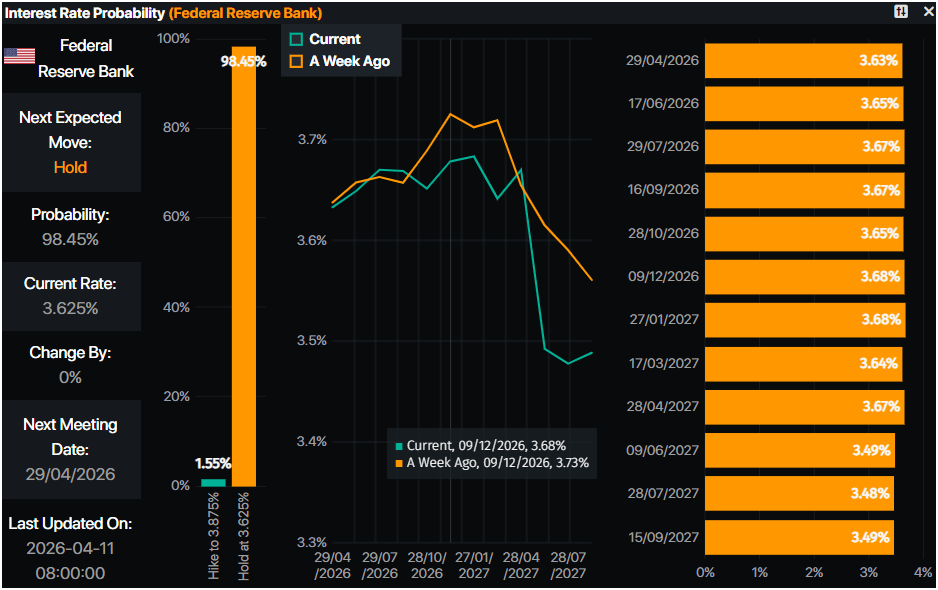
Lower interest rate environments benefit Gold prices. A de-escalation of the conflict could ease inflationary pressure. Still, US inflation remains stubbornly sticky at around 3%, and most Fed officials have said the current policy is “appropriate” amid the uncertain environment.
Beth Hammack of the Cleveland Fed said interest rates are expected to remain unchanged “for a good while.” She does not anticipate any immediate need for the Fed to adjust its current rate policy.
St. Louis Fed President Alberto Musalem said on Wednesday that high Oil prices are likely to keep underlying inflation nearly a percentage point above the Feds 2% target for 2026. He acknowledged that “It’s likely we’re going to see some pass-through of Oil prices onto core inflation.”
All in all, if the Fed keeps rates steady, XAU/USD could be poised for another leg-down. Eyes are on Initial Jobless Claims data on Thursday and additional speeches by Fed officials.
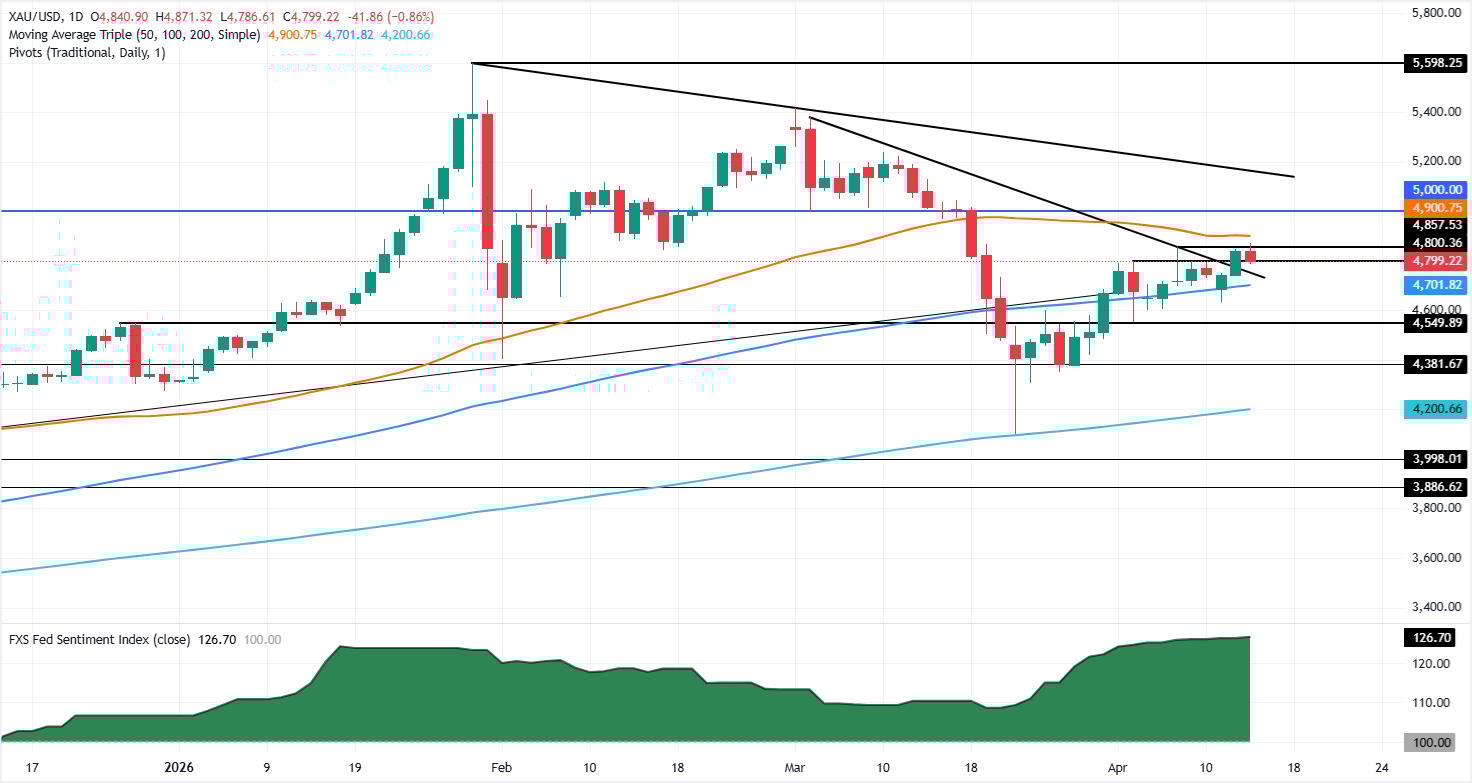
XAU/USD technical outlook: Gold retreats, struggles to remain above $4,800
Gold’s uptrend remains intact, but after reaching a high near $4,871 and failing to clear the next key resistance level at $4,899, the 50-day Simple Moving Average (SMA) drove prices lower.
Price action remains constructive after hitting a four-week high earlier in the session. However, if XAU/USD closes the day below $4,800, a fall toward the April 14 daily log at $4.742 is on the cards.
Momentum remains bullish, as indicated by the Relative Strength Index (RSI), though it is fragile given its proximity to the index-neutral level.
For a bullish continuation, a clear break above $4,850 is needed. Key resistance levels lie at the 50-day SMA at $4,899 and at $4,950, ahead of $5,000.
Conversely, the first key support is $4,750 ahead of the April 14 daily low before testing $4,700. A breach of the latter exposes the confluence of the 100-day and 20-day SMAs near $4,684 and $4,640.
Gold FAQs
Gold has played a key role in human’s history as it has been widely used as a store of value and medium of exchange. Currently, apart from its shine and usage for jewelry, the precious metal is widely seen as a safe-haven asset, meaning that it is considered a good investment during turbulent times. Gold is also widely seen as a hedge against inflation and against depreciating currencies as it doesn’t rely on any specific issuer or government.
Central banks are the biggest Gold holders. In their aim to support their currencies in turbulent times, central banks tend to diversify their reserves and buy Gold to improve the perceived strength of the economy and the currency. High Gold reserves can be a source of trust for a country’s solvency. Central banks added 1,136 tonnes of Gold worth around $70 billion to their reserves in 2022, according to data from the World Gold Council. This is the highest yearly purchase since records began. Central banks from emerging economies such as China, India and Turkey are quickly increasing their Gold reserves.
Gold has an inverse correlation with the US Dollar and US Treasuries, which are both major reserve and safe-haven assets. When the Dollar depreciates, Gold tends to rise, enabling investors and central banks to diversify their assets in turbulent times. Gold is also inversely correlated with risk assets. A rally in the stock market tends to weaken Gold price, while sell-offs in riskier markets tend to favor the precious metal.
The price can move due to a wide range of factors. Geopolitical instability or fears of a deep recession can quickly make Gold price escalate due to its safe-haven status. As a yield-less asset, Gold tends to rise with lower interest rates, while higher cost of money usually weighs down on the yellow metal. Still, most moves depend on how the US Dollar (USD) behaves as the asset is priced in dollars (XAU/USD). A strong Dollar tends to keep the price of Gold controlled, whereas a weaker Dollar is likely to push Gold prices up.

More than a million users rely on FXStreet for real-time market data, charting tools, expert insights, and forex news. Its comprehensive economic calendar and educational webinars help traders stay informed and make calculated decisions. FXStreet is supported by a team of about 60 professionals, split between the Barcelona headquarters and various global regions.
Read More


