
Hyperliquid Price Forecast: HYPE holds weekly gains, defying crypto market bloodbath
By Vishal Dixit
Date Published: 6 Feb 2026 | Date Modified: 6 Feb 2026


POPULAR ARTICLES

Hyperliquid recovers nearly 3% at press time on Friday, holding above $35.00 and becoming the 10th-largest cryptocurrency by market capitalization with a $8.97 billion valuation. HYPE's price action has been defying the broad bearish market, partly due to announcements such as the Coinbase spot mar
- Hyperliquid recovers nearly 3% so far on Friday, bouncing off the 200-day EMA support.
- Coinbase lists HYPE on its spot market, boosting trading volume and supporting the recovery.
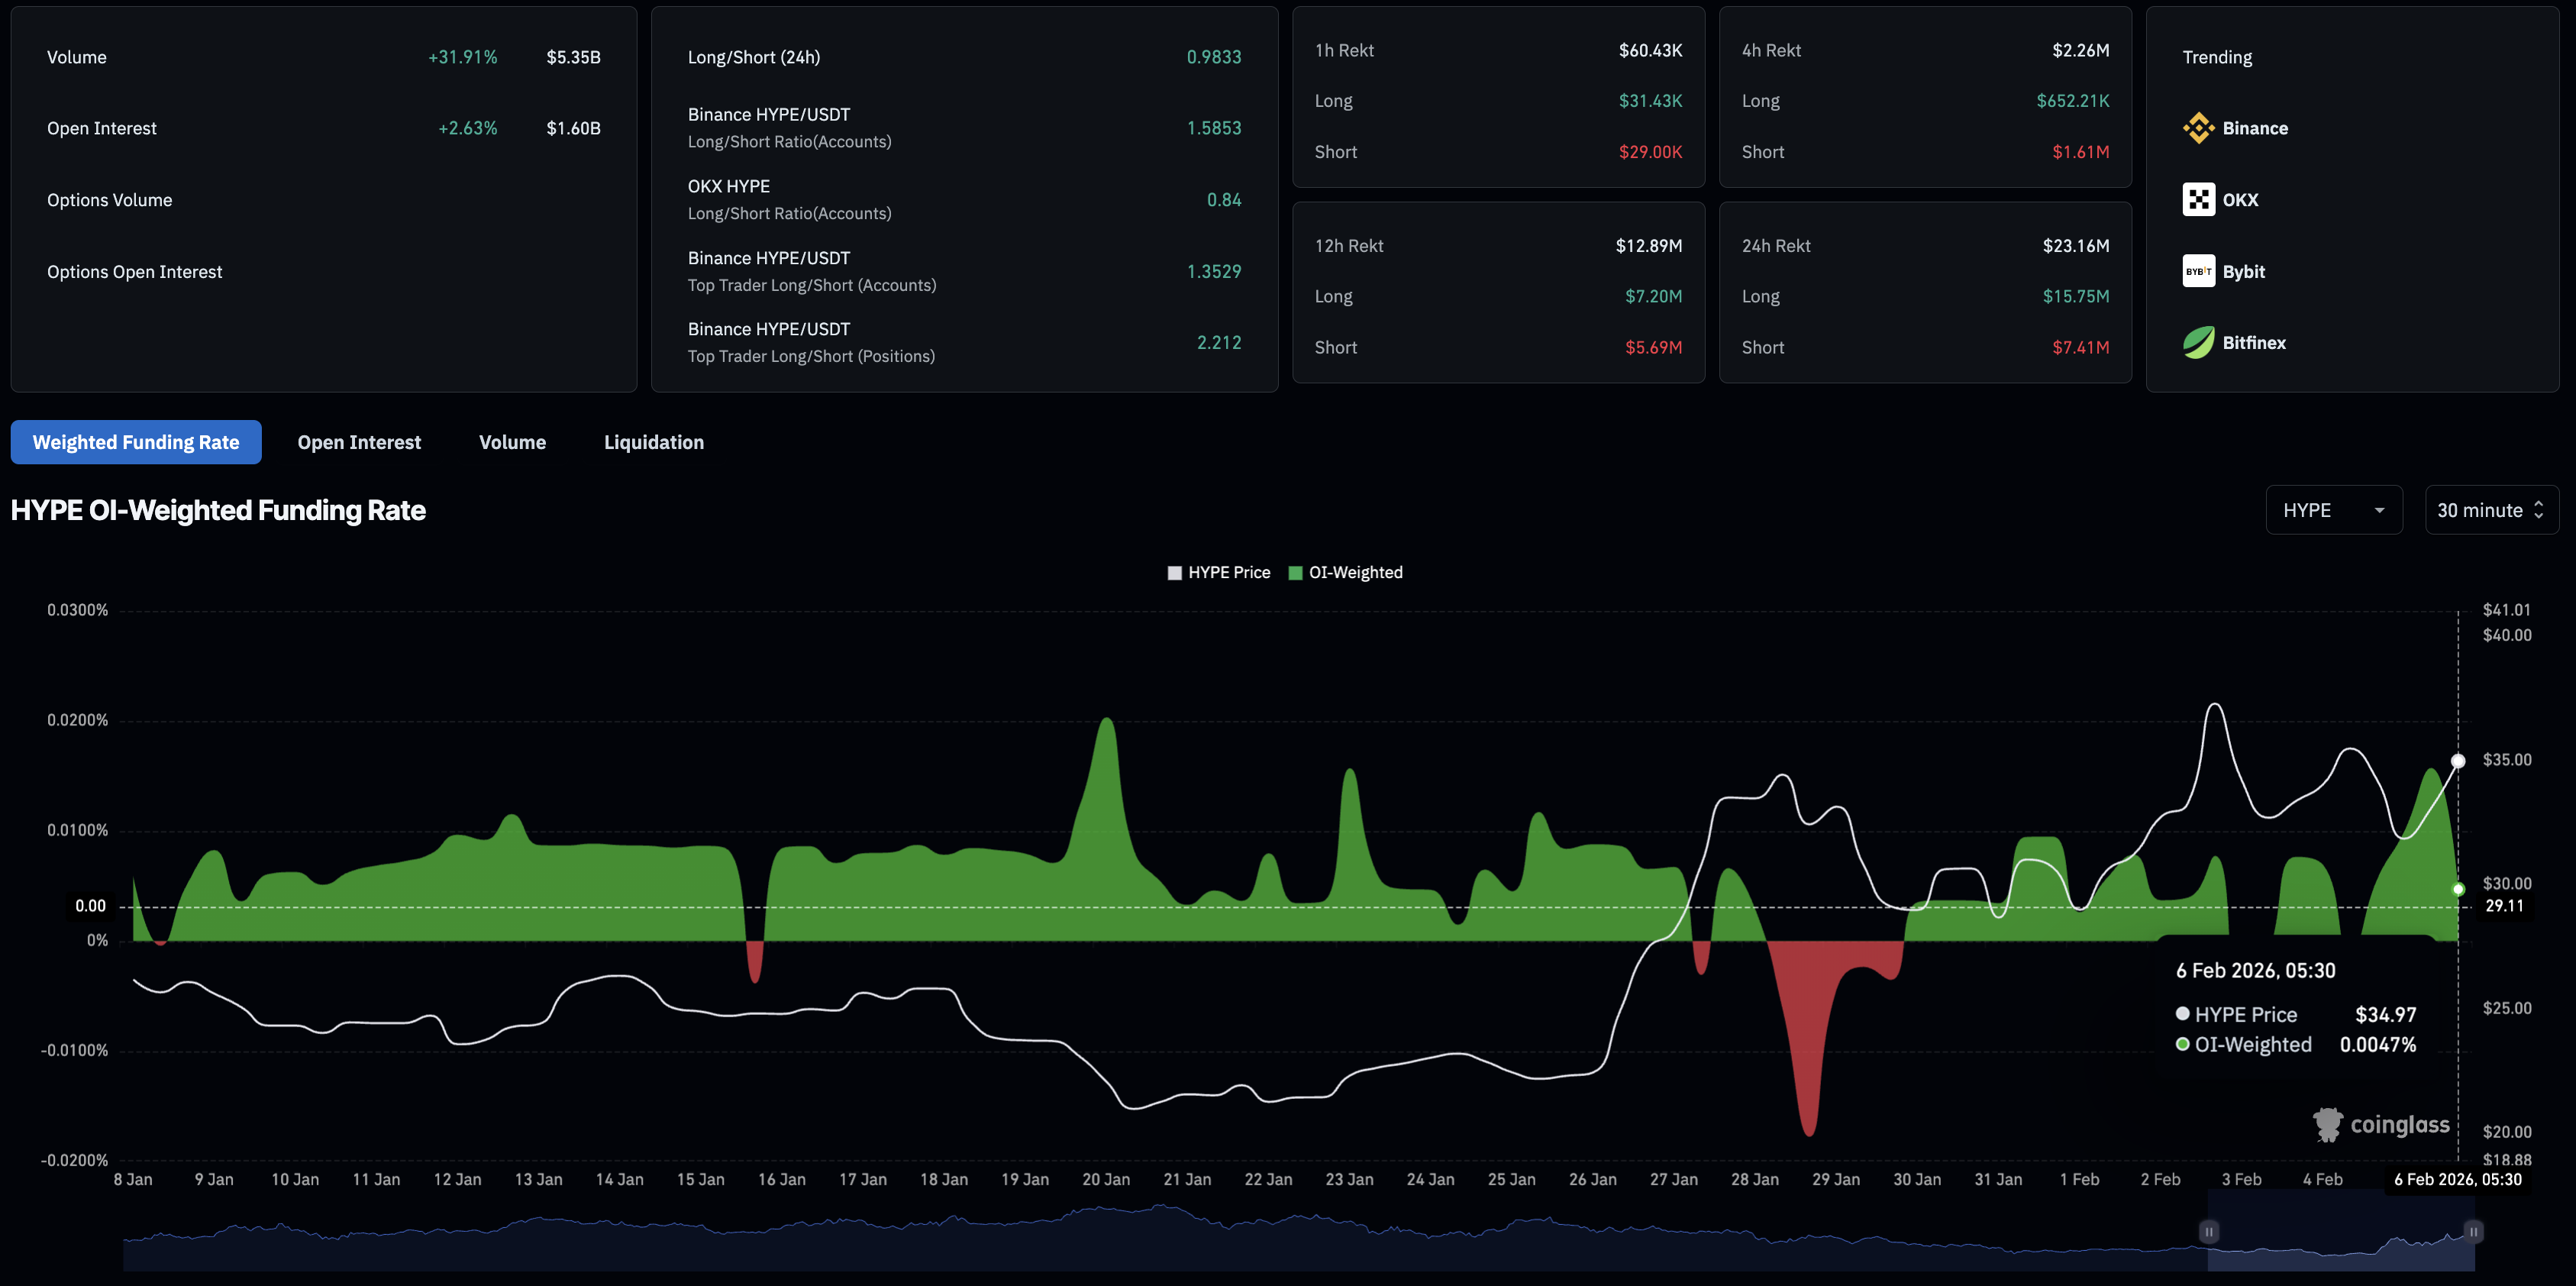
- Derivatives data indicate that investor confidence remains steady, with HYPE Open Interest rising to $1.60 billion.
Hyperliquid recovers nearly 3% at press time on Friday, holding above $35.00 and becoming the 10th-largest cryptocurrency by market capitalization with a $8.97 billion valuation. HYPE's price action has been defying the broad bearish market, partly due to announcements such as the Coinbase spot market listing and the HIP-4 proposal, which would expand the platform into the prediction market space. Retail demand for HYPE remains steady, with Open Interest up to $1.60 billion, and positive funding rates.
Coinbase listing supports HYPE recovery
Coinbase announced on Thursday the listing of Hyperliquid’s HYPE token, funneling further trading volume to one of the few altcoins sustaining gains in the current bear market. Santiment data show that HYPE trading volume reached $1.28 billion so far on Friday, surpassing the $1.18 peak from Tuesday.
 [10-1770358035224-1770358035225.49.40, 06 Feb, 2026].png)
Retail demand points toward further upside
CoinGlass data show steady demand for HYPE, with its futures Open Interest (OI) up over 2% in the last 24 hours to $1.60 billion. These capital inflows defy the broader market liquidation wave.
Still, the OI-weighted funding rate at 0.0047% on Friday is down from the 0.0157% peak the previous day, suggesting a decline in bullish interest.
Technical outlook: Will HYPE reach $50?
Hyperliquid struggles to clear the $35.51 resistance level, which previously capped gains in early December after bouncing off the 200-day Exponential Moving Average (EMA) at $32.89. The upward slope in the 50-day EMA rising towards the 200-day EMA reaffirms the bullish shift.
The Relative Strength Index (RSI) at 62 on the daily chart suggests sustained buying pressure with still room to advance before reaching overbought levels. The Moving Average Convergence Divergence (MACD) on the same timeframe shows both average lines advancing higher as the histogram above zero widens, confirming rising bullish momentum.
Looking up, a daily close above $35.51 would open the door toward the supply zone present near the $50 psychological mark.
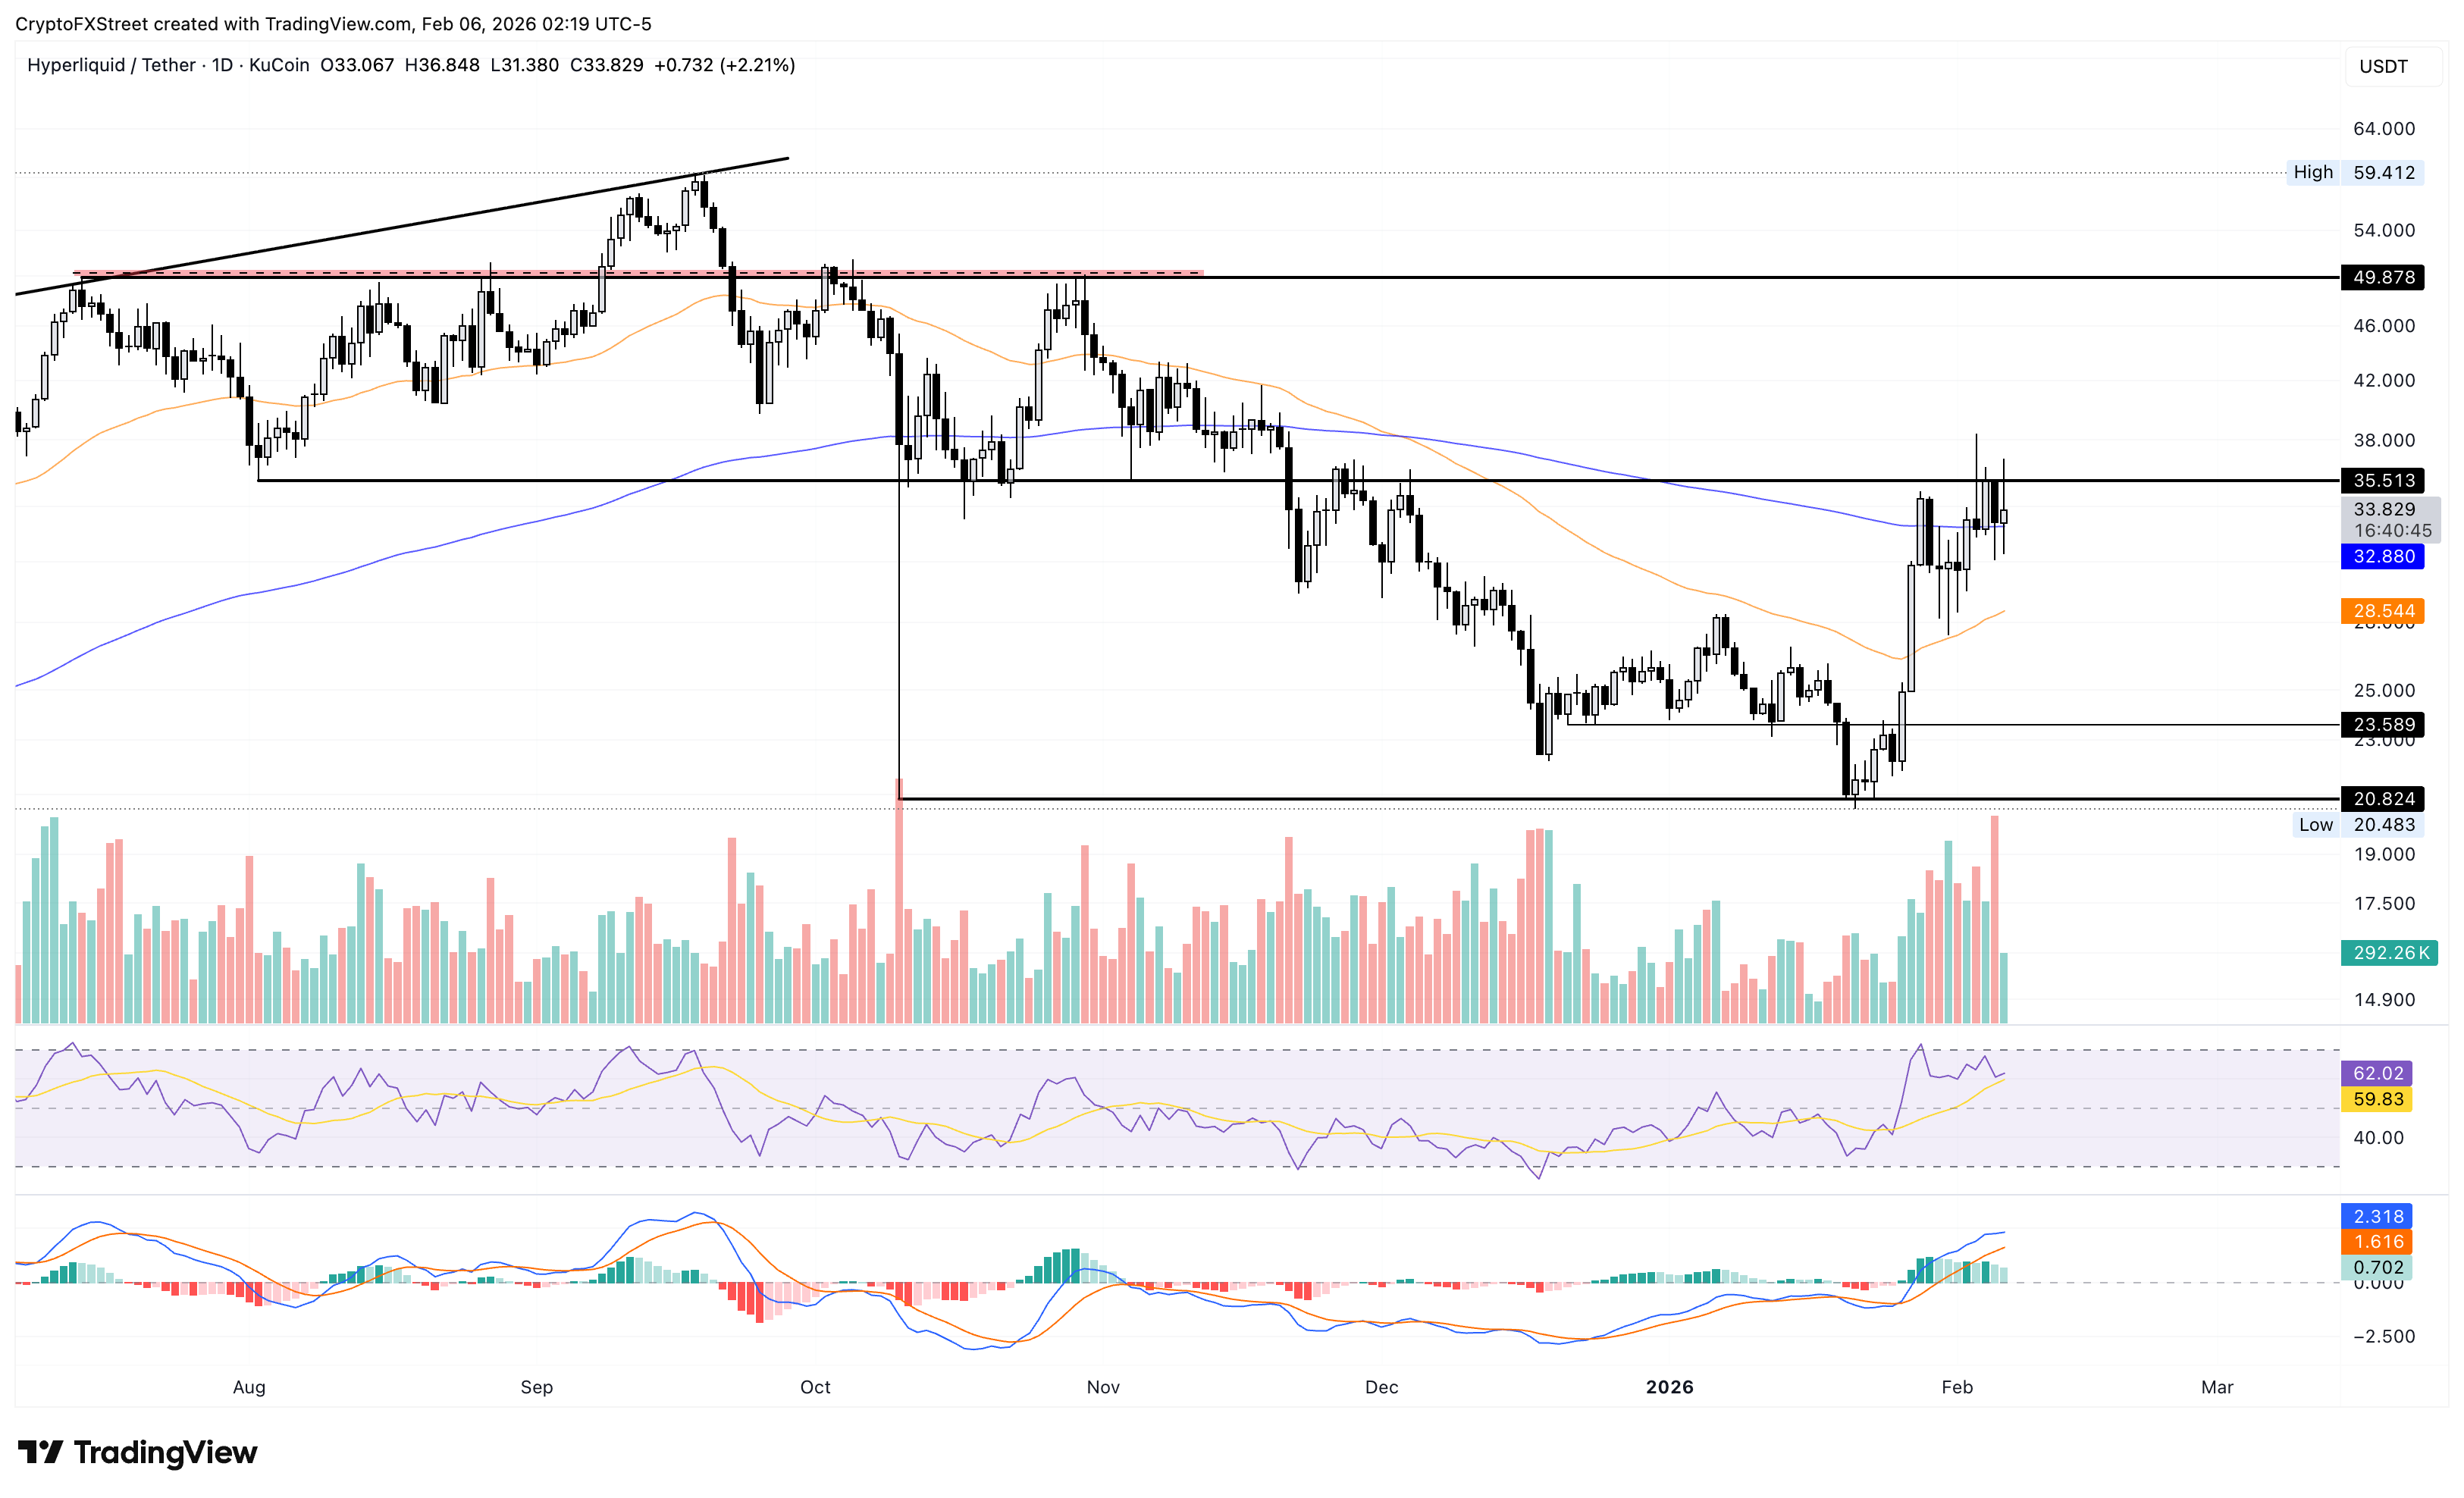
However, a daily close below the 200-day EMA would risk a decline to the 50-day EMA at $28.60.

More than a million users rely on FXStreet for real-time market data, charting tools, expert insights, and forex news. Its comprehensive economic calendar and educational webinars help traders stay informed and make calculated decisions. FXStreet is supported by a team of about 60 professionals, split between the Barcelona headquarters and various global regions.
Read More


