
Ripple Price Forecast: XRP trades muted, pressured by softening ETF demand and weak retail interest
By John Isige
Updated: 24 Apr 2026


POPULAR ARTICLES

Ripple (XRP) exhibits technical weakness, trading around $1.43 at the time of writing on Friday. Prices across the crypto market appear pressured amid buyer exhaustion following the early-week gains driven by the extension of the US-Iran ceasefire on Tuesday.
- XRP hovers around the day’s open at $1.43 as overhead pressure grows within a broader downtrend.
- Soft inflows into XRP spot ETFs and cooling retail demand could limit the token's recovery potential.
- The downward-sloping 100-day and 200-day EMAs define XRP’s weak technical structure.
Ripple (XRP) exhibits technical weakness, trading around $1.43 at the time of writing on Friday. Prices across the crypto market appear pressured amid buyer exhaustion following the early-week gains driven by the extension of the US-Iran ceasefire on Tuesday.
The remittance token’s rebound stalled at the weekly high of $1.46, coinciding with emerging risk-off sentiment in the derivatives market and softening interest in related investment products. Meanwhile, demand around $1.40 could offer fresh entry opportunities for investors and help prevent an extended correction.
XRP trades sideways as retail and institutional activity cools
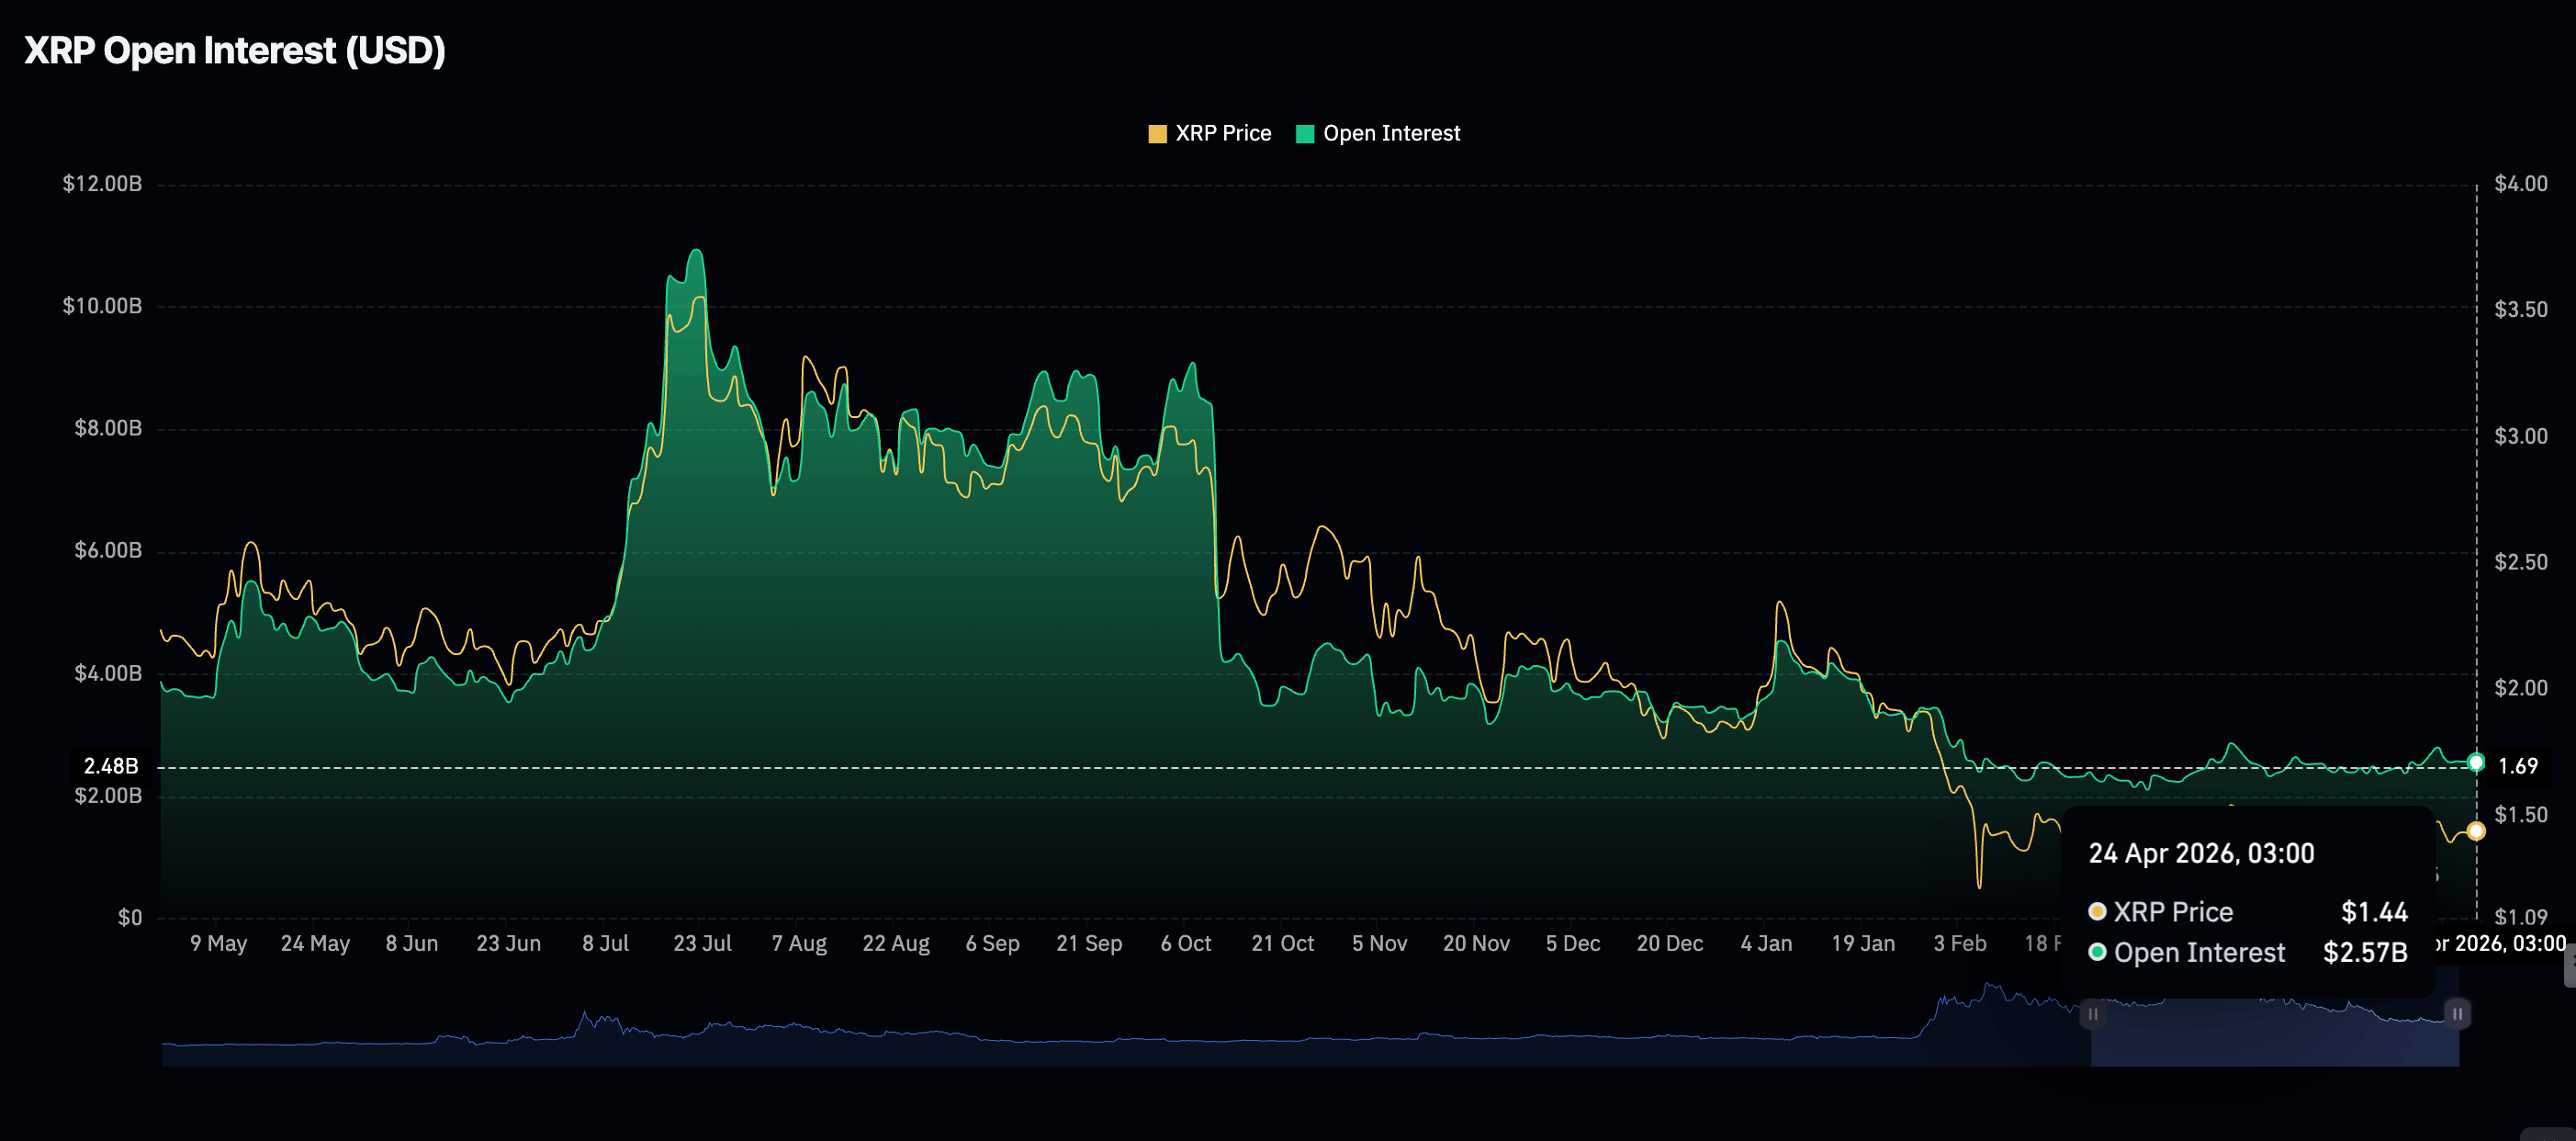
Retail demand for XRP derivatives remains on the back foot, with the perpetual OI averaging $2.57 billion on Friday. The OI has remained relatively steady at this level since Monday, after fading from $2.80 billion, its monthly peak. On that account, sustaining recovery in XRP could be an uphill battle, leaving the remittance token largely susceptible to sell-side pressure.
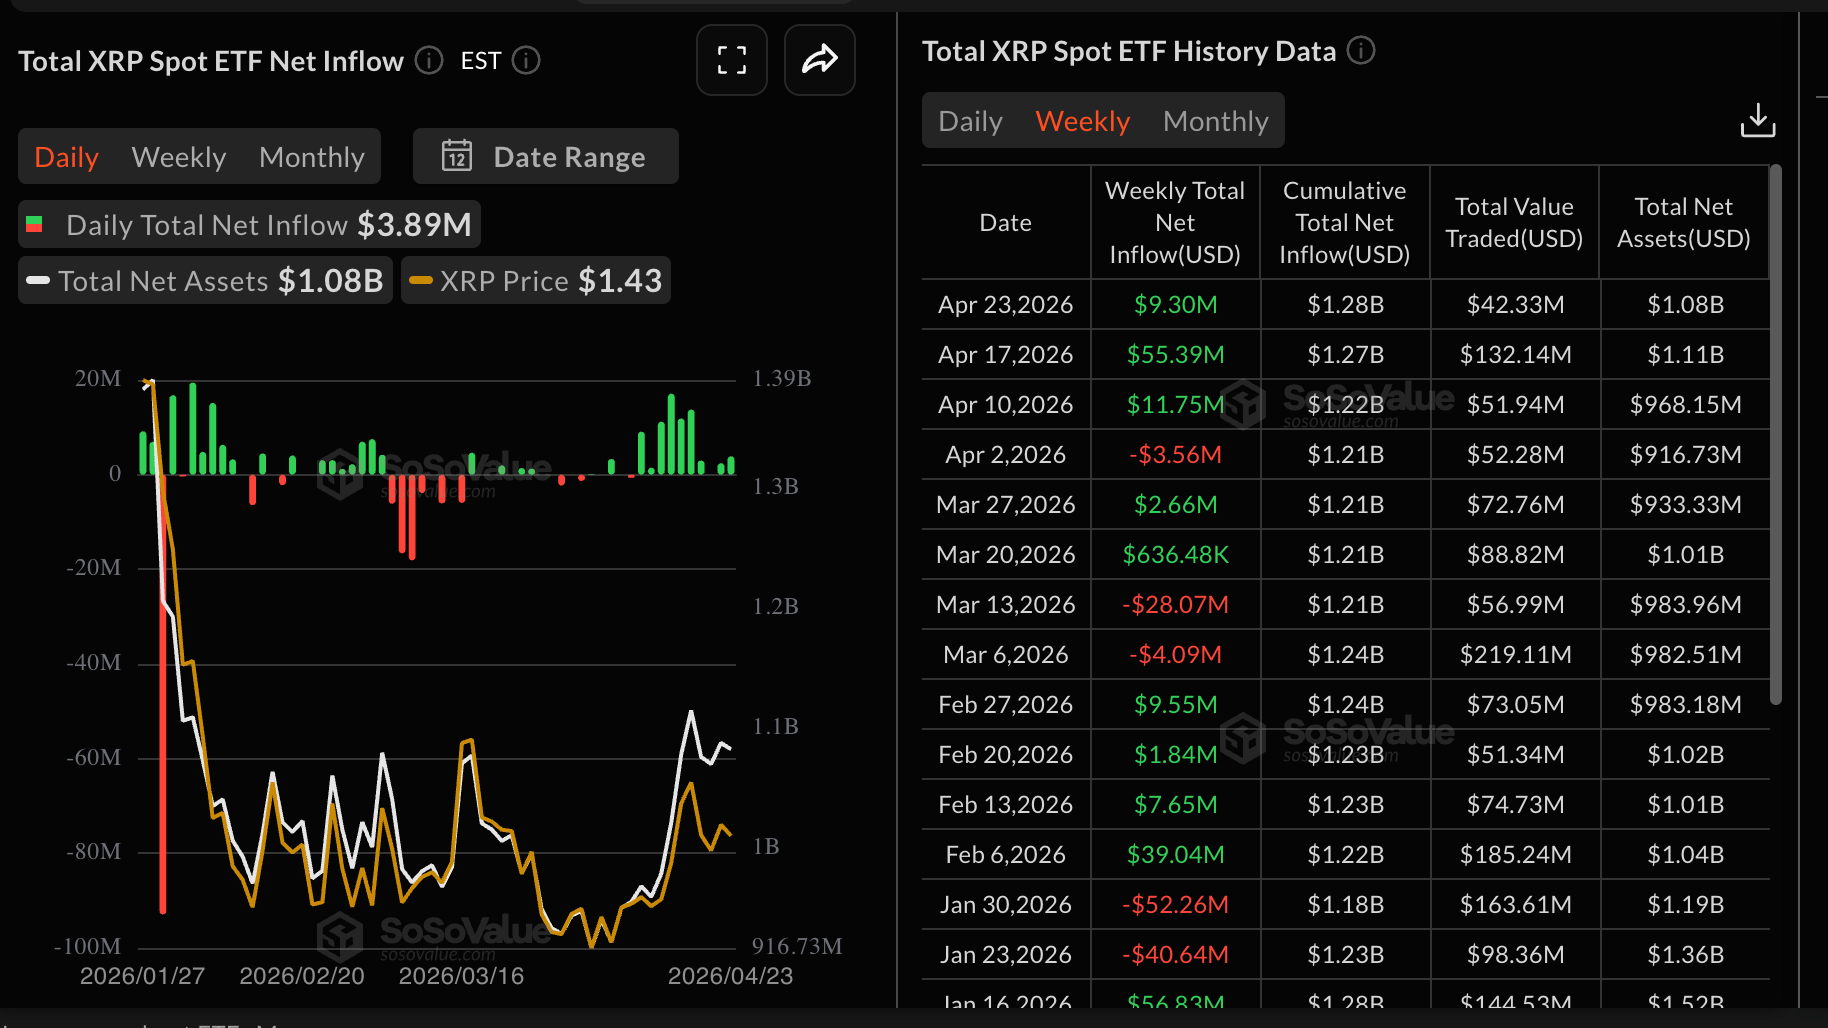
At the same time, interest in XRP spot Exchange-Traded Funds (ETFs) slowed this week, with roughly $9.30 million in inflows recorded through Thursday, compared with $55.39 million the previous week.
Meanwhile, inflows totaled $3.89 million on Thursday, rising from $2.42 million the previous day. Cumulative inflows average $1.28 billion and total net assets $1.08 billion, according to SoSoValue data. Steady institutional demand is required to help shape sentiment and sustain XRP’s recovery.
Technical outlook: XRP upside limited as key support holds
XRP trades at $1.43, upholding a mildly constructive tone as it trades above the 50-day EMA at $1.41 and the Bollinger Bands’ 20-day Simple Moving Average near $1.39, indicating underlying demand on dips. Still, the broader trend remains capped while price stays below the 100-day Exponential Moving Average (EMA) at $1.53 and the 200-day EMA at $1.78.
Momentum signals are supportive with the Moving Average Convergence Divergence (MACD) histogram holding in positive territory on the daily chart and the Relative Strength Index (RSI) near 56. Notably, the elevated Money Flow Index (MFI) around 74 suggests strong buying pressure but is edging toward overbought territory.
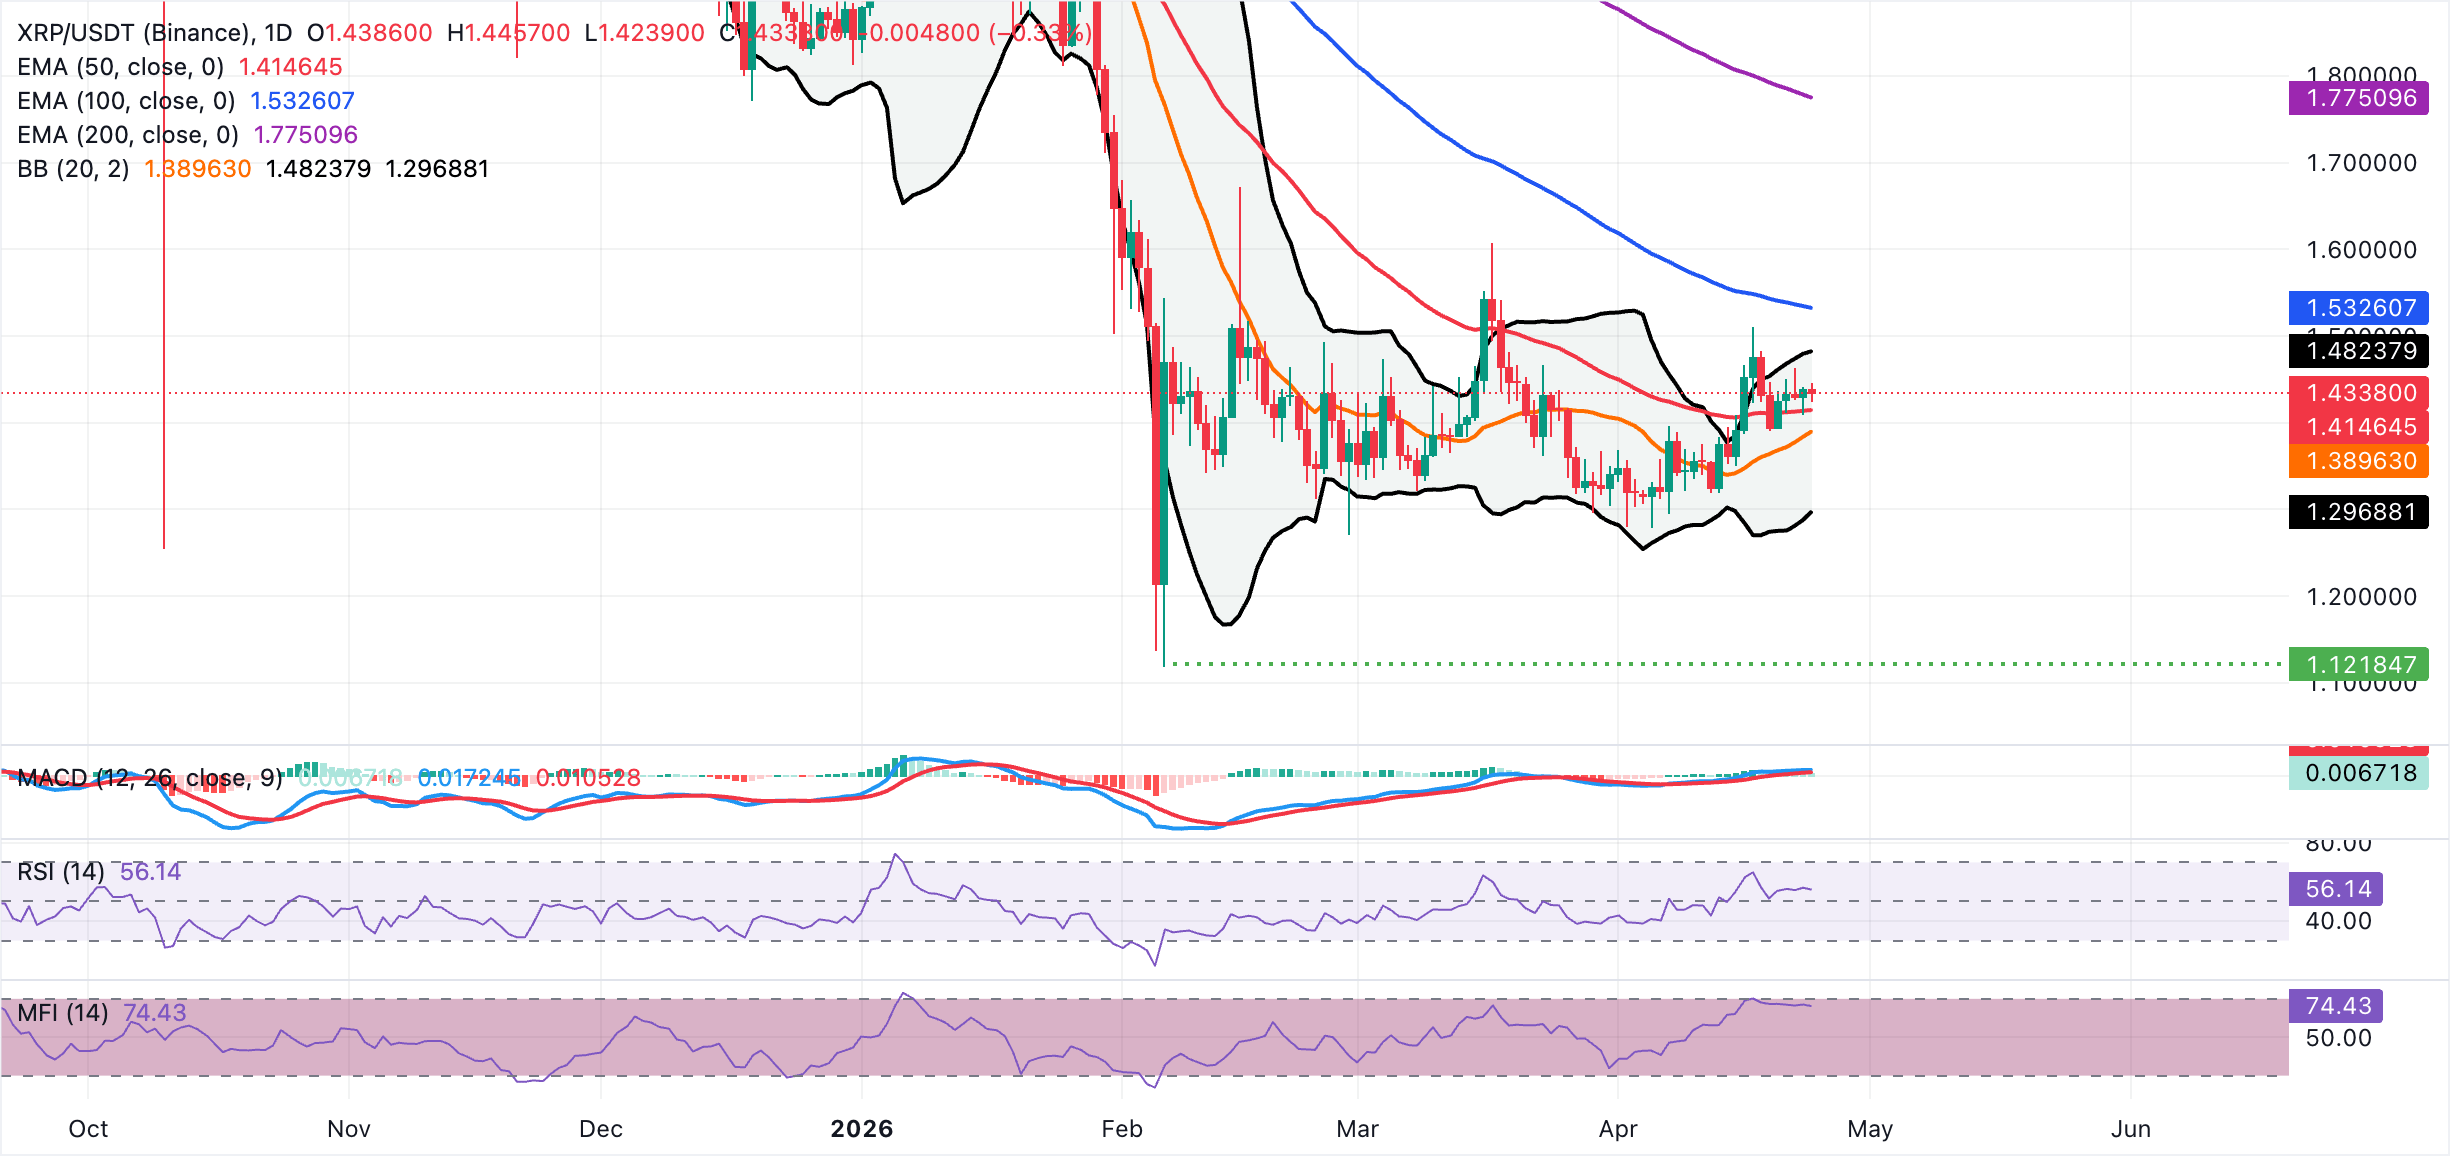
On the topside, initial resistance is aligned with the Bollinger upper band at $1.48, ahead of a more significant barrier at the 100-day EMA at $1.53. A daily close above these levels would be needed to open the way toward the 200-day EMA at $1.78. On the downside, immediate support lies at the 50-day EMA at $1.41, followed by the Bollinger midline around $1.39. A break below this zone would expose the lower band at $1.30 and undermine the current constructive consolidation phase.
(The technical analysis of this story was written with the help of an AI tool.)
Cryptocurrency metrics FAQs
The developer or creator of each cryptocurrency decides on the total number of tokens that can be minted or issued. Only a certain number of these assets can be minted by mining, staking or other mechanisms. This is defined by the algorithm of the underlying blockchain technology. On the other hand, circulating supply can also be decreased via actions such as burning tokens, or mistakenly sending assets to addresses of other incompatible blockchains.
Market capitalization is the result of multiplying the circulating supply of a certain asset by the asset’s current market value.
Trading volume refers to the total number of tokens for a specific asset that has been transacted or exchanged between buyers and sellers within set trading hours, for example, 24 hours. It is used to gauge market sentiment, this metric combines all volumes on centralized exchanges and decentralized exchanges. Increasing trading volume often denotes the demand for a certain asset as more people are buying and selling the cryptocurrency.
Funding rates are a concept designed to encourage traders to take positions and ensure perpetual contract prices match spot markets. It defines a mechanism by exchanges to ensure that future prices and index prices periodic payments regularly converge. When the funding rate is positive, the price of the perpetual contract is higher than the mark price. This means traders who are bullish and have opened long positions pay traders who are in short positions. On the other hand, a negative funding rate means perpetual prices are below the mark price, and hence traders with short positions pay traders who have opened long positions.

More than a million users rely on FXStreet for real-time market data, charting tools, expert insights, and forex news. Its comprehensive economic calendar and educational webinars help traders stay informed and make calculated decisions. FXStreet is supported by a team of about 60 professionals, split between the Barcelona headquarters and various global regions.
Read More


