
Zilliqa Price Forecast: Overheating and sell-side dominance put ZIL at risks
By Manish Chhetri
Updated: 26 Mar 2026


POPULAR ARTICLES

Zilliqa (ZIL) price slips below $0.0040 at the time of writing on Thursday, indicating a slight weakness in price action. On-chain and derivatives metrics point to a negative outlook for ZIL, while strengthening bearish momentum suggests a deeper correction in the coming days.
- Zilliqa’s price trades in the red on Thursday, reflecting weakness in price action.
- On-chain and derivatives data support bearish sentiment with overheating conditions, sell-side dominance and negative funding rates.
- Momentum indicators show bearish strength gaining traction, hinting at a deeper correction ahead.
Zilliqa (ZIL) price slips below $0.0040 at the time of writing on Thursday, indicating a slight weakness in price action. On-chain and derivatives metrics point to a negative outlook for ZIL, while strengthening bearish momentum suggests a deeper correction in the coming days.
On-chain and derivatives data support a bearish bias
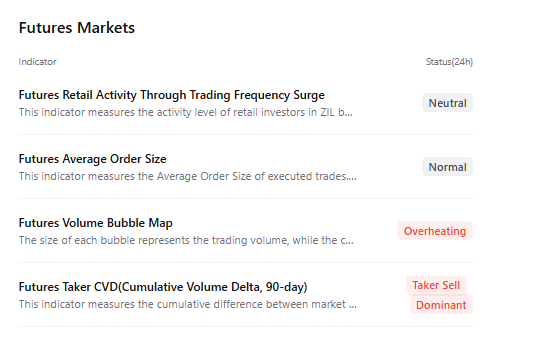
CryptoQuant summary data shows a bearish outlook for Zilliqa. The chart below shows overheating conditions and sell-side dominance in the futures market, signaling a potential correction ahead.
Santiment’s Social Dominance metric for ZIL also supports a bearish outlook. The index measures the share of ZIL-related discussions across the cryptocurrency media. It has been in a downtrend since mid-March, reading 0.003% on Thursday. This fall indicates fading market interest and sentiment among ZIL investors.
 [07-1774495618066-1774495618068.58.08, 26 Mar, 2026].png)
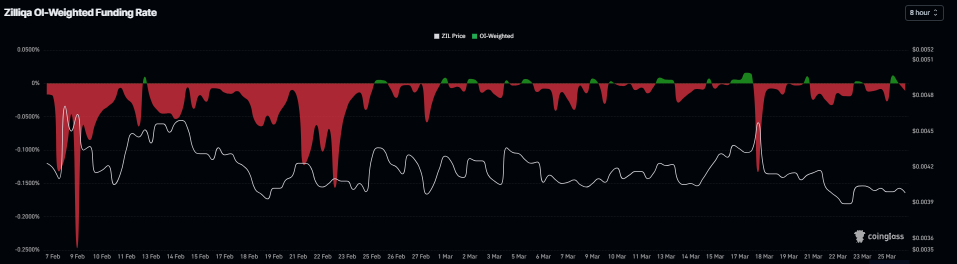
On the derivatives side, negative funding rates signal negative sentiment among traders. The metric flipped to a negative rate on Thursday, reading -0.014%, indicating shorts are paying longs and suggesting bearish sentiment toward ZIL.
Zilliqa Price Forecast: Bears are in control of momentum
Zilliqa price trades below $0.0040 as of writing on Thursday. The near-term bias remains mildly bearish as price holds below the descending trendline, last broken near $0.0046, and continues to trade beneath the 50-day and 100-day Exponential Moving Averages (EMAs), which cap the upside at $0.0043 and $0.0048, respectively.
The Relative Strength Index (RSI) on the daily chart sits in the low-40s, reflecting weak momentum and reinforcing the downside bias, while the Moving Average Convergence Divergence (MACD) indicator hovers around the zero line, suggesting limited directional conviction and a preference for selling into minor bounces.
Immediate resistance emerges at the nearby horizontal barrier around $0.0040, with the 50-day EMA near $0.0043 as the next hurdle, and the prior trendline break area around $0.0046 acting as a stronger cap if buyers attempt a recovery.
On the downside, initial support sits at $0.0038, where previous lows converge with a horizontal line; a break below this floor would expose deeper losses toward the $0.0035 area, keeping the bearish bias intact while price trades below the $0.0043–$0.0046 resistance band.
-1774495679762-1774495679763.png)
(The technical analysis of this story was written with the help of an AI tool.)

More than a million users rely on FXStreet for real-time market data, charting tools, expert insights, and forex news. Its comprehensive economic calendar and educational webinars help traders stay informed and make calculated decisions. FXStreet is supported by a team of about 60 professionals, split between the Barcelona headquarters and various global regions.
Read More


