


- Bitcoin Cash gains 4% on Friday as the broader market overlooks the Bank of Japan’s rate hike.
- Derivatives data indicates a surge in retail interest, with BCH futures Open Interest hitting a six-month high.
- The technical outlook for BCH is bullish, with focus on the $600 breakout.
Bitcoin Cash (BCH) edges higher by 4% at press time on Friday, extending the 3.51% gains from Thursday on the back of reduced inflation in the US economy. Derivatives data suggests intense retail interest as BCH Open Interest hits a 6-month high. The technical outlook for Bitcoin Cash centers on the $600 breakout, with bulls aiming for $625.
Retail demand adds fuel to the BCH rally
Bitcoin Cash rallies on the November US CPI data, which came in at 2.7% on Wednesday, and it continues to ignore the Bank of Japan’s quarter-point rate hike to 0.75%, a 30-year high. The retail sentiment surrounding BCH strengthens as it approaches a breakout level.
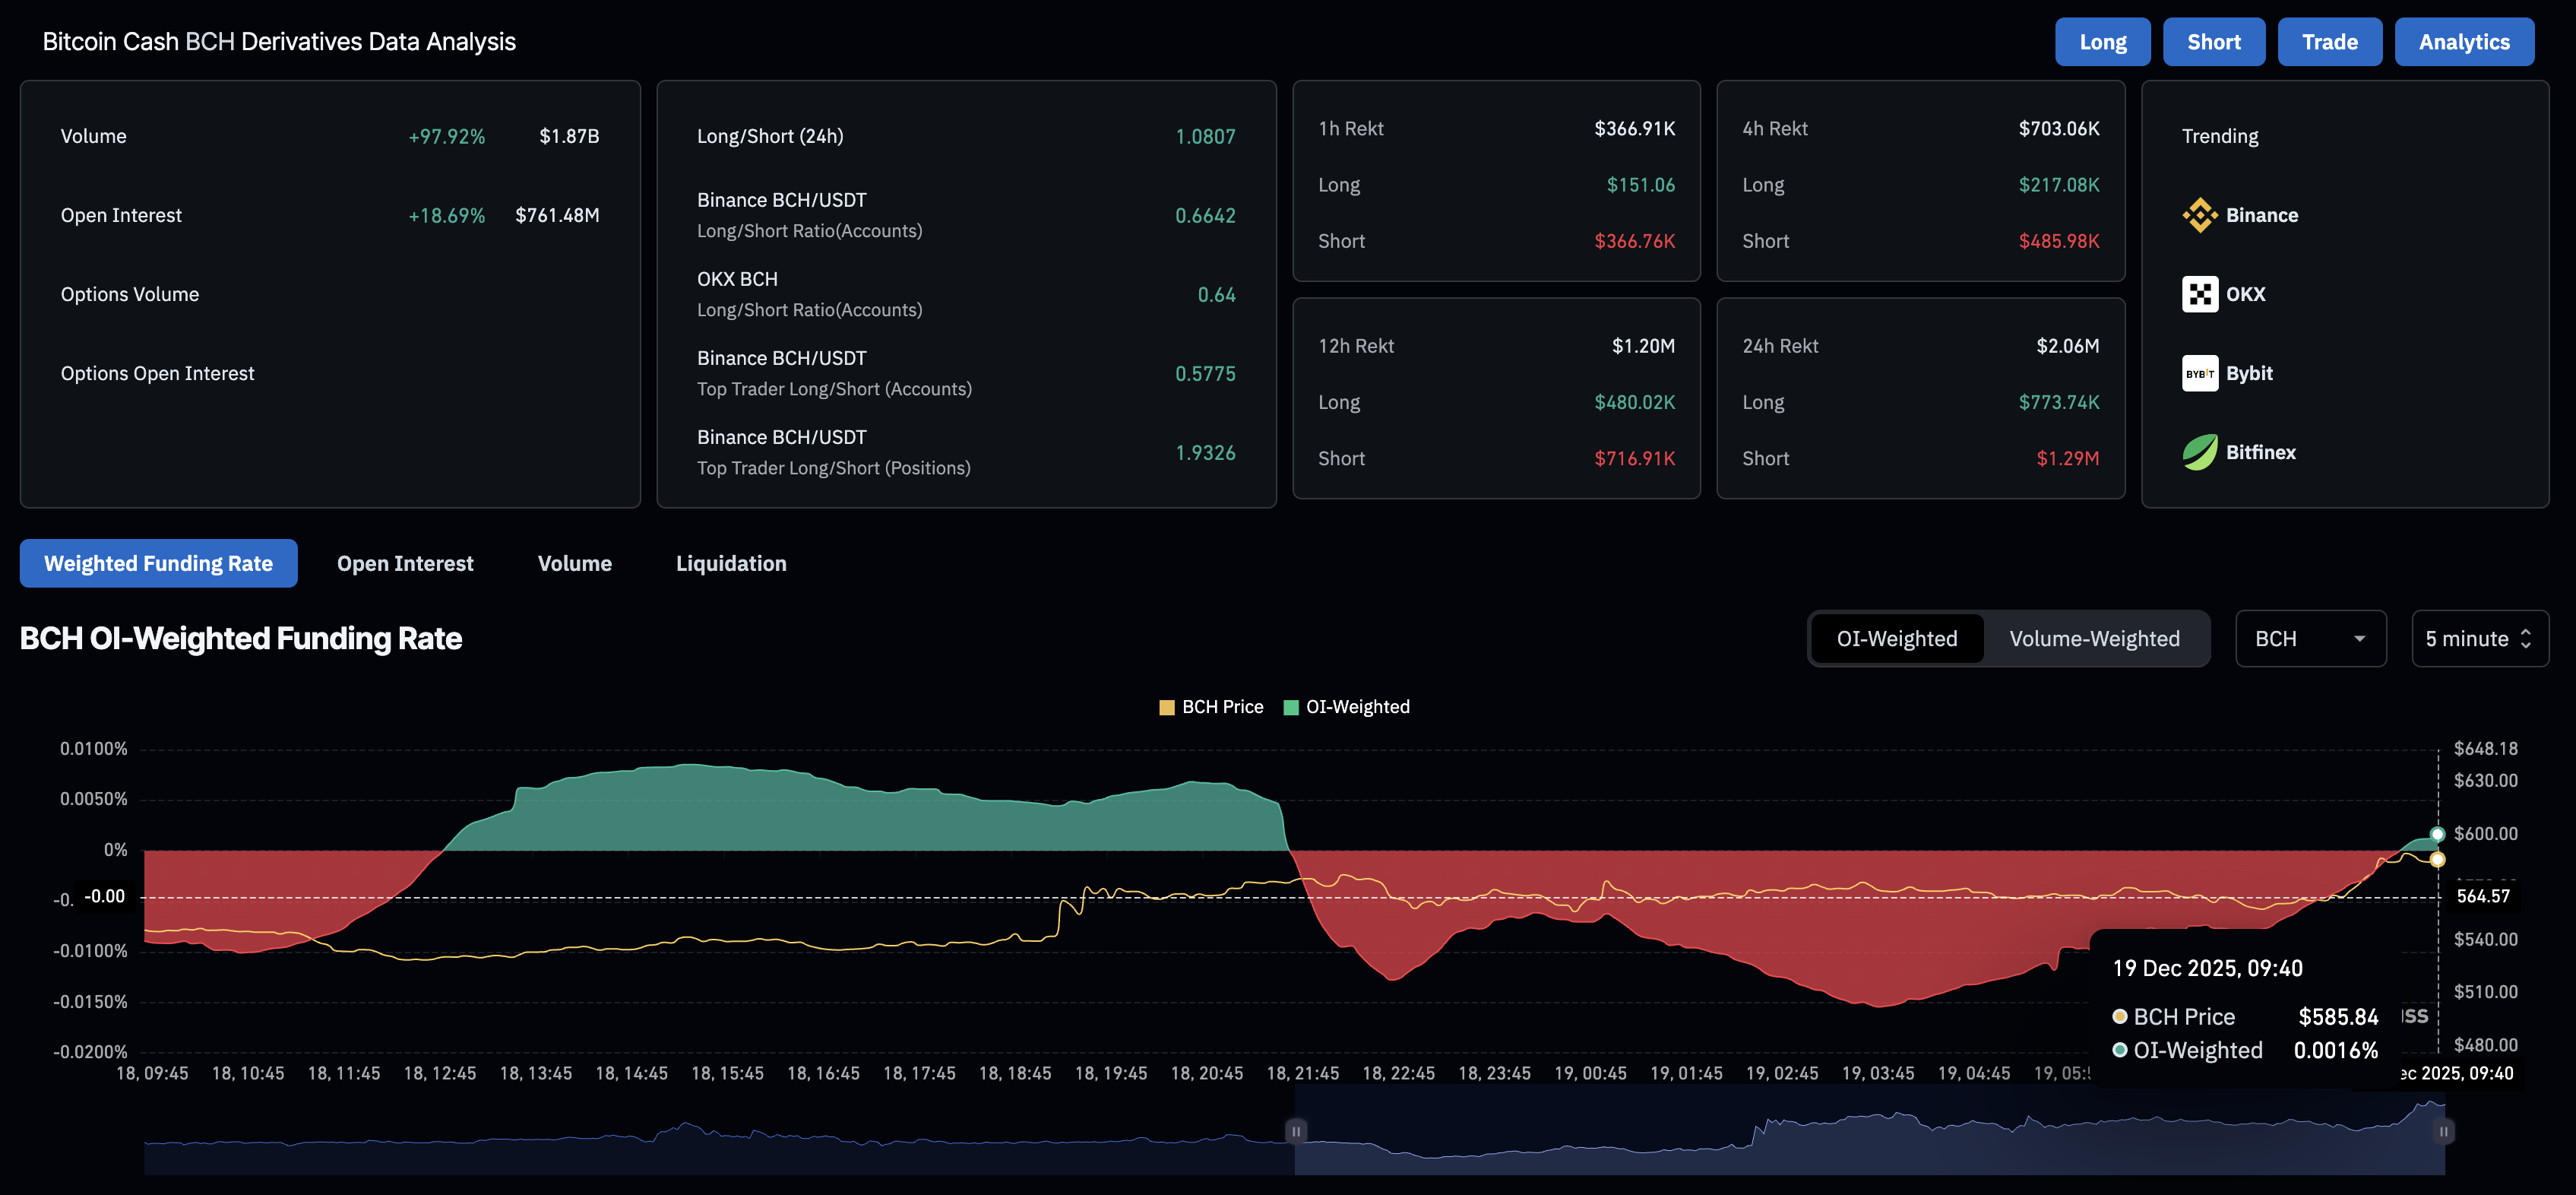
CoinGlass data shows that the BCH futures Open Interest (OI) is up 18.69% in the last 24 hours, reaching $761.48 million, indicating a surge in capital exposure as risk-on sentiment returns to the market. Additionally, the OI-weighted funding rate flipped positive to 0.0016%, up from -0.154% earlier on the day, indicating refreshed bullish interest.
Technical outlook: Will Bitcoin Cash price exceed $600?
Bitcoin Cash trades above the 50- and 200-period Exponential Moving Averages (EMAs) on the 4-hour price chart after a double-bottom reversal from $530. The BCH inches toward the R1 Pivot Point at $591, aiming for a bullish close above it.
If BCH clears this level, it could extend the rally above $600, with bulls aiming for the R2 Pivot Point at $625.
The rebound marks an upward shift in the 50-period and 200-period EMAs, avoiding a potential crossover (Death Cross pattern).
Furthermore, the momentum indicators on the 4-hour chart indicate a sharp increase in bullish pressure. The Relative Strength Index (RSI) at 64 steadies toward the overbought boundary while the Moving Average Convergence Divergence (MACD) crosses into the positive territory, accompanied by successively rising green histogram bars.
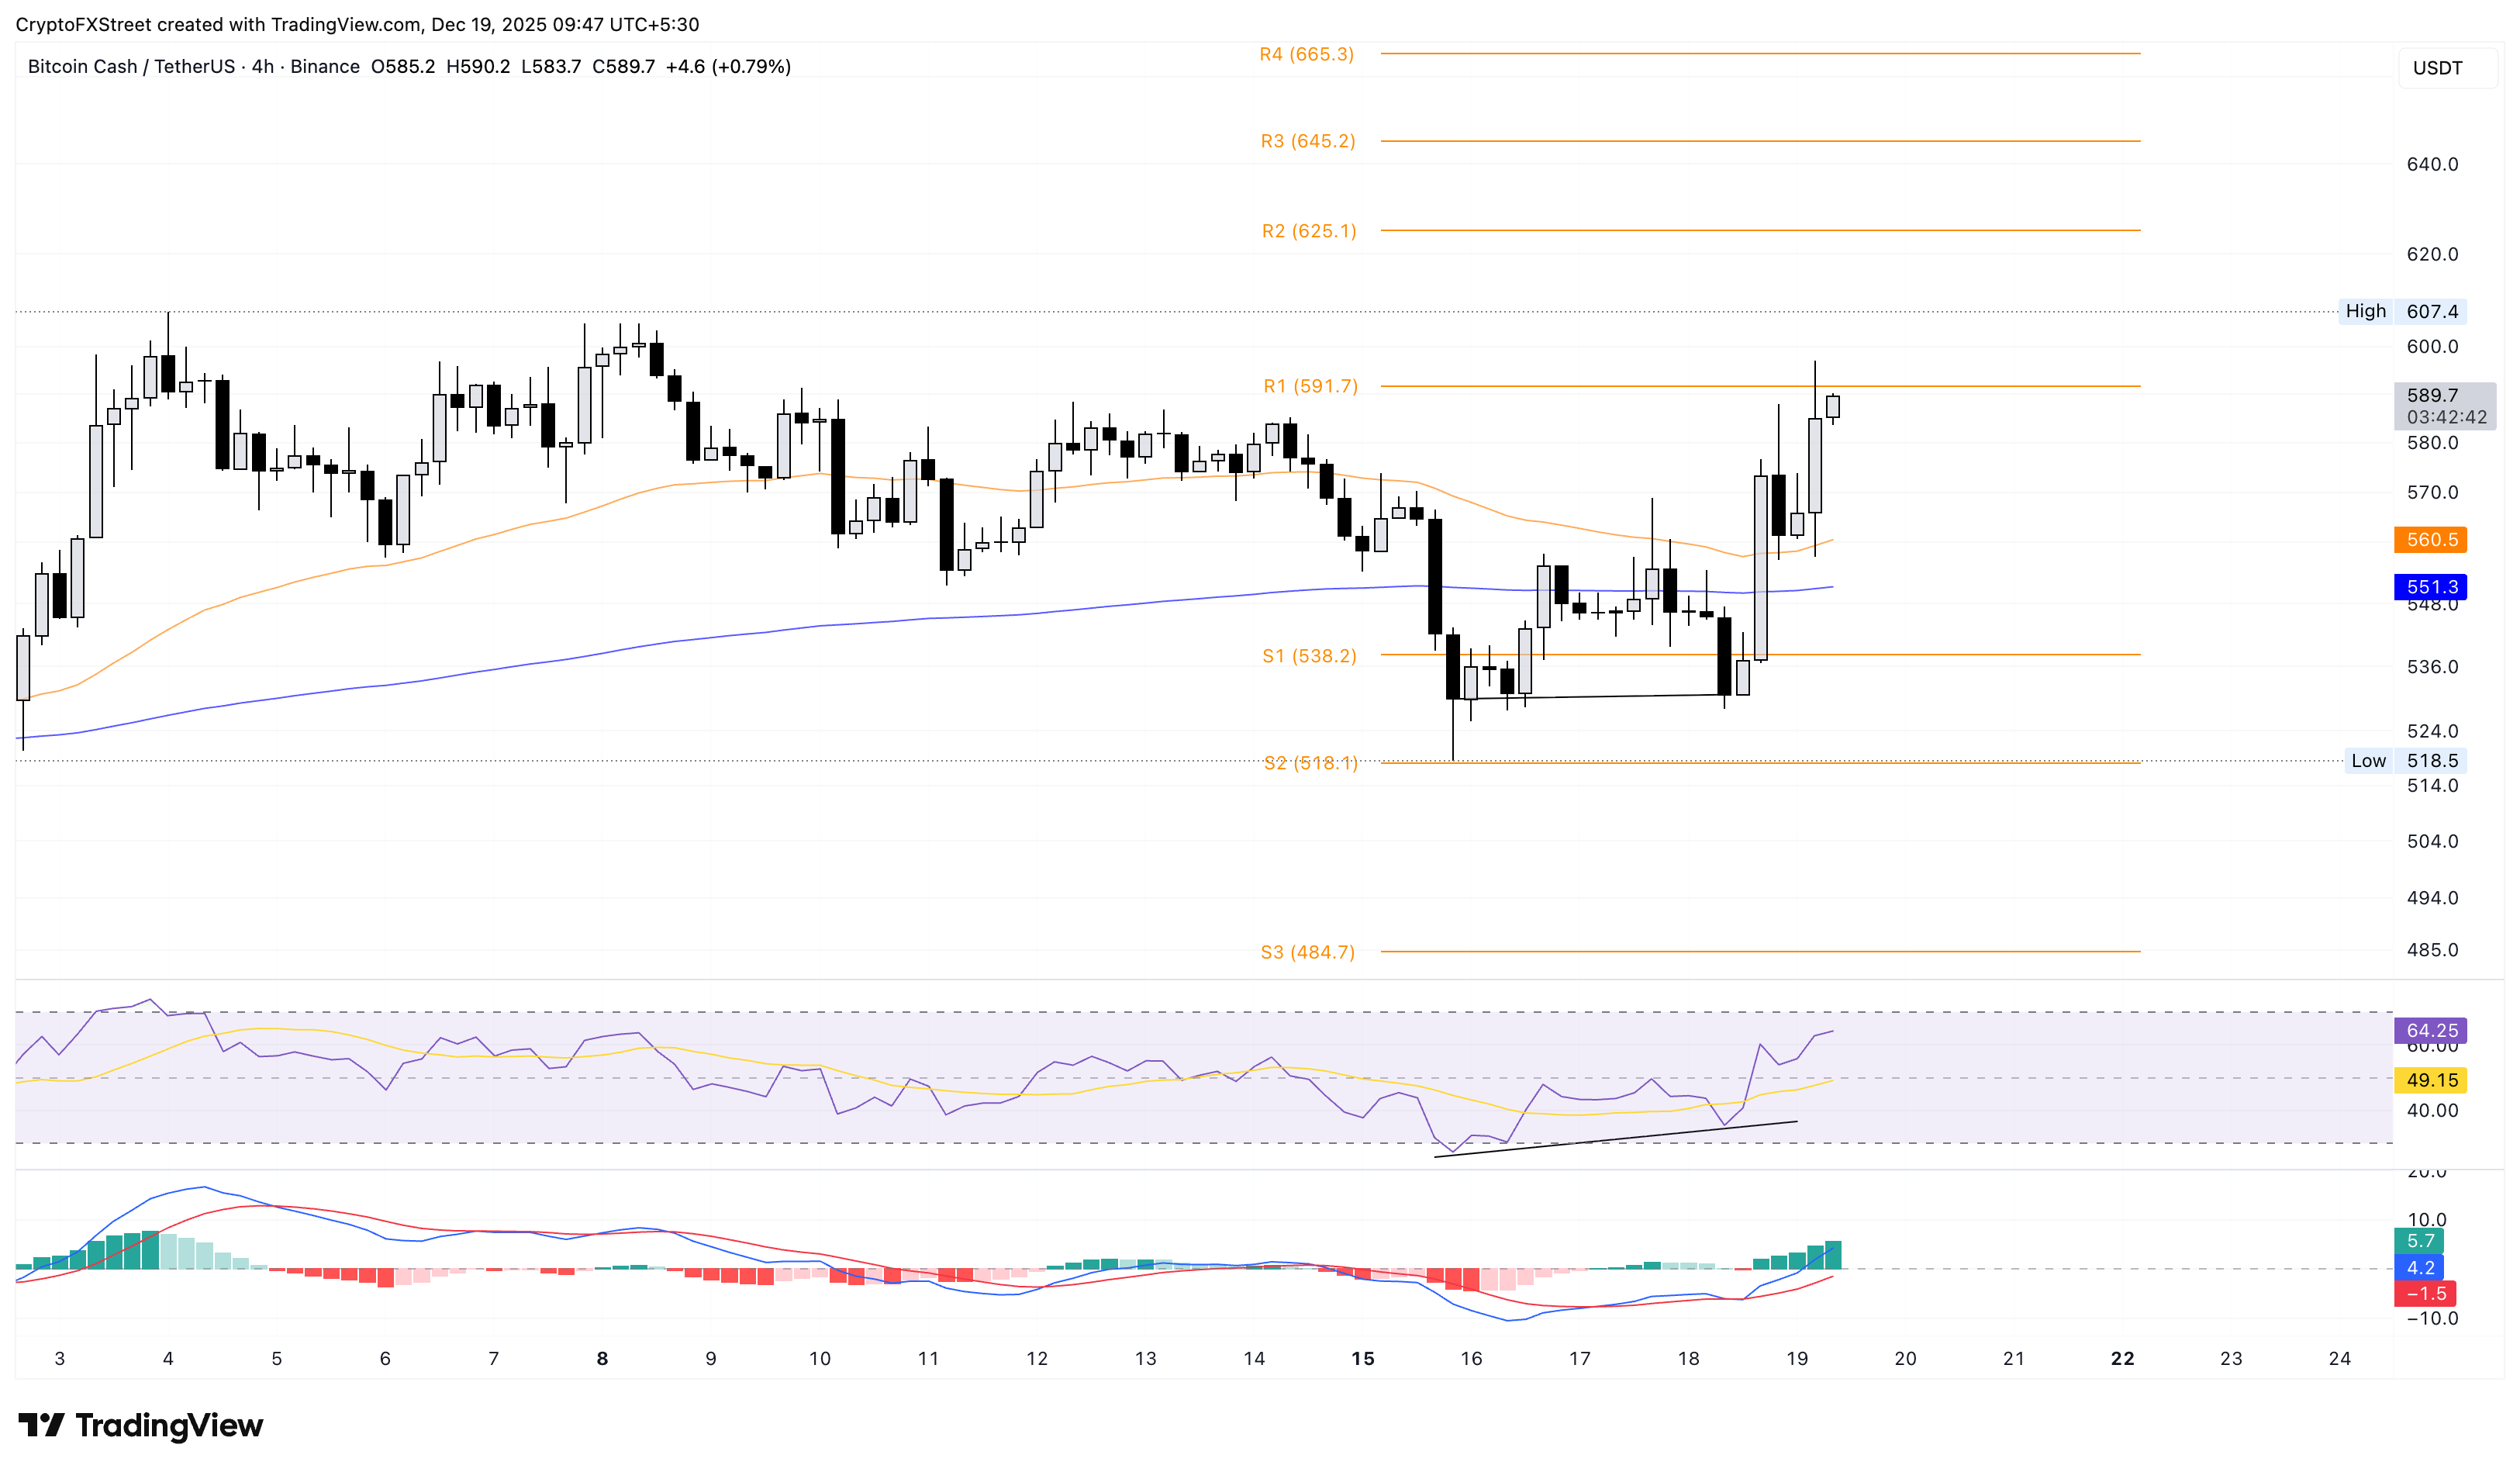
Looking down, if BCH flips before crossing above $600, it could retest the 50-period EMA at $560.


