
Trade The World
BNB Price Forecast: BNB risks a 10% drop as sell-off wave amplifies
By Vishal Dixit
Date Published: 26 Sep 2025 | Date Modified: 26 Sep 2025


POPULAR ARTICLES

BNB (BNB), previously known as Binance coin, trades below $1,000 after the 7% drop on the previous day. At the time of writing, BNB extends the loss by nearly 1% on Friday, approaching the support trendline of a rising channel.
- BNB reverts within a rising channel as the broader cryptocurrency market corrects.
- Derivatives data show significant capital outflows, as indicated by Open Interest, suggesting a lower level of traders’ confidence.
- The technical outlook suggests that BNB is approaching crucial crossroads as buying pressure wanes.
BNB (BNB), previously known as Binance coin, trades below $1,000 after the 7% drop on the previous day. At the time of writing, BNB extends the loss by nearly 1% on Friday, approaching the support trendline of a rising channel. Both the derivatives and technical outlook suggest a sudden decline in buying pressure, flashing risks of further correction.
Sell-side dominance arises in BNB derivatives
CoinGlass data indicates that the BNB Open Interest has decreased by 3.56% over the last 24 hours, now standing at $1.84 billion. This significant capital outflow from BNB derivatives indicates a risk-off sentiment among traders.
Adding to the lowered interest, the OI-weighted funding rate has dropped to 0.0062% from 0.0091% earlier in the day. Furthermore, the long liquidations of $11.91 million in the last 24 hours outpace short liquidations at $721,610, indicating a larger wipeout of bullish-aligned traders.
Finally, the 24-hour long-to-short ratio reads 0.9279, indicating that a greater number of short positions are active, suggesting a sell-side dominance.
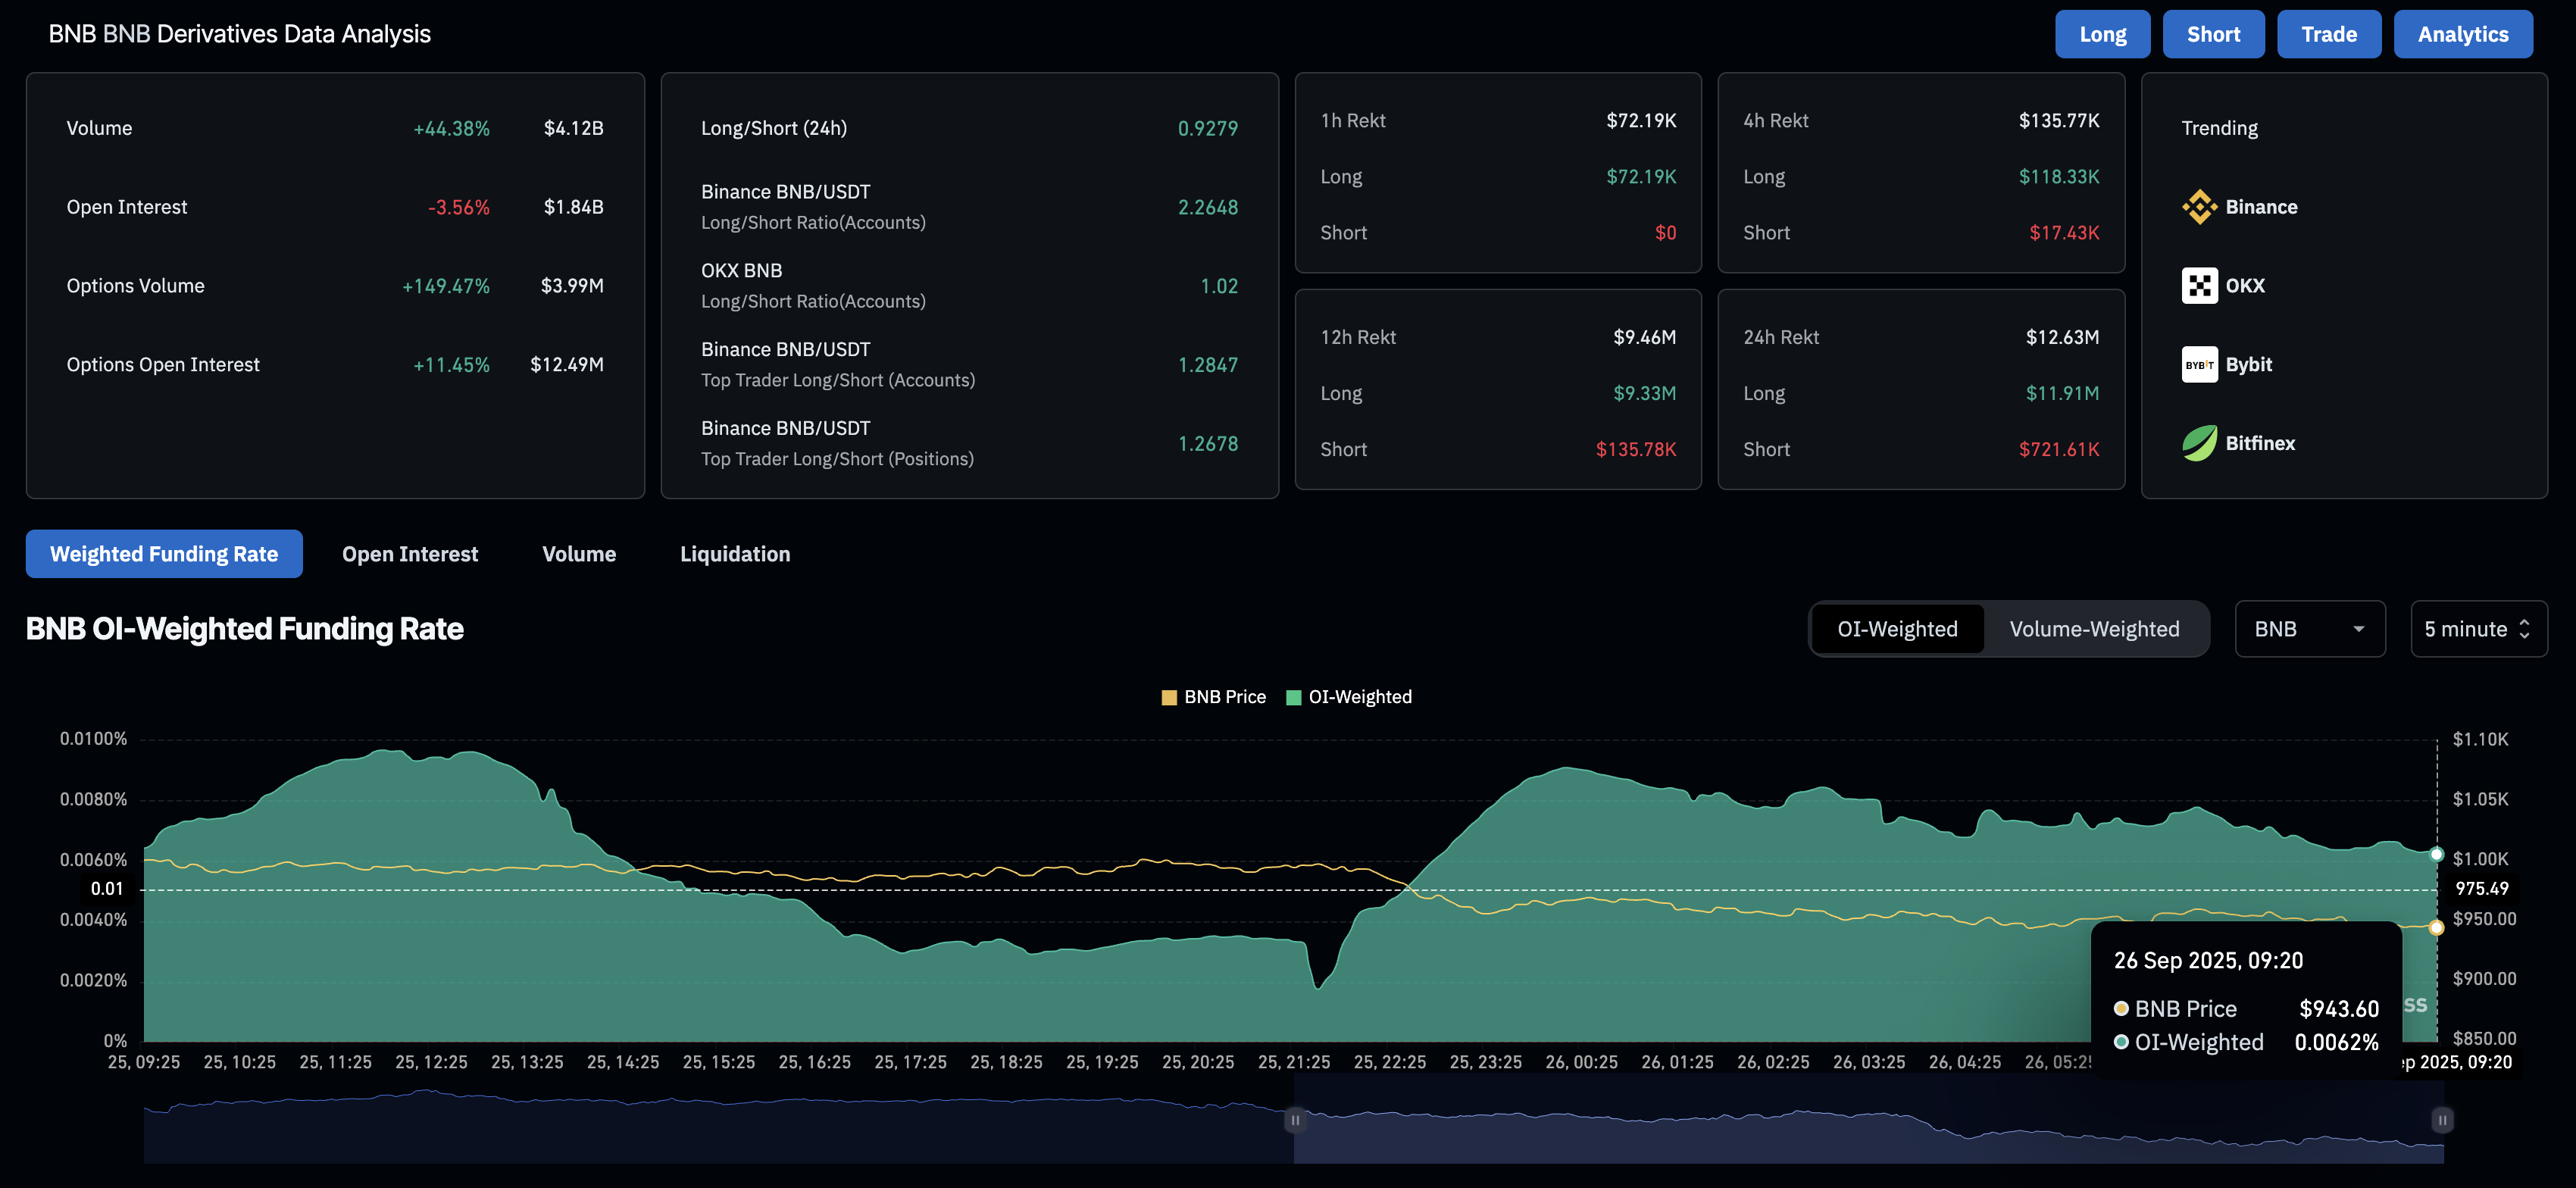
BNB derivatives. Source: CoinGlass
BNB risks channel breakdown as buying pressure wanes
BNB is approaching the lower boundary line of a rising channel pattern on the daily chart. The Centralized Exchange (CEX) token reversed from the overhead trendline at its all-time high of $1,083 on Sunday, igniting the current downcycle within the parallel channel.
To confirm the channel fallout, BNB bears must achieve a decisive close below the R1 pivot level, which serves as resistance-turned-support at $928. A potential downside breakout could extend the decline to the 50-day Exponential Moving Average (EMA) at $895, followed by the centre pivot level at $829.
The technical indicators on the daily chart reflect a decrease in buying pressure, which increases the chances of a potential breakdown. The Moving Average Convergence Divergence (MACD) extends the downside movement after crossing below its signal line on Thursday, indicating a rise in bearish momentum.
Additionally, the Relative Strength Index (RSI) reads 50 on the same chart, marking a significant decline from the overbought zone as buying pressure wanes.
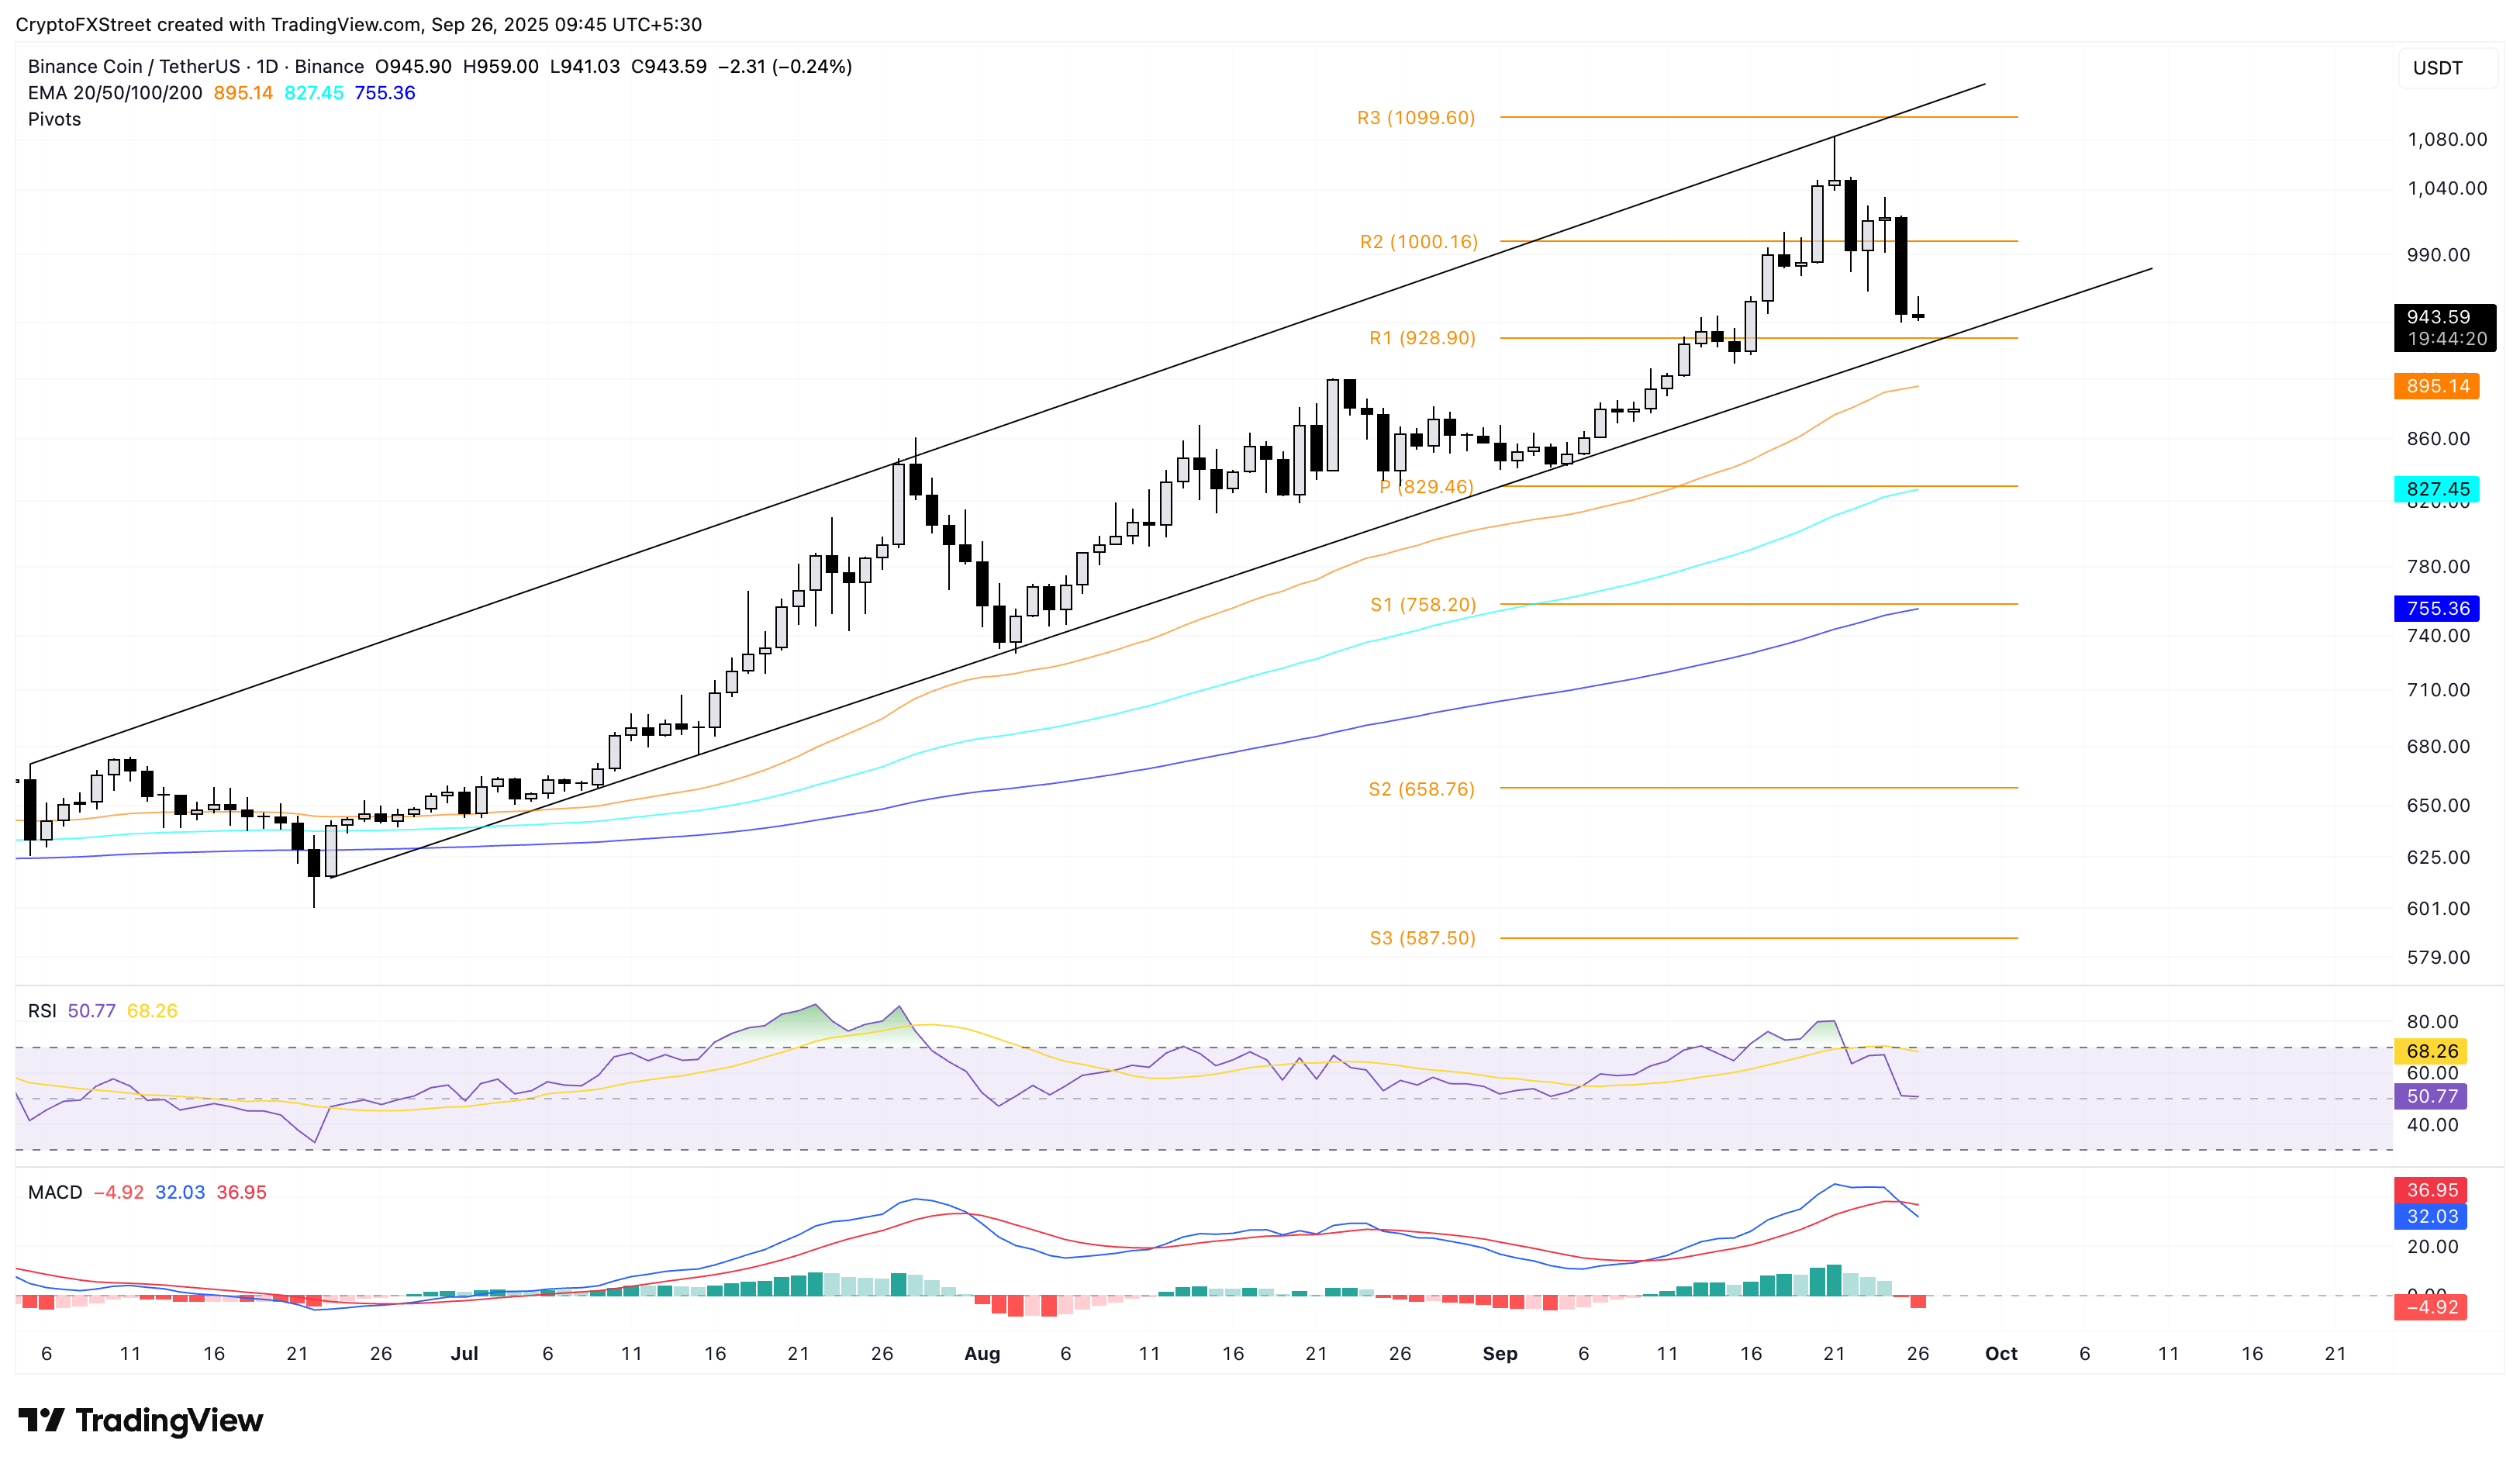
BNB/USDT daily price chart.
On the upside, if BNB rebounds from $928, it could retest the R2 resistance at $1,000 psychological milestone.

FXStreet
More than a million users rely on FXStreet for real-time market data, charting tools, expert insights, and forex news. Its comprehensive economic calendar and educational webinars help traders stay informed and make calculated decisions. FXStreet is supported by a team of about 60 professionals, split between the Barcelona headquarters and various global regions.
Read More


