


- Hyperliquid struggles to break above $50 as a bearish RSI divergence warns of a pullback.
- Hyperliquid’s weekly fees and revenues fall, suggesting softer demand.
- The liquidation map shows over $22 million in long positions at risk if HYPE sinks to $46.
Hyperliquid (HYPE) struggles to overcome the $50.000 psychological resistance, consolidating below this level since Monday, as a bearish divergence in the Relative Strength Index (RSI) on the 4-hour chart suggests that buying pressure is waning. The on-chain data signals a decline in Hyperliquid’s weekly fees and revenues, indicating low demand.
Furthermore, the liquidation map highlights over $22 million in long positions at risk if HYPE revisits the $46 mark.
On-chain fees and revenues decline as demand lowers
Hyperliquid is the largest revenue-generating Decentralized Finance (DeFi) protocol over the last 30 days, excluding stablecoin issuers Tether and Circle, with $100.65 million in revenue in this period. However, the weekly flows suggest a decline in fees and revenue collected so far this week to $11.84 million and $10.63 million, respectively, from the second week of October, when they were $34.86 million and $31.10 million. This steady decline suggests that liquidity and demand on the platform are taking a hit as broader market volatility increases, making on-chain traders risk-averse.
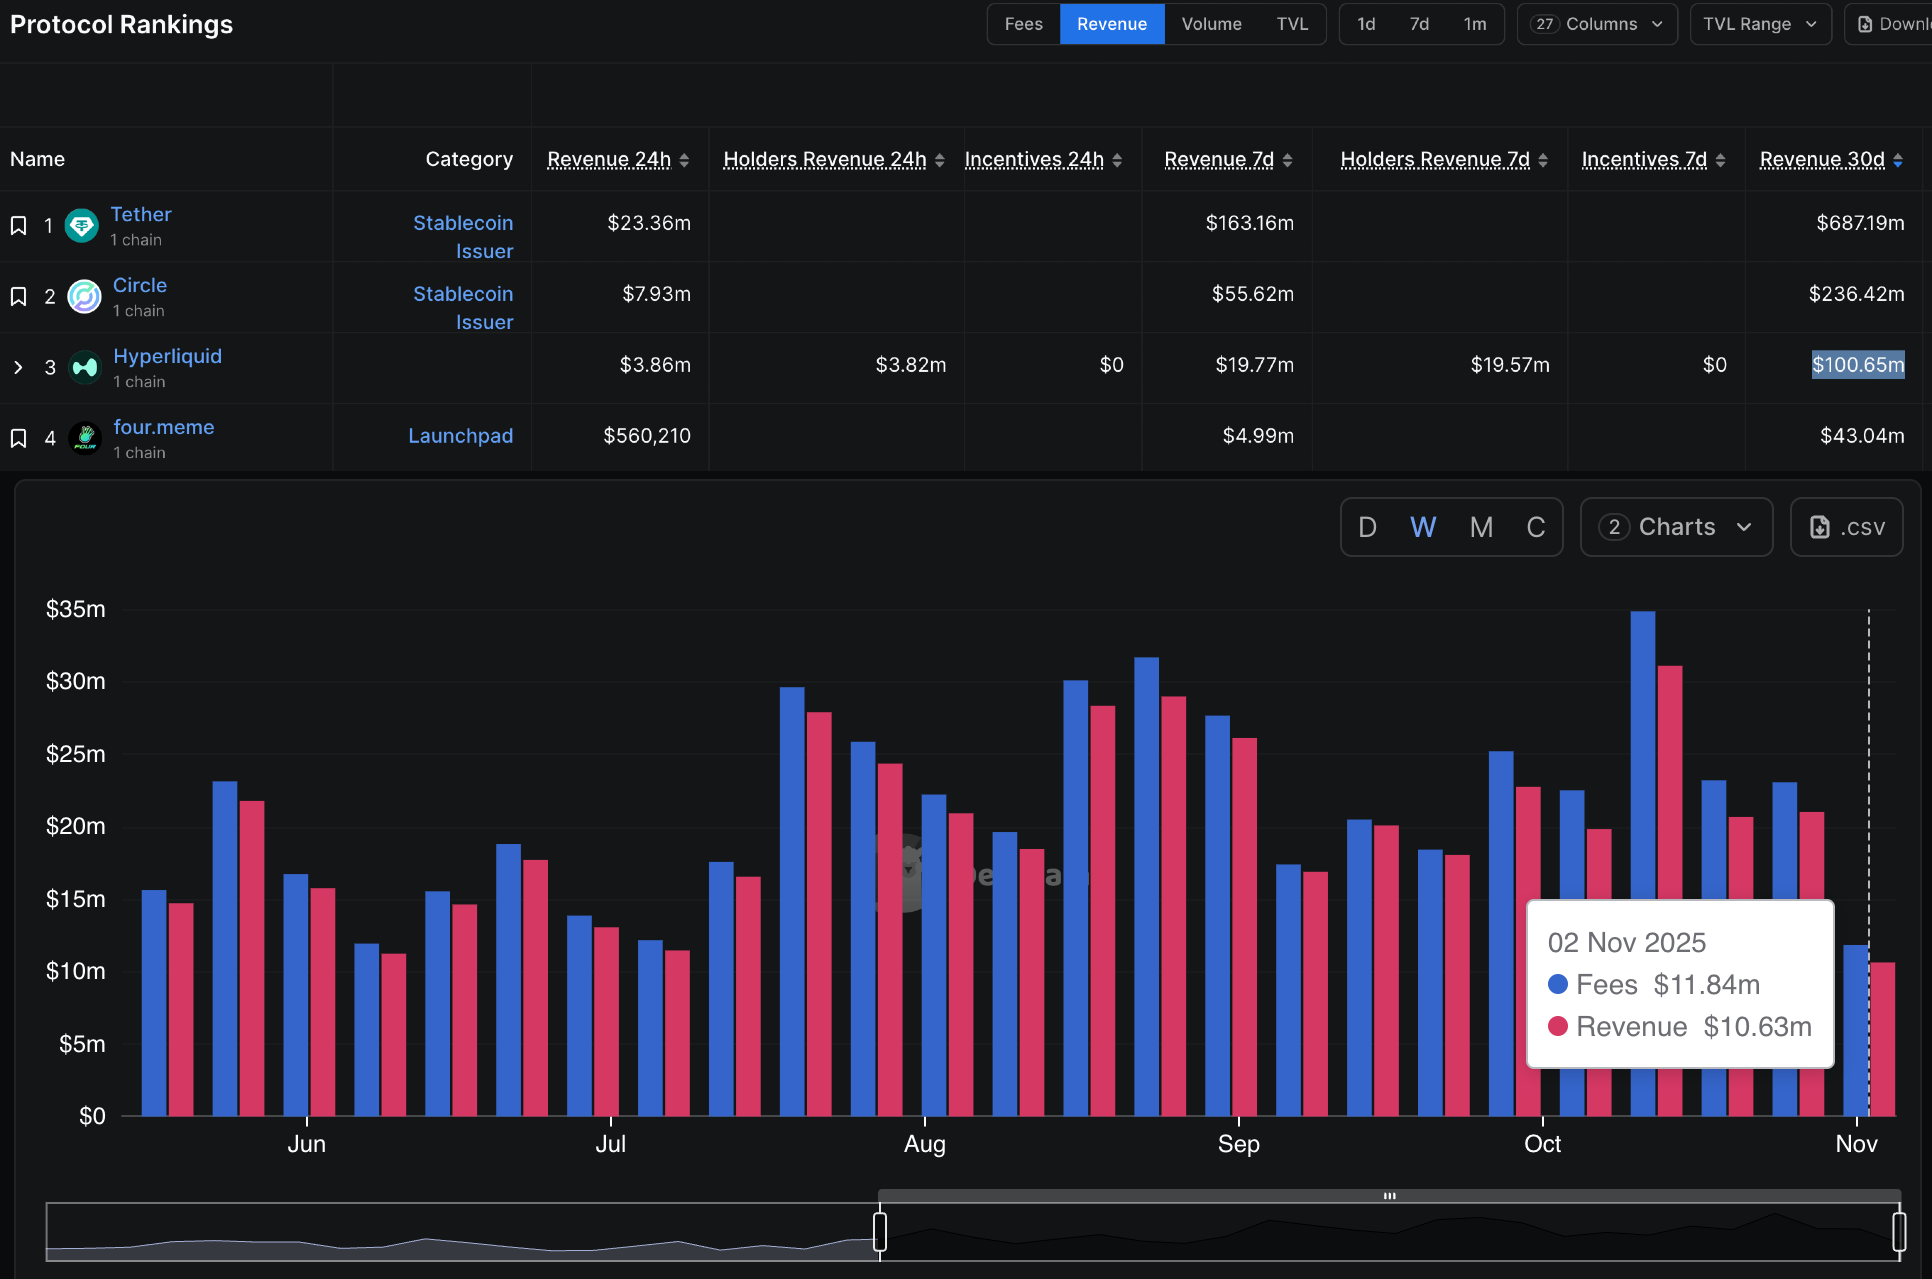
Hyperliquid fees and revenue. Source: DeFiLlama
Hyperliquid bulls increase risk exposure
Hyperliquid demand in the retail segment remains strong as traders anticipate a potential breakout run. CoinGlass data shows that the HYPE futures Open Interest (OI) has increased by 9.11% over the last 24 hours, reaching $2.17 billion, indicating a bullish bias on the price floor.
The OI-weighted funding rate stands at 0.0078% corroborating the bullish incline in traders’ sentiment.
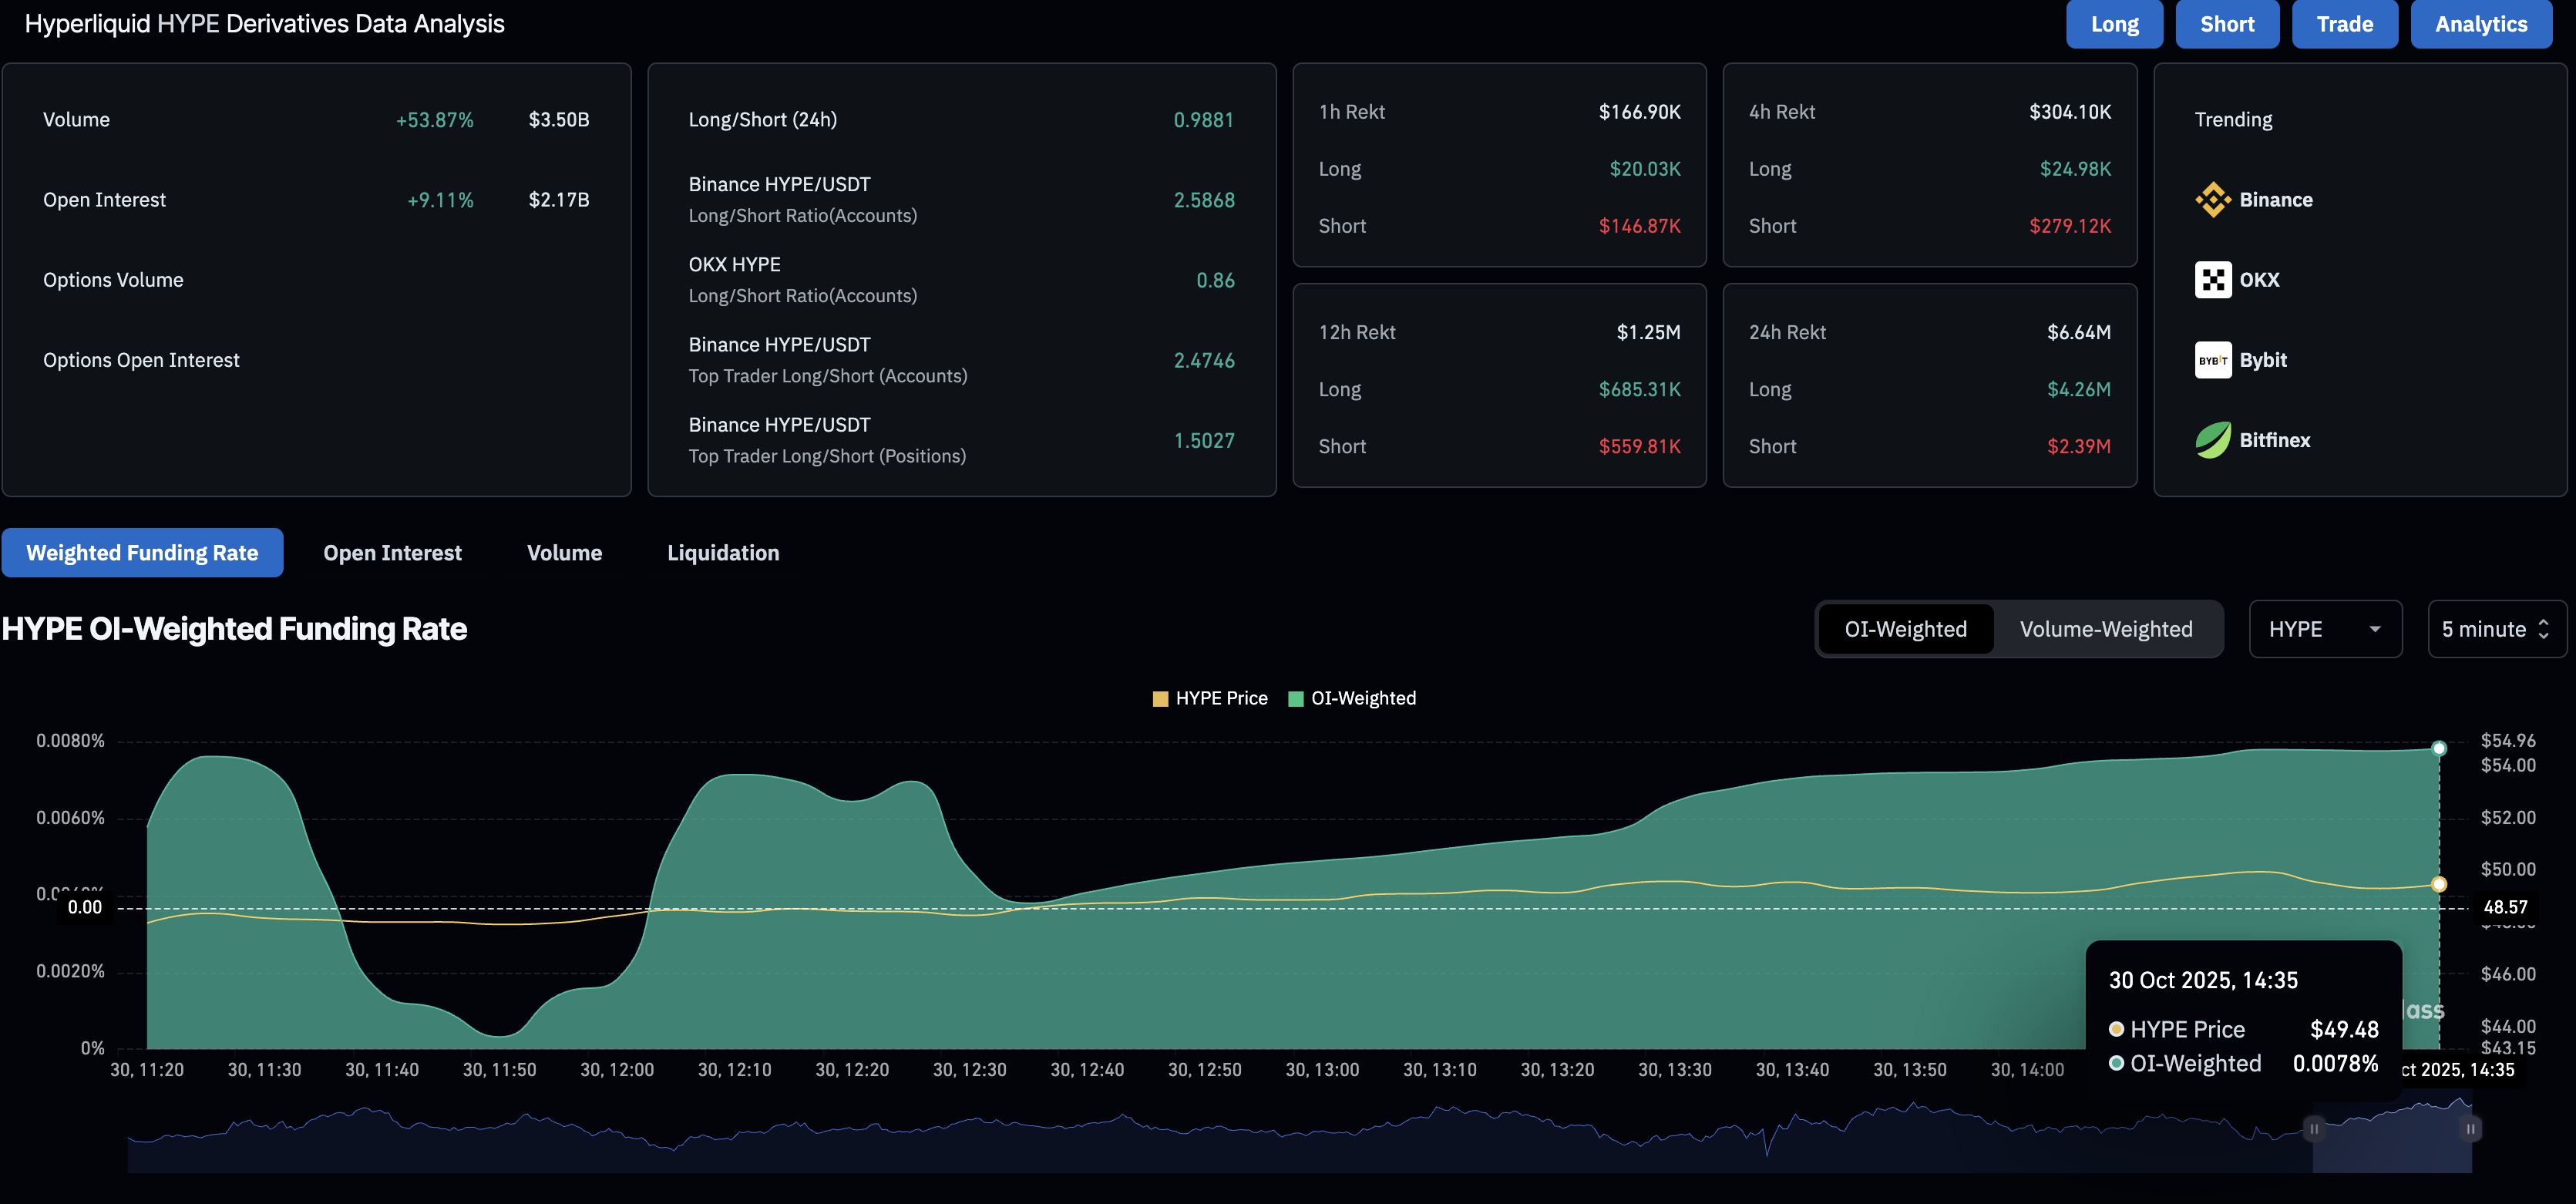
Hyperliquid derivatives data. Source: CoinGlass
However, the liquidation map flags $22.31 million worth of long positions at risk if HYPE slips to $46. On the upside, the liquidation price for $14.74 million in short liquidation converges at $50.49, indicating that buyers have more risk exposure.
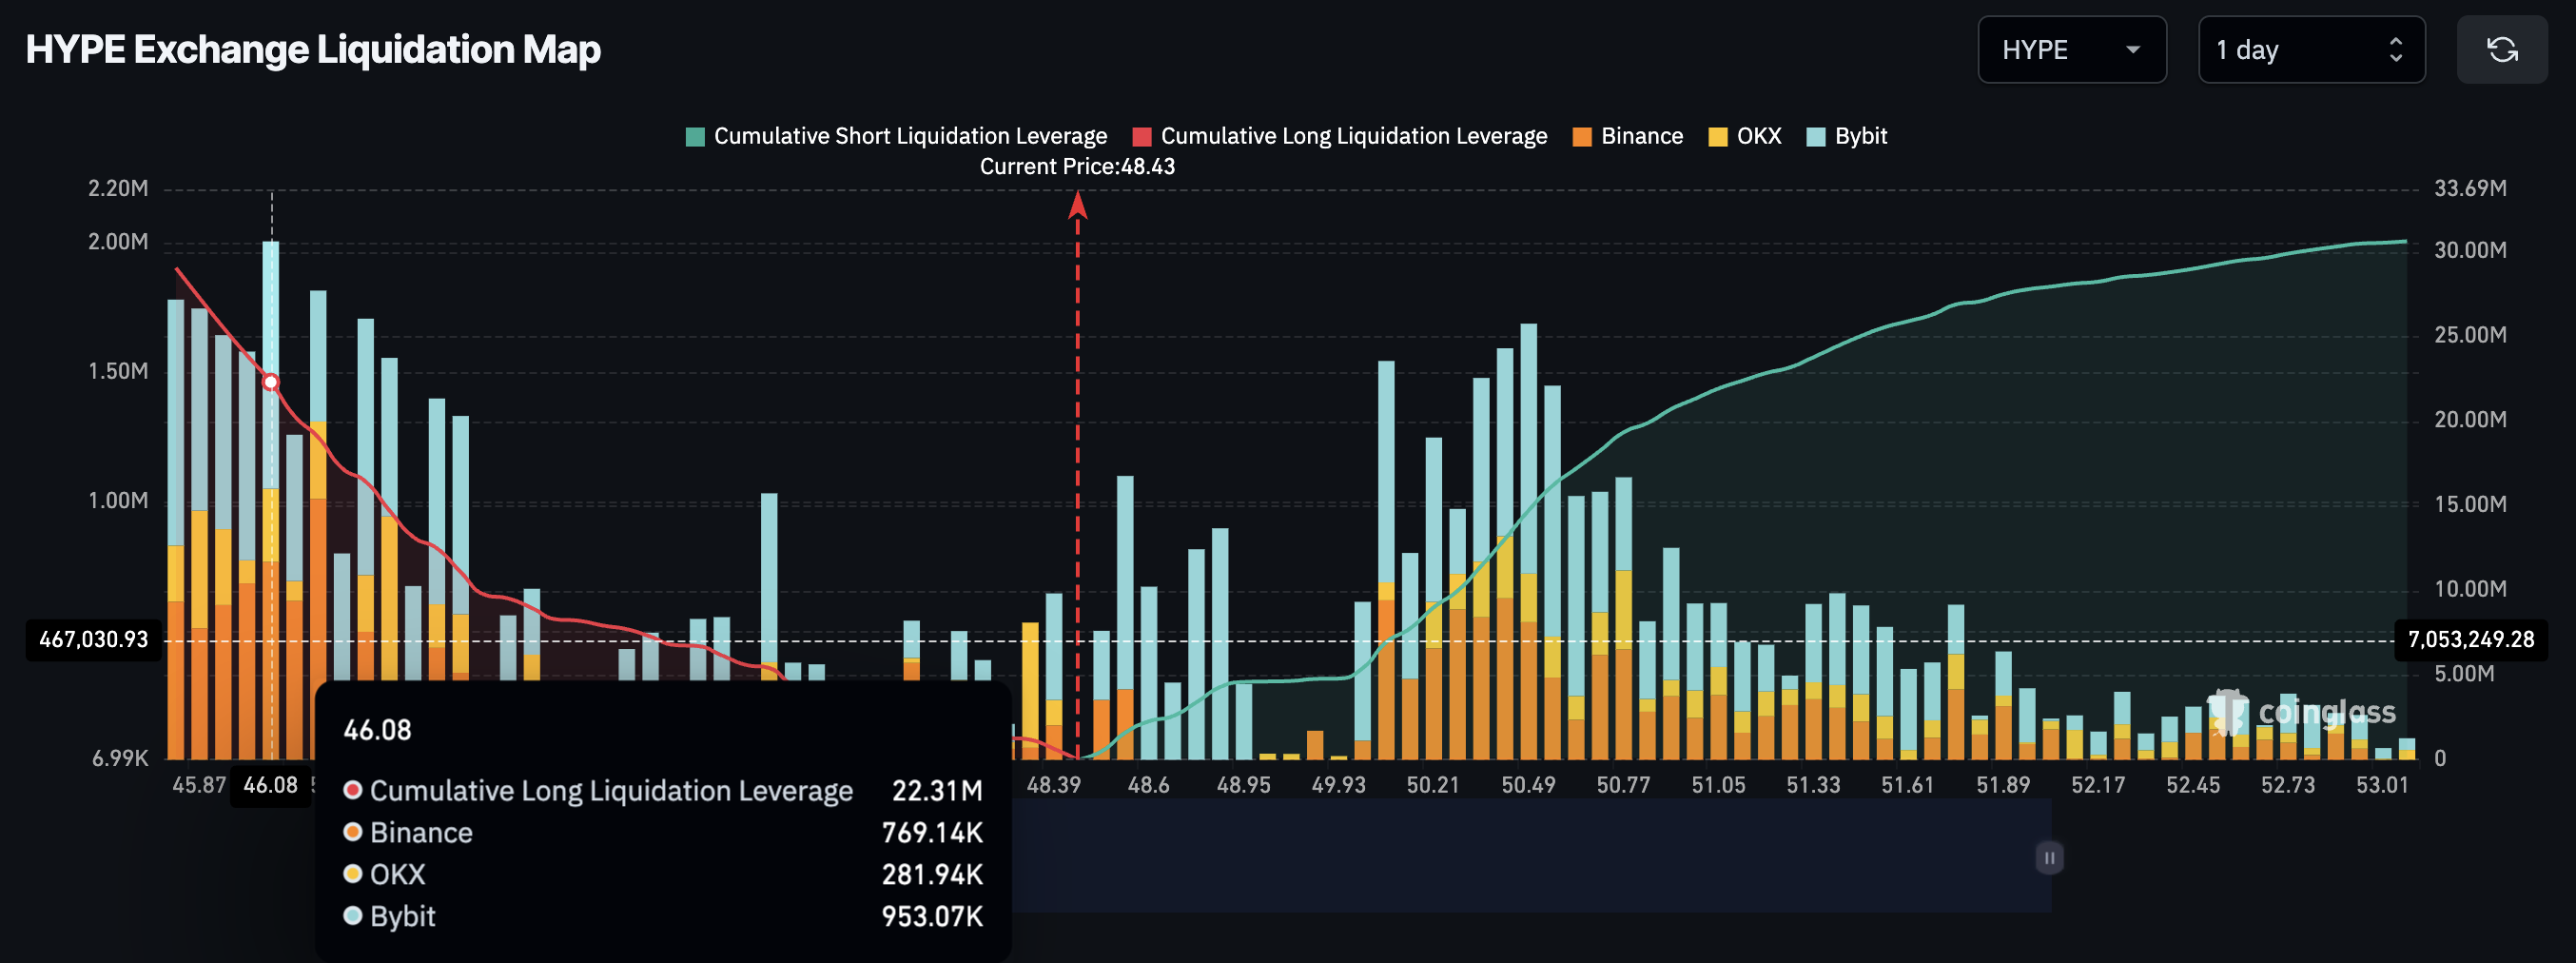
Hyperliquid liquidation map. Source: CoinGlass
Technical outlook: Will Hyperliquid fail to reclaim $50?
Hyperliquid trades above $48 at press time on Thursday as buyers struggle to reclaim the $50 milestone. The HYPE token consolidates above the 50% Fibonacci retracement level at $46.351, drawn from the September 18 peak of $59.412 to the October 17 low of $33.289.
The key resistance above $50 for the perpetuals-focused Decentralized Exchange (DEX) token lies at $51.432 and $56.596, marked by the October 5 and September 20 highs, respectively.
The Moving Average Convergence Divergence (MACD) on the 4-hour chart is approaching its signal line, suggesting a potential bullish crossover. This potential crossover, if successful, would confirm a renewed bullish momentum.
Still, the RSI is at 59 on the same chart and continues to decline from the overbought zone, suggesting fading bullish momentum and signaling a bearish divergence as HYPE attempts to rise.
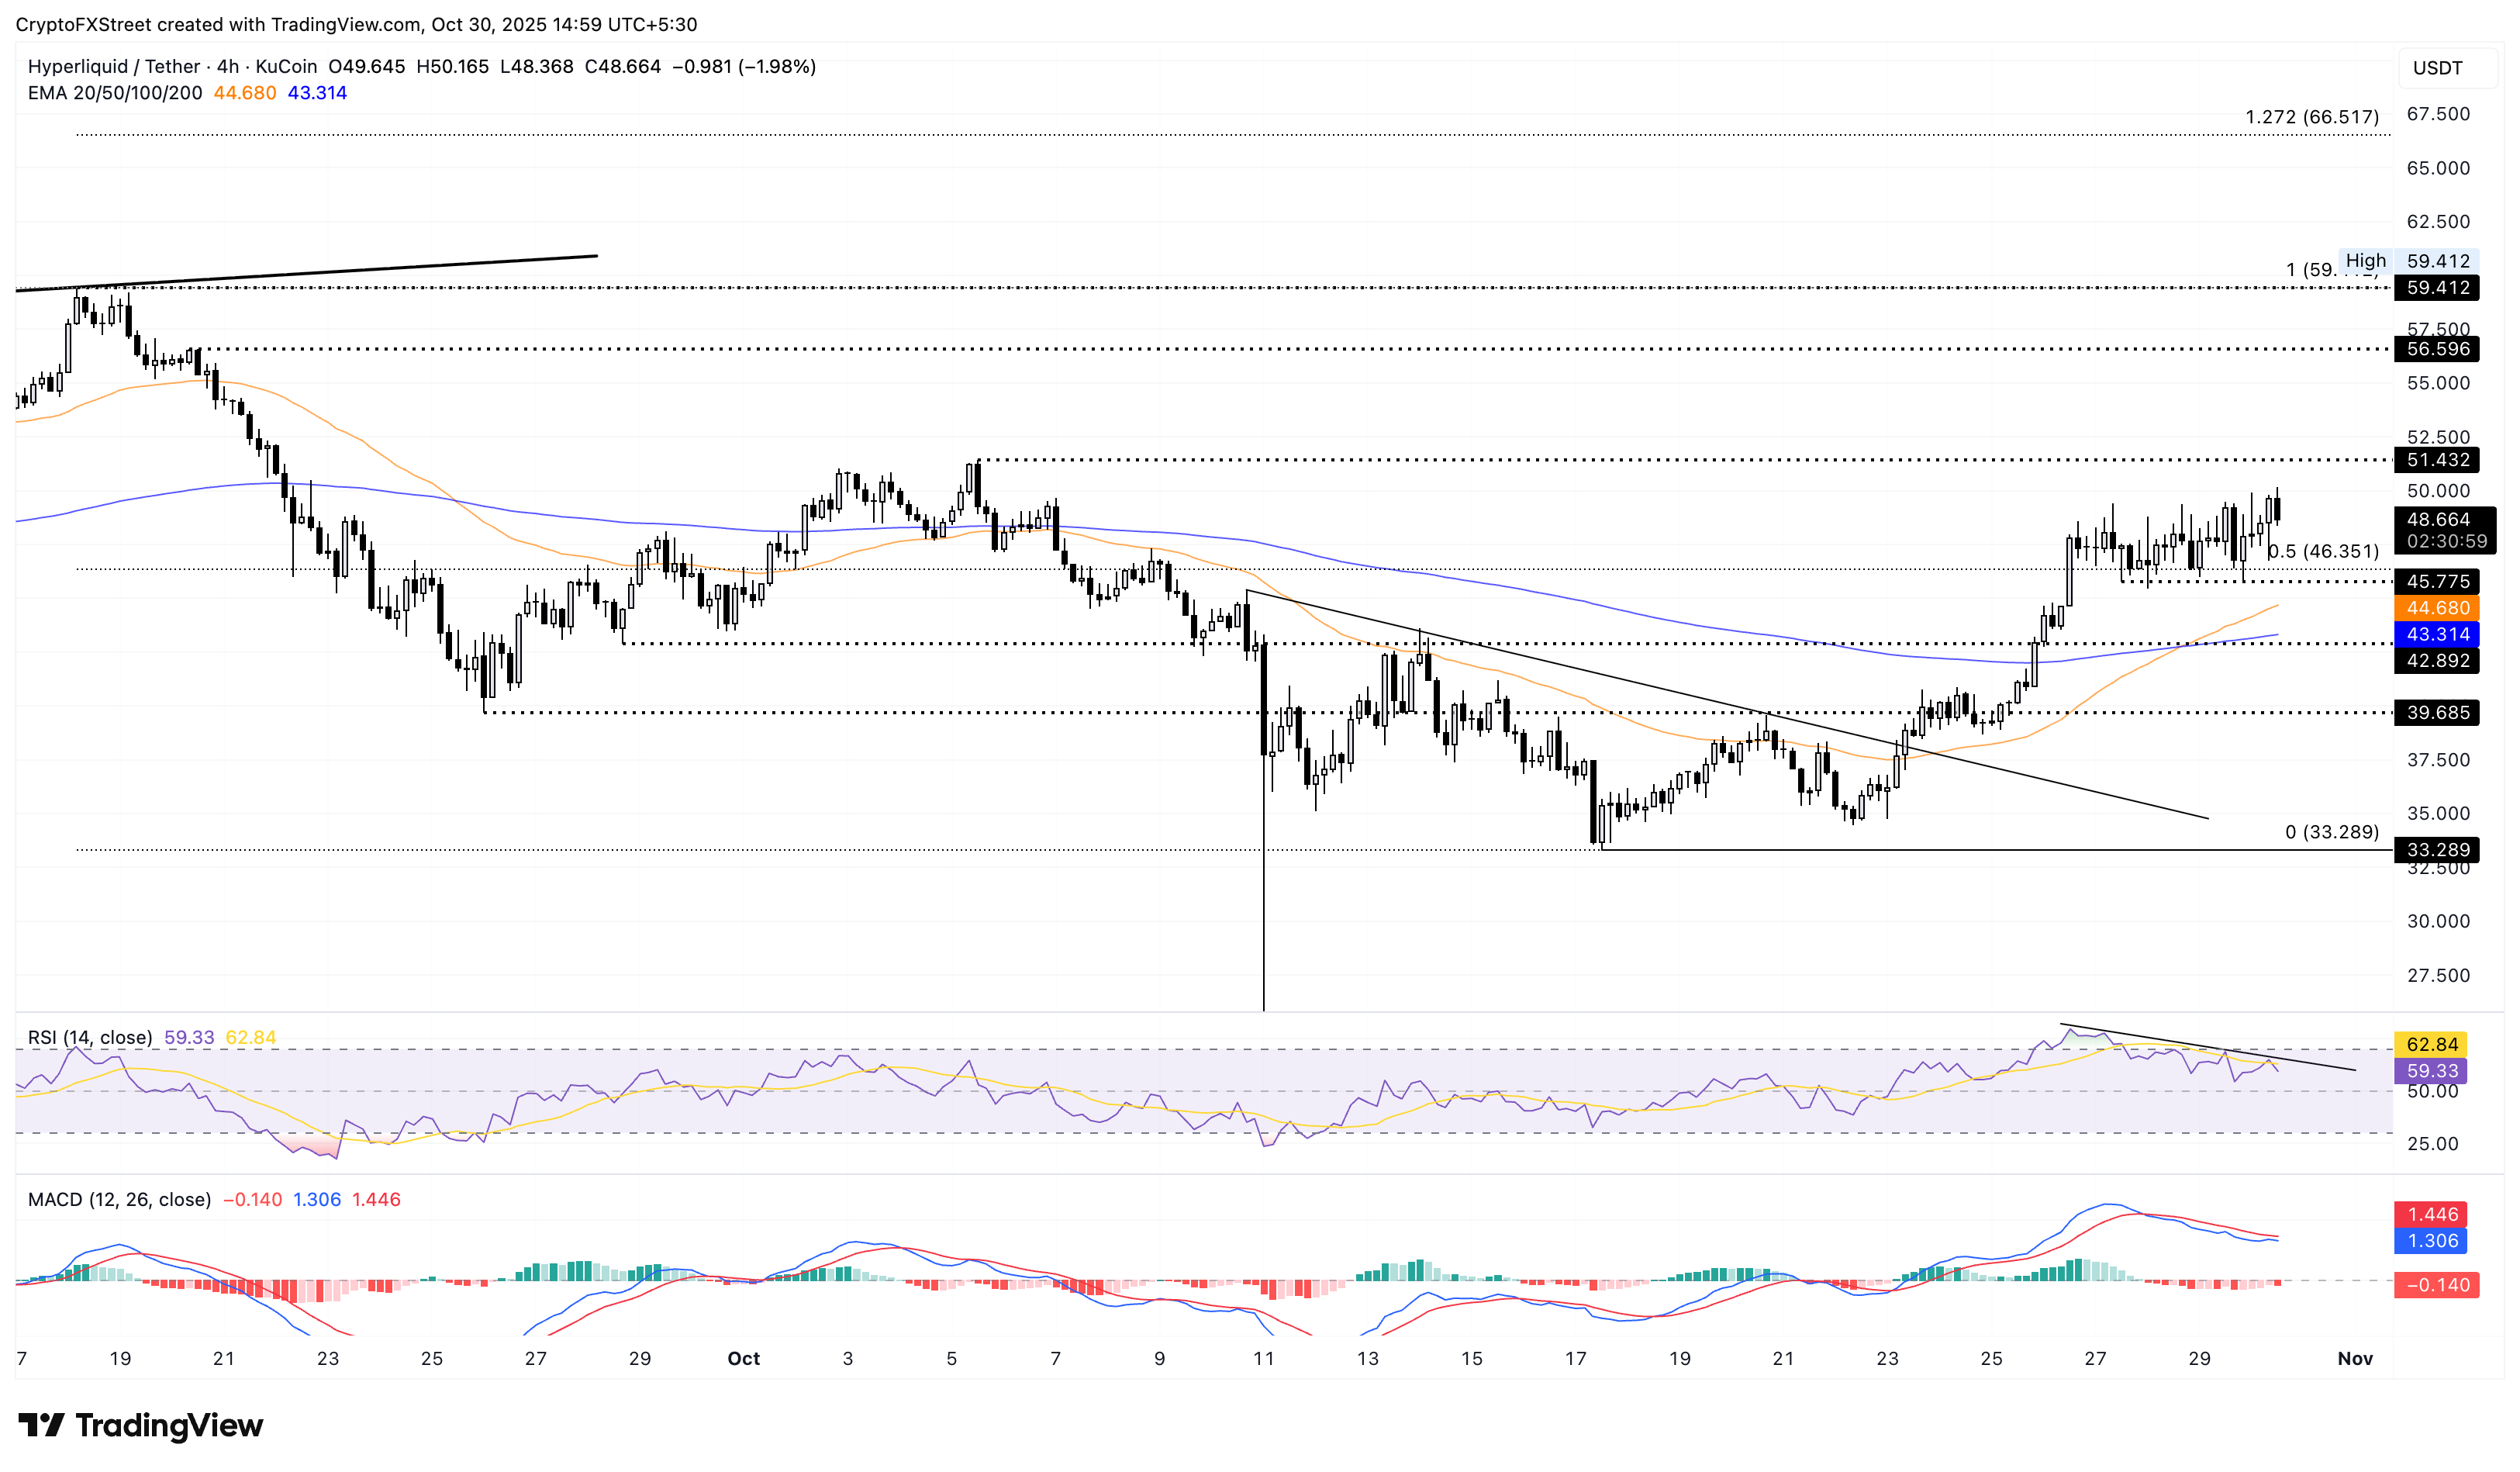
HYPE/USDT daily price chart.
If HYPE fails to absorb the supply near $50, it could retest the 50% Fibonacci retracement level at $46.351, followed by Monday’s low at $45.775. A pullback this intense could trigger forced liquidations of bullish positions, risking a negative feedback loop or a long squeeze.


