


- Monero's price hovers around $477 on Monday, after reaching a new yearly high of $497 last week.
- Bullish sentiment strengthens as social dominance, open interest, and whale activity rise.
- The technical outlook suggests further upside, with bulls aiming for levels above $500.
Monero (XMR) continues to trade above $477 at the time of writing on Monday, after hitting a fresh yearly high last week. Rising bullish signals across on-chain and derivatives data, combined with a constructive technical setup, suggest a move above $500.
Monero’s on-chain and derivatives data show bullish bias
Santiment’s Social Dominance metric for Monero supports a bullish outlook. The index measures the share of XMR-related discussions across the cryptocurrency media. It has been on an upward trend since mid-December, rising to 1.41% on Monday, the highest level since November 10. This rise indicates that market interest and sentiment among XMR investors are strengthening.
 [09-1766381317417-1766381317418.36.56, 22 Dec, 2025].png)
On the derivatives front, CoinGlass’ data show that futures OI in Monero at exchanges surged to $99.70 million on Sunday, up from $54.01 million on December 10, and currently stands at $95.42 million. An increasing OI represents new or additional money entering the market and new buying, which could fuel the current XMR price rally.
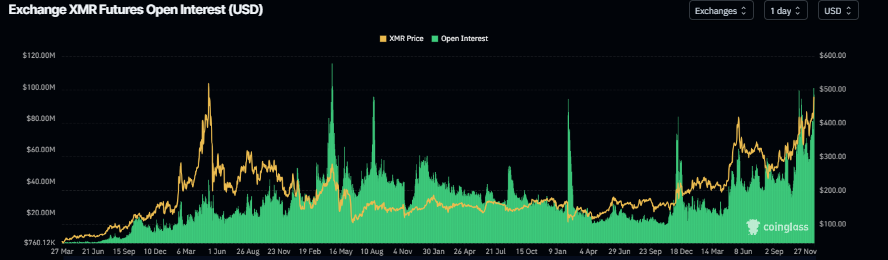
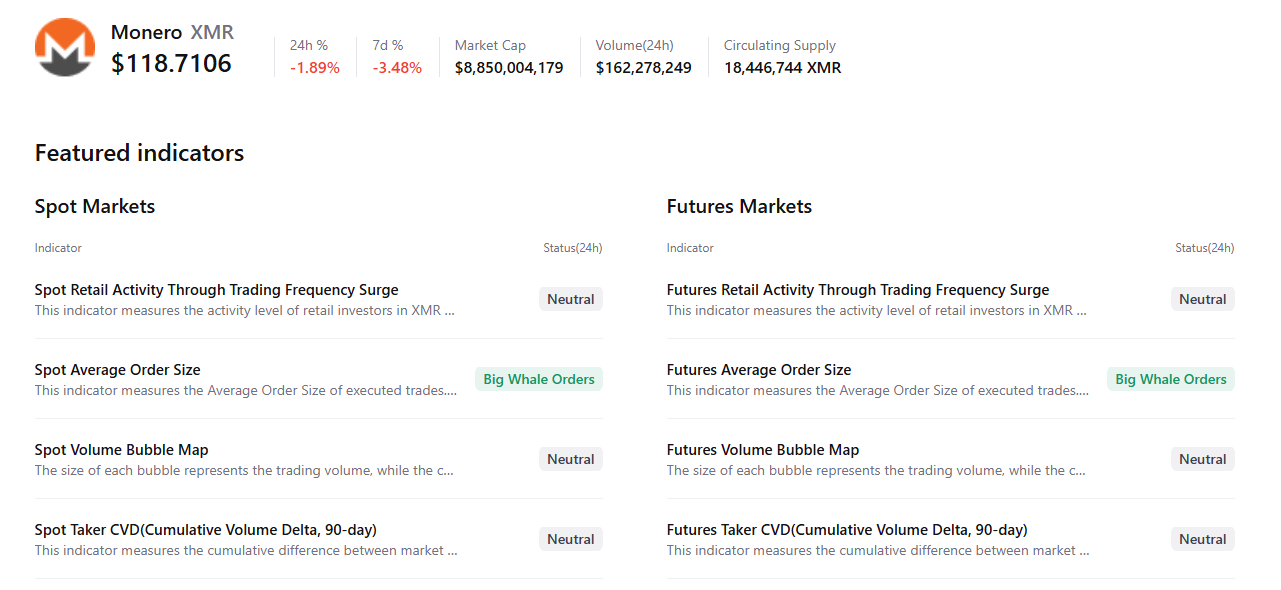
CryptoQuant’s summary data supports the positive outlook, as Monero’s spot and futures markets show large whale orders, signaling a continuation of an upward trend.
Monero Price Forecast: XMR bulls aiming for levels above $500
Monero price found support at the 61.8% Fibonacci retracement level (from the November 9 high of $470 to the November 21 low of $320) at $413.04 on Thursday, and rallied over 14% to a new yearly high of $497 on Saturday. As of Monday, XMR is trading at around $478.02.
If XMR continues its upward momentum, it could extend the rally to the 141.40% Fibonacci extension level at $531.73.
The Relative Strength Index (RSI) on the daily chart is 69, near the overbought level, indicating strong bullish momentum. The Moving Average Convergence Divergence (MACD) showed a bullish crossover last week, and the rising green histograms above the neutral level suggest continuation of an upward trend.
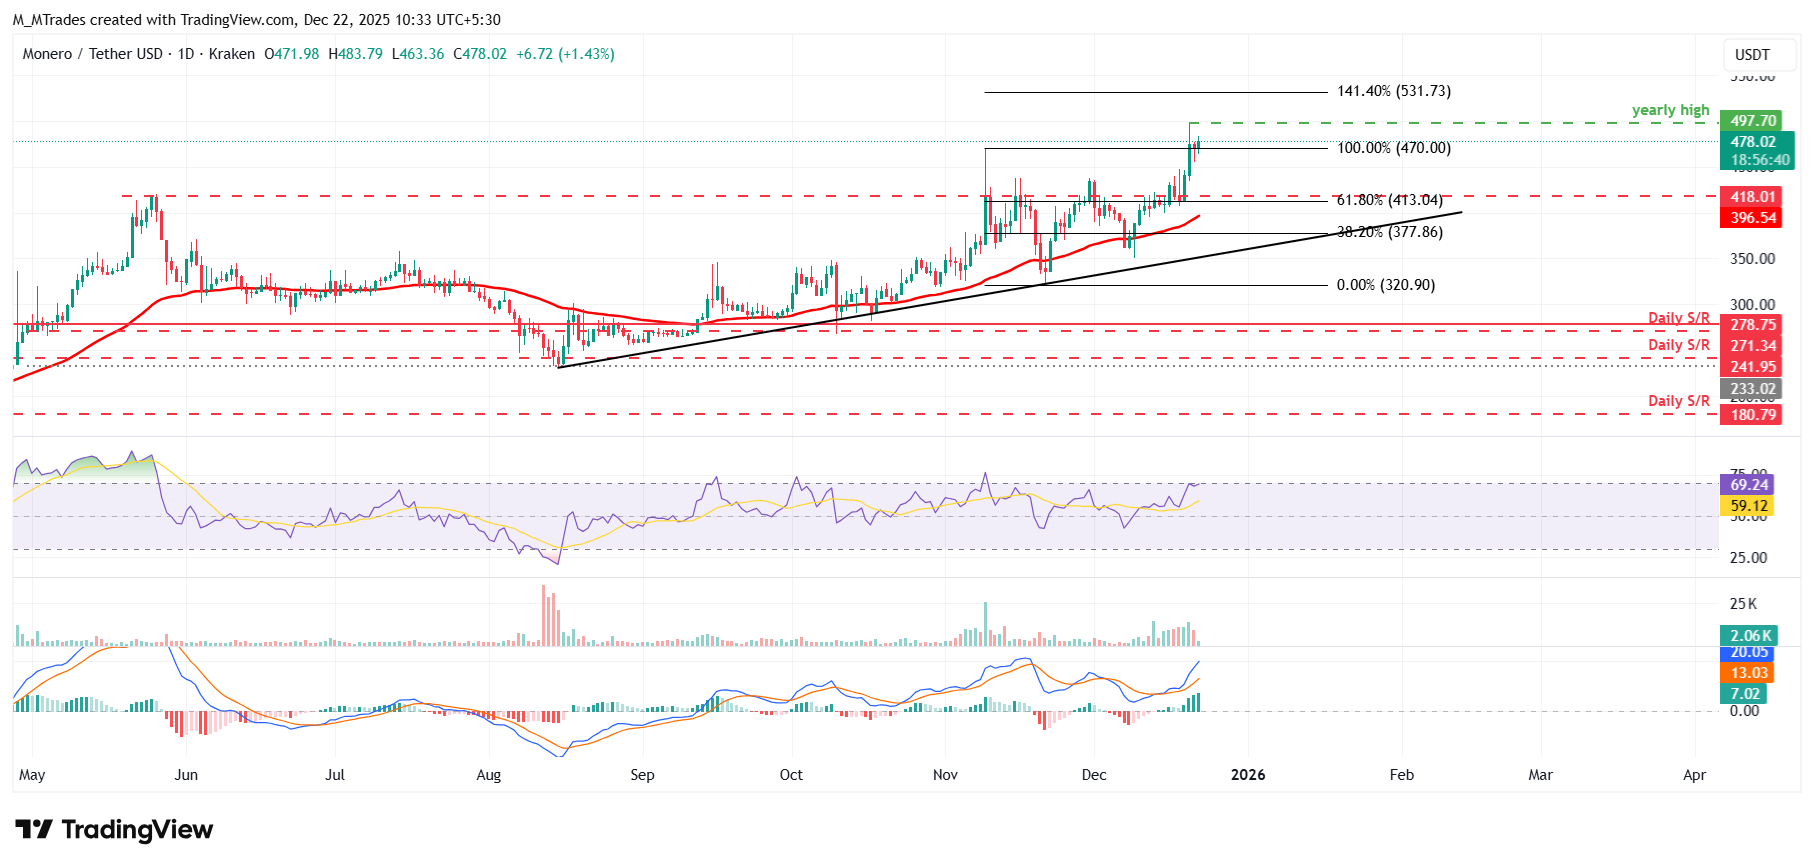
On the other hand, if XMR corrects, it could extend the decline toward the key support at $413.04.


