
Trade The World
OKB Price Forecast: Rising Open Interest fuels breakout rally optimism
By Vishal Dixit
Date Published: 4 Sep 2025 | Date Modified: 4 Sep 2025


POPULAR ARTICLES
OKB (OKB) erases part of the daily gains and trades below $180 at press time on Thursday. Still, the bounce back in OKB from the $165 support base prepares for a potential range breakout on the daily chart. The derivatives data point to increased optimism among traders, anticipating extended gains.
- OKB recovers within a consolidation range, with bulls anticipating a breakout rally.
- OKB Open Interest increases as demand among derivative traders grows.
- The technical outlook indicates a bullish bias, targeting $215 with the consolidation range breakout.
OKB (OKB) erases part of the daily gains and trades below $180 at press time on Thursday. Still, the bounce back in OKB from the $165 support base prepares for a potential range breakout on the daily chart. The derivatives data point to increased optimism among traders, anticipating extended gains.
Rising derivatives interest signals increased optimism
CoinGlass data shows that the OKB Open Interest (OI) has increased by 40% over the last 24 hours, reaching $29.10 million. The double-digit rise in OI reflects increased capital inflow as risk-on sentiment fuels OKB interest among traders.
Adding to the increased demand, the trading volume has surged to $38.36 million, from $14.92 million on Wednesday.
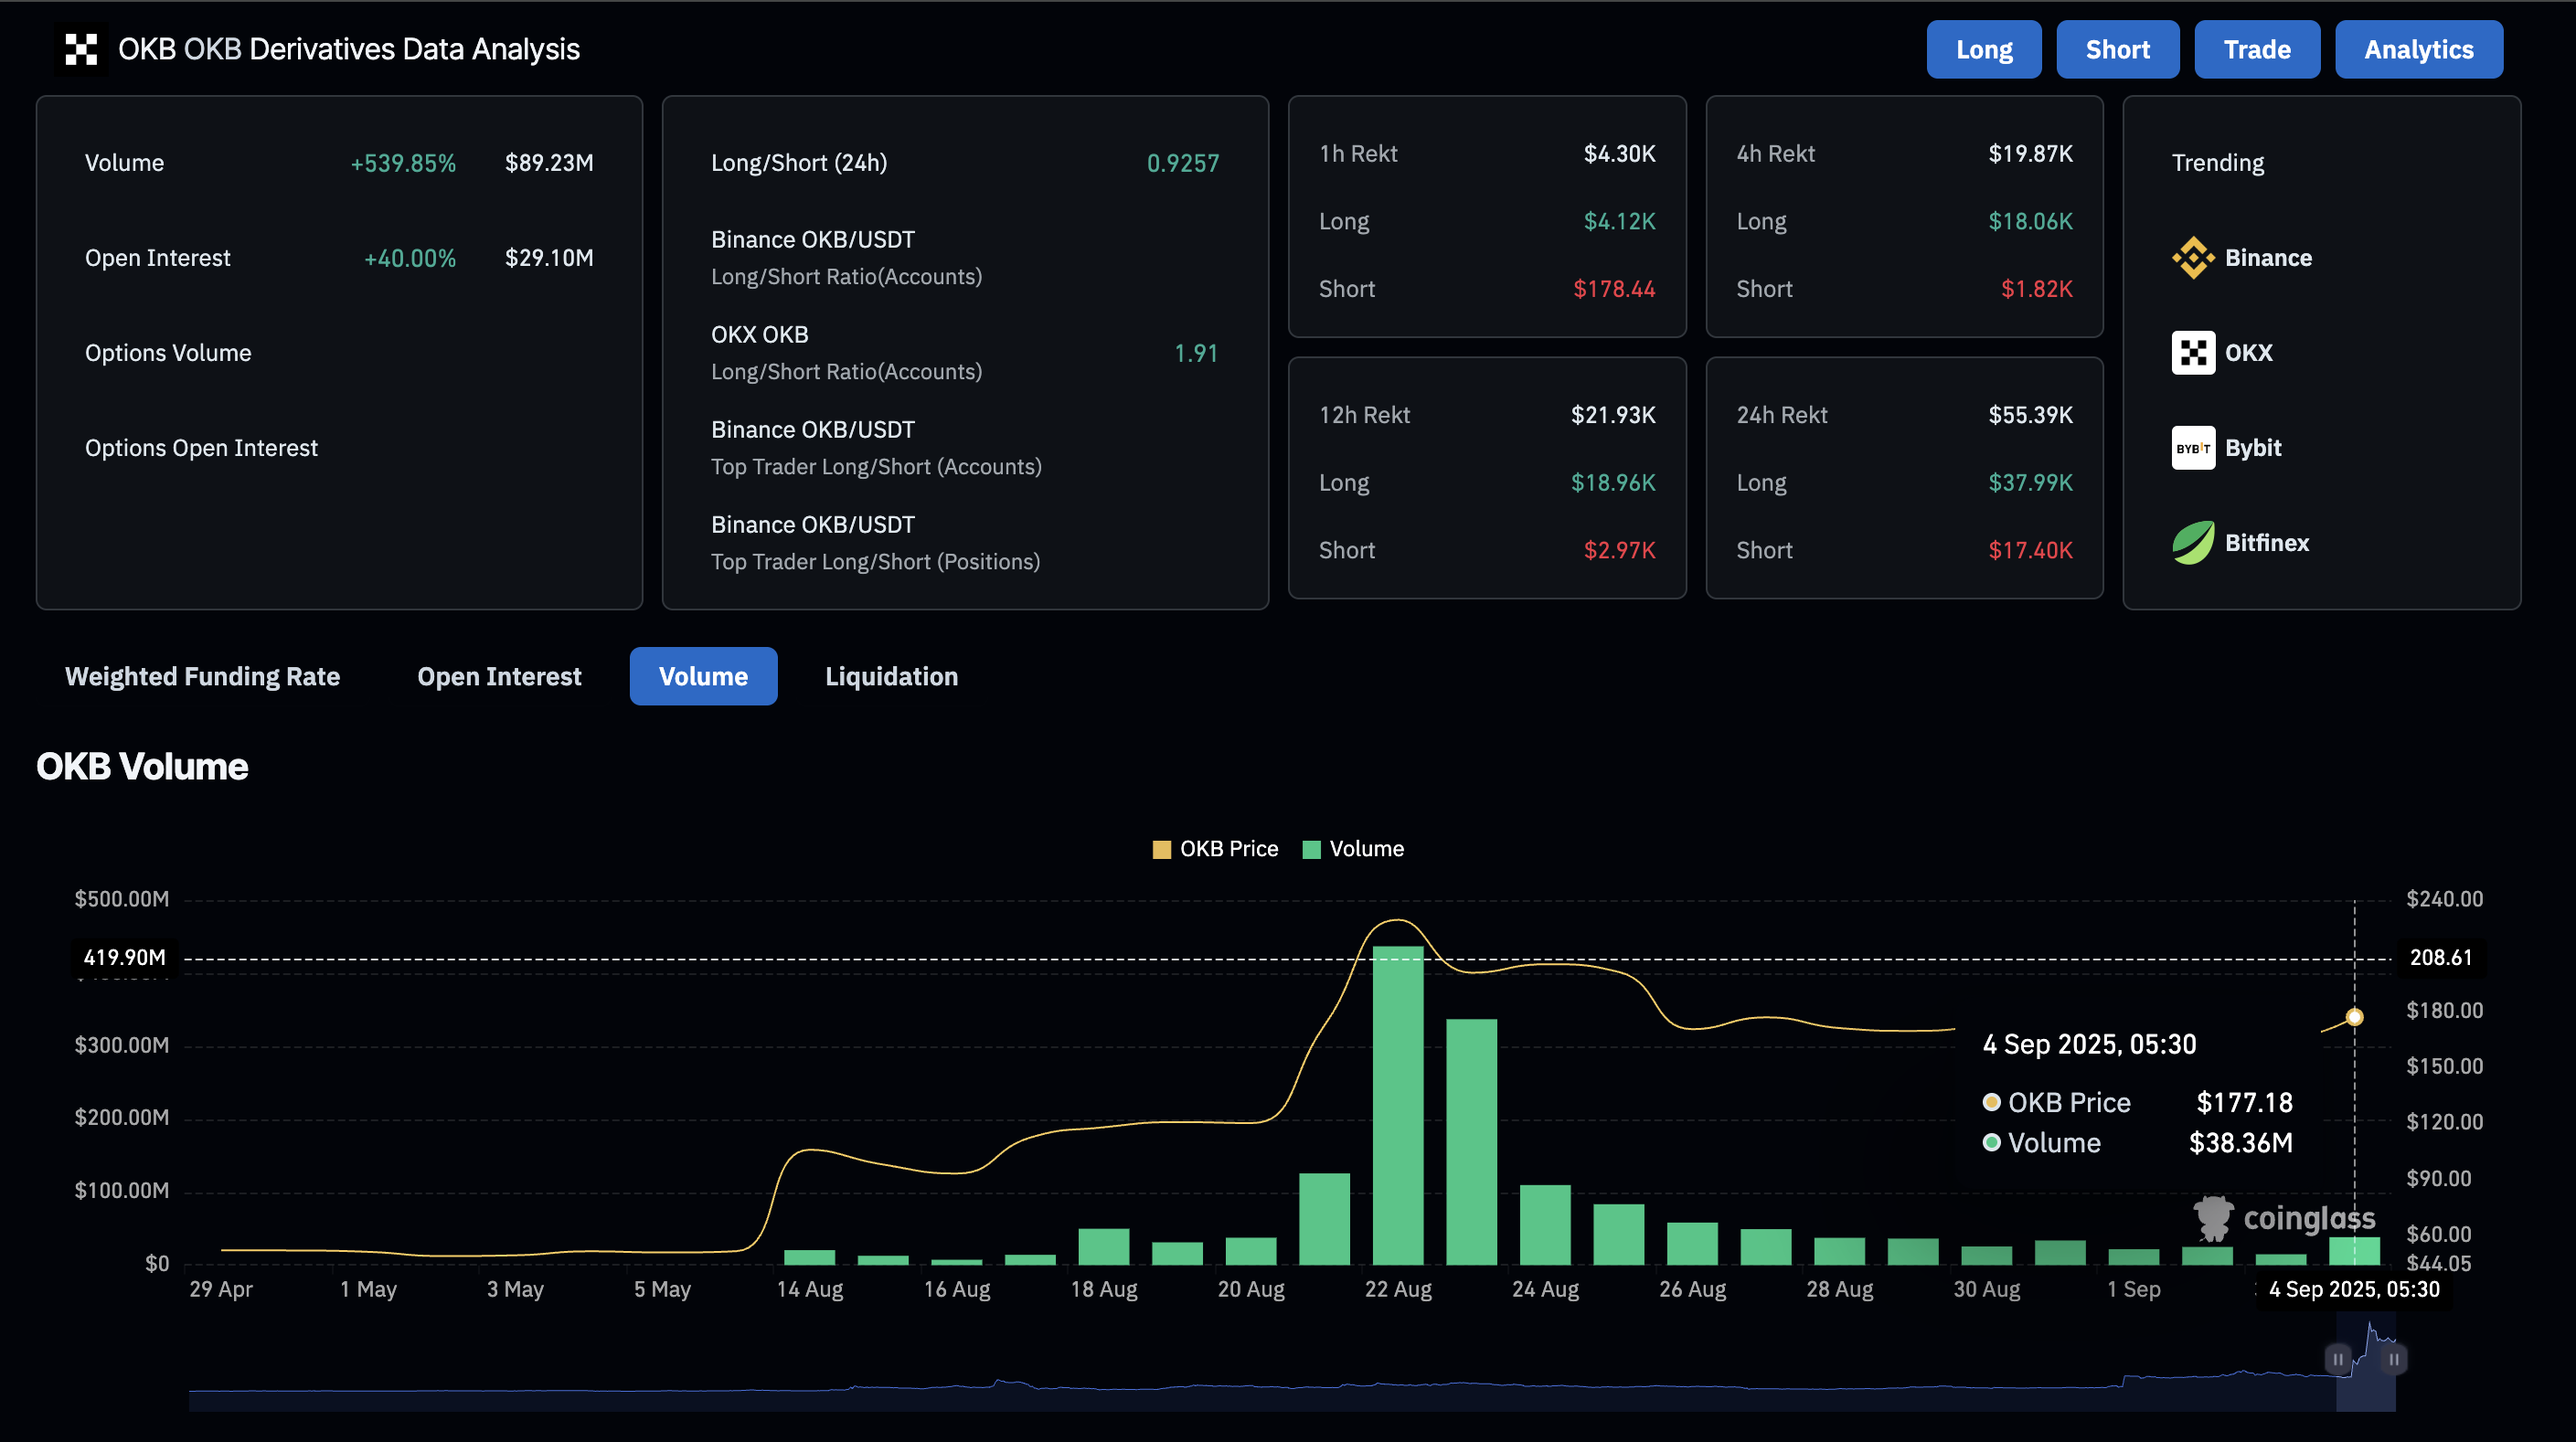
OKB derivatives. Source: Coinglass
OKB nears range breakout, targeting $215
OKB trades near the upper boundary of a consolidation range formed between $185 and $165 on the 4-hour chart. The rebound from the $165 baseline holds above the 50-period Exponential Moving Average (EMA) at $172.
The technical indicators on the same chart suggest elevated bullish momentum that could result in a range breakout. The Relative Strength Index (RSI) at 60 holds above the midline, indicating a bullish tilt with room for growth.
Additionally, the Moving Average Convergence Divergence (MACD) indicates increasing bullish momentum. Still, the declining intensity of green histogram bars reflects the struggle to uphold momentum at higher price levels.
On the upside, a clean push above the $185 resistance could extend the rally to the $215 level, marked by the August 24 high.
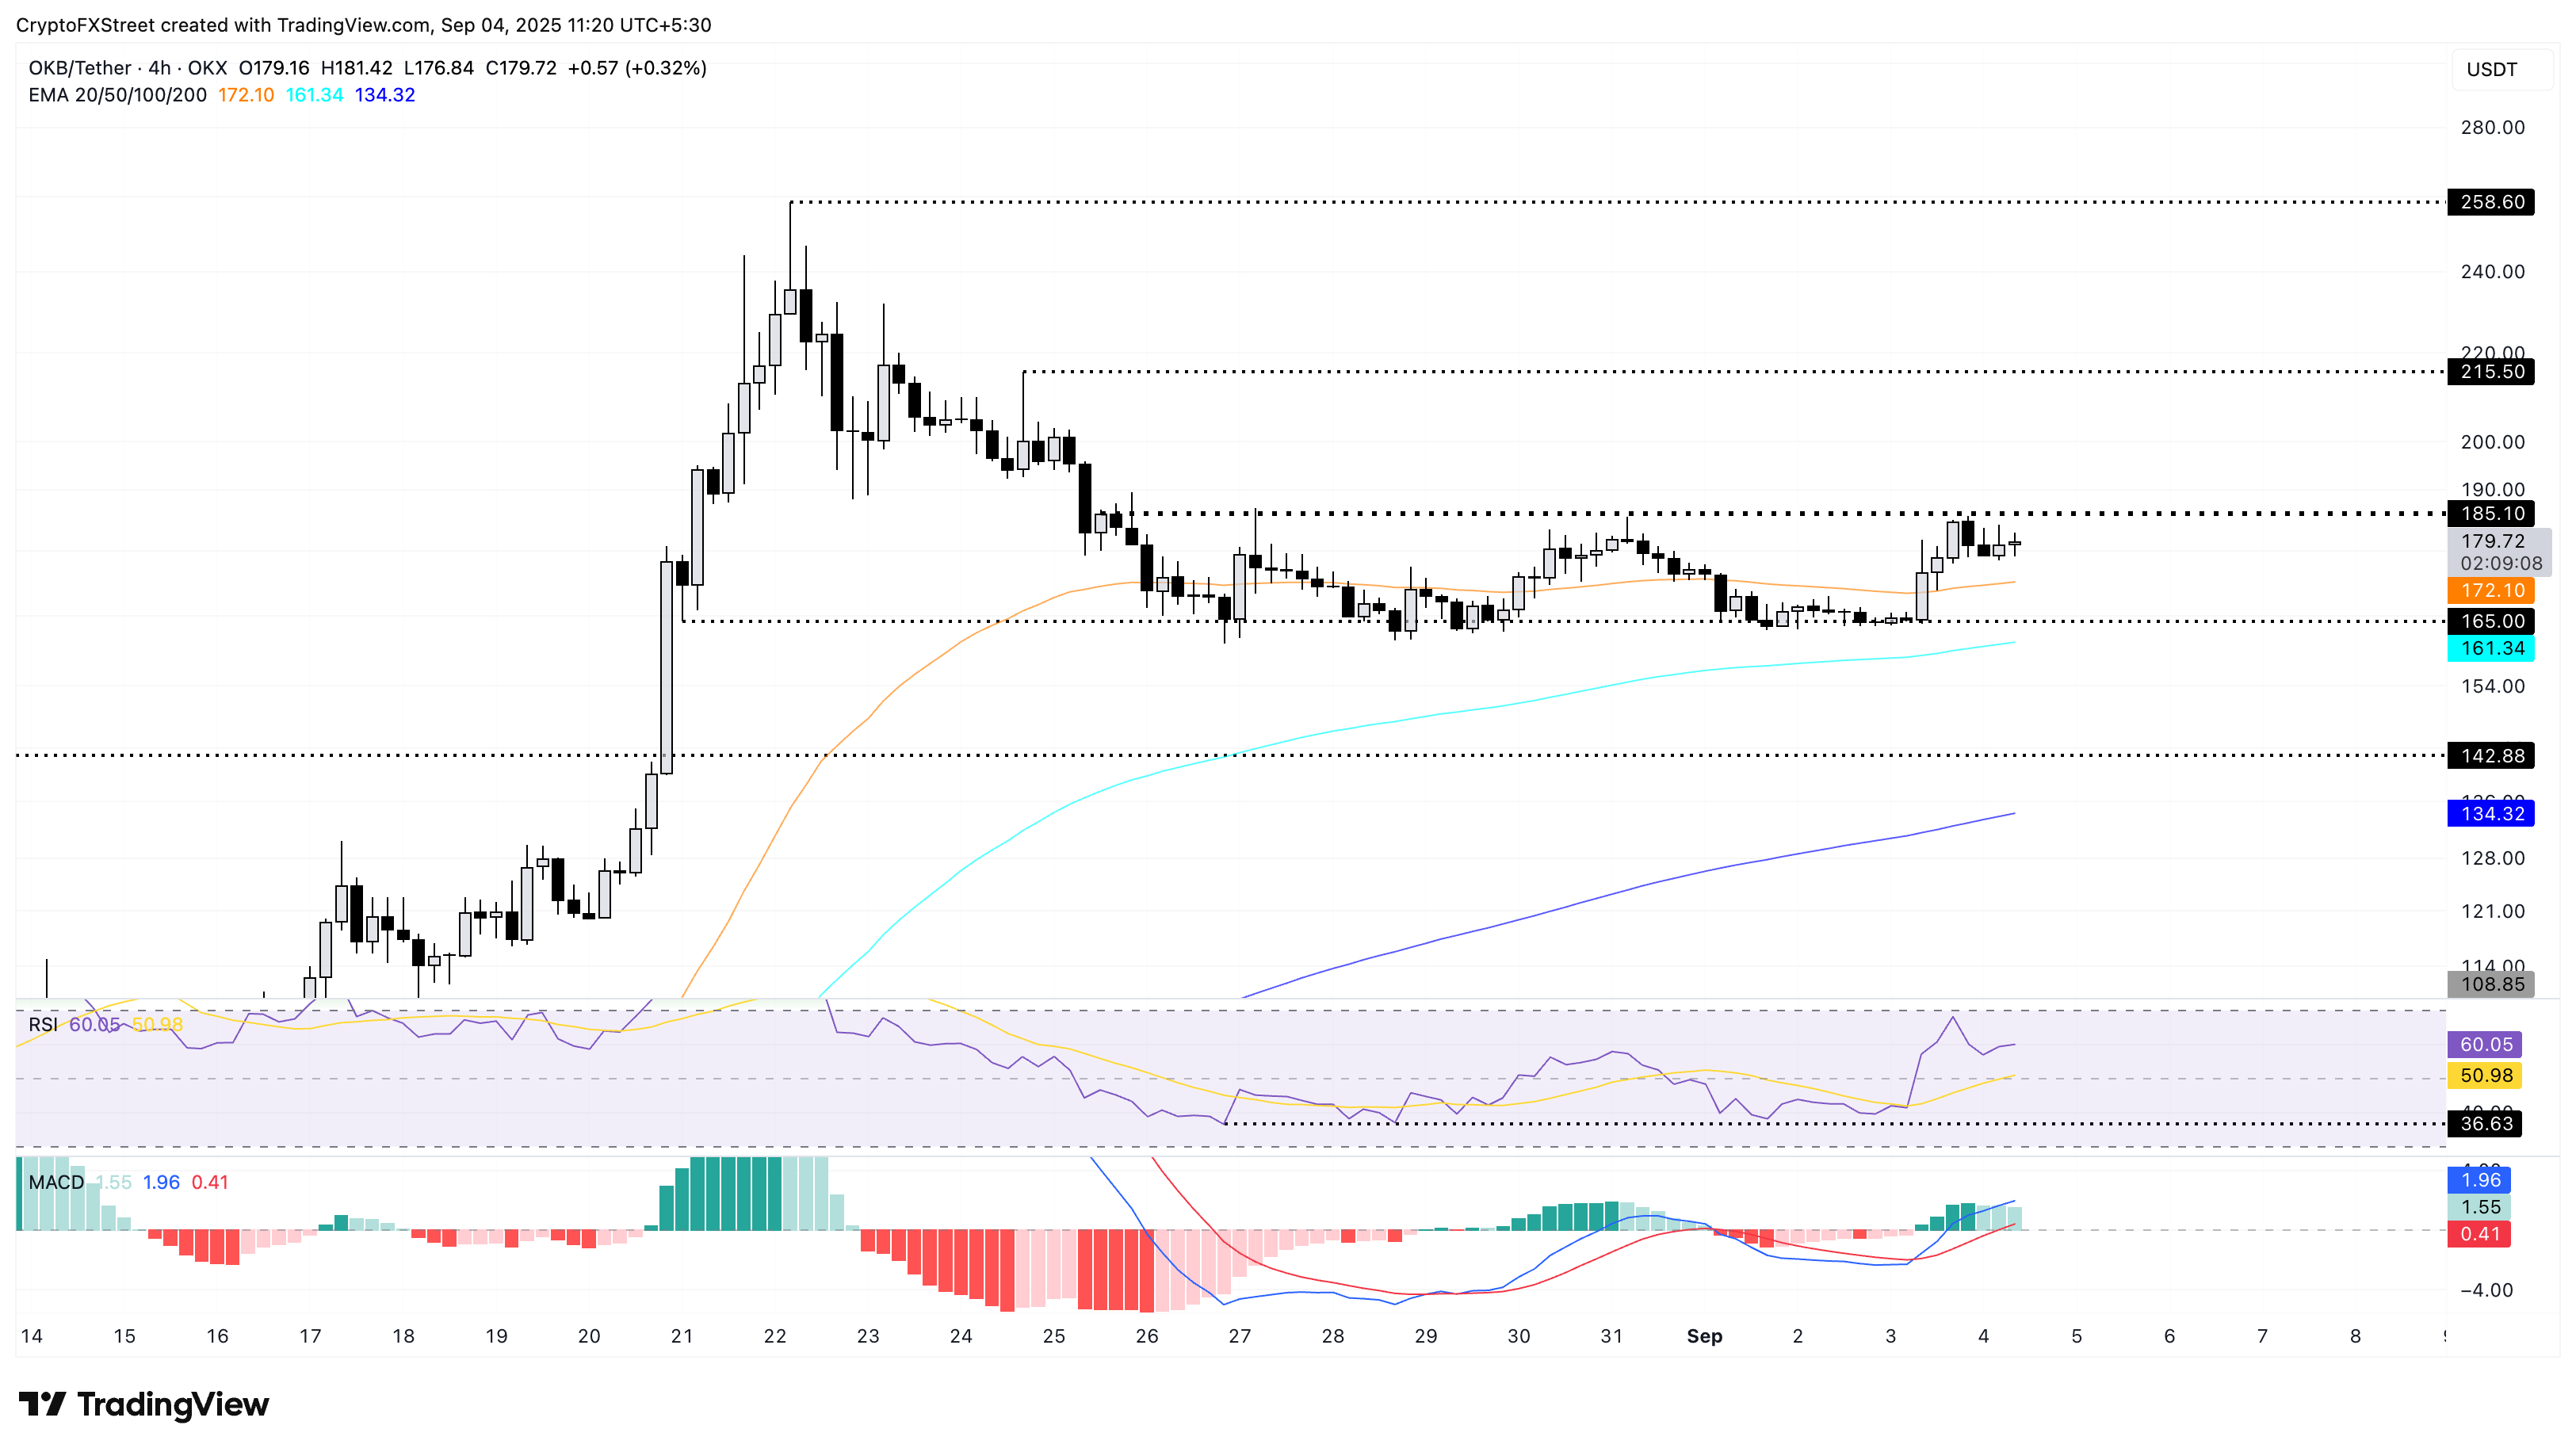
OKB/USDT daily chart.
However, a reversal from $185 could retest the support floor at $165. In case of an extended correction, the OKB token could drop to the $142 support level.

FXStreet
More than a million users rely on FXStreet for real-time market data, charting tools, expert insights, and forex news. Its comprehensive economic calendar and educational webinars help traders stay informed and make calculated decisions. FXStreet is supported by a team of about 60 professionals, split between the Barcelona headquarters and various global regions.
Read More


