


- Pi Network holds above $0.20 but struggles to surpass the 50-period EMA on the 4-hour chart.
- A large wallet investor offloaded over 1 million PI tokens in the last 24 hours, suggesting reduced confidence among investors.
- The technical outlook remains mixed, as PI struggles to clear a dynamic resistance level.
Pi Network (PI) holds steady above the $0.2000 psychological level after breaking out above a descending channel pattern on the 4-hour chart. However, the investors' confidence continues to decline as PiScan data reveals a large wallet investor, commonly referred to as a whale, deposited over 1 million on an exchange. The technical outlook for PI remains mixed as PI struggles to extend its recovery.
Whale offloads over 1 million PI tokens
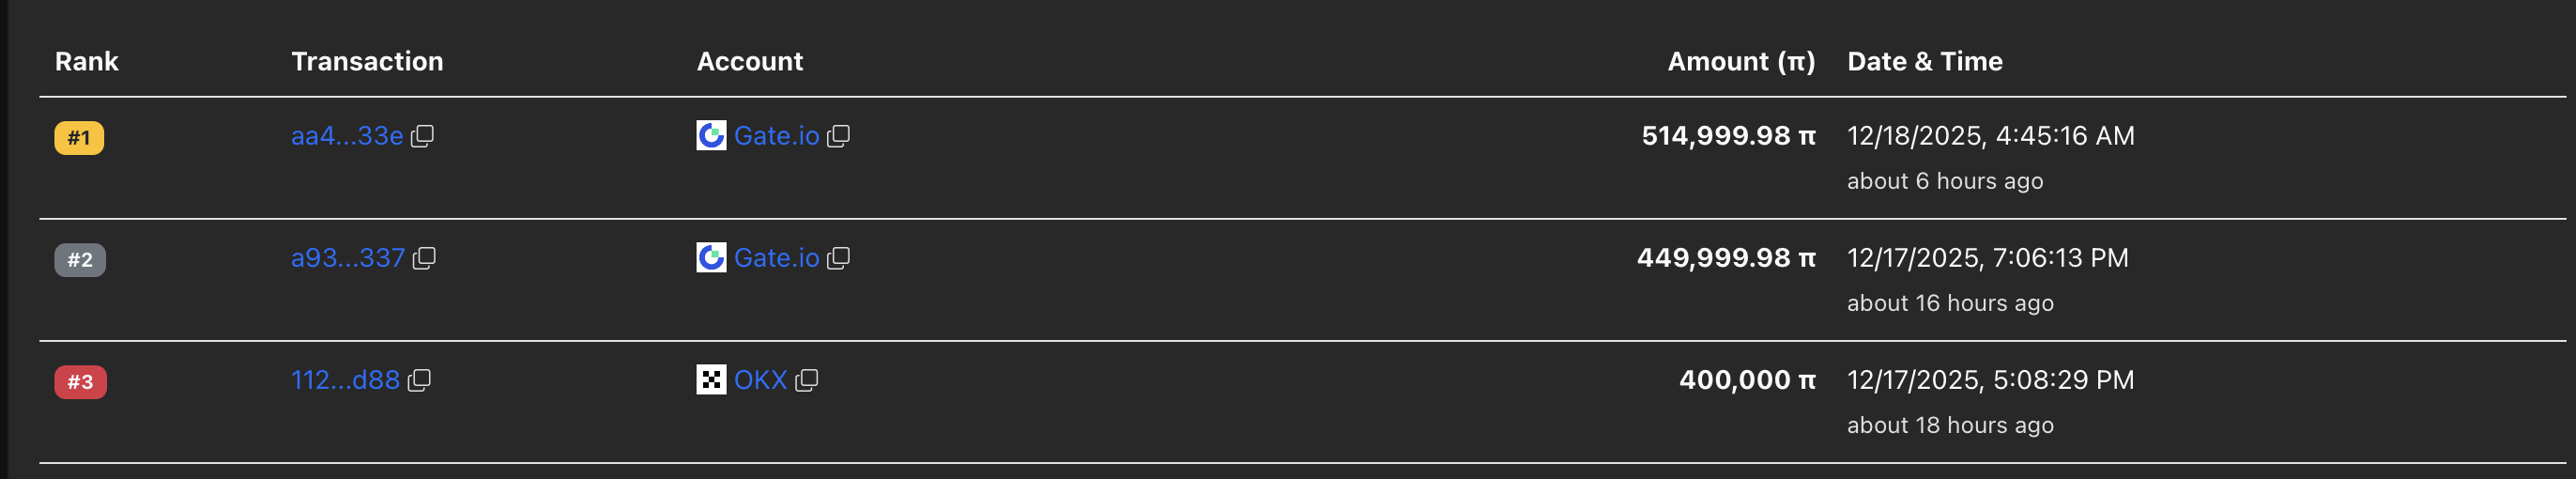
PiScan data shows a whale deposited over 1 million PI tokens on Gate.io exchange in two transactions over the last 24 hours. Typically, such large deposits on exchanges add to selling pressure and reflect a lack of investor confidence. Still, the investor is left with 7.9 million PI tokens, which could indicate a strategic sell-off to reduce risk.
Pi Network’s recovery stalls near the 50-period EMA
Pi Network struggles to clear the 50-period Exponential Moving Average (EMA) on the 4-hour chart at $0.2065 after surpassing a resistance trendline connecting the November 30 and December 6 highs. Additionally, the Supertrend indicator line is near the 50-period EMA, and a close above the moving average would confirm a bullish trend and trigger a buy signal.
If PI secures a close above $0.2065, it could extend the uptrend to the resistance zone between the R1 Pivot Point at $0.2179 and the 200-period EMA at $0.2221.
The technical indicators on the 4-hour chart indicate that the selling pressure has significantly reduced. The Relative Strength Index (RSI) at 50 fluctuates above the halfway line while the Moving Average Convergence Divergence (MACD) indicator steadies an upward trend toward the zero line.
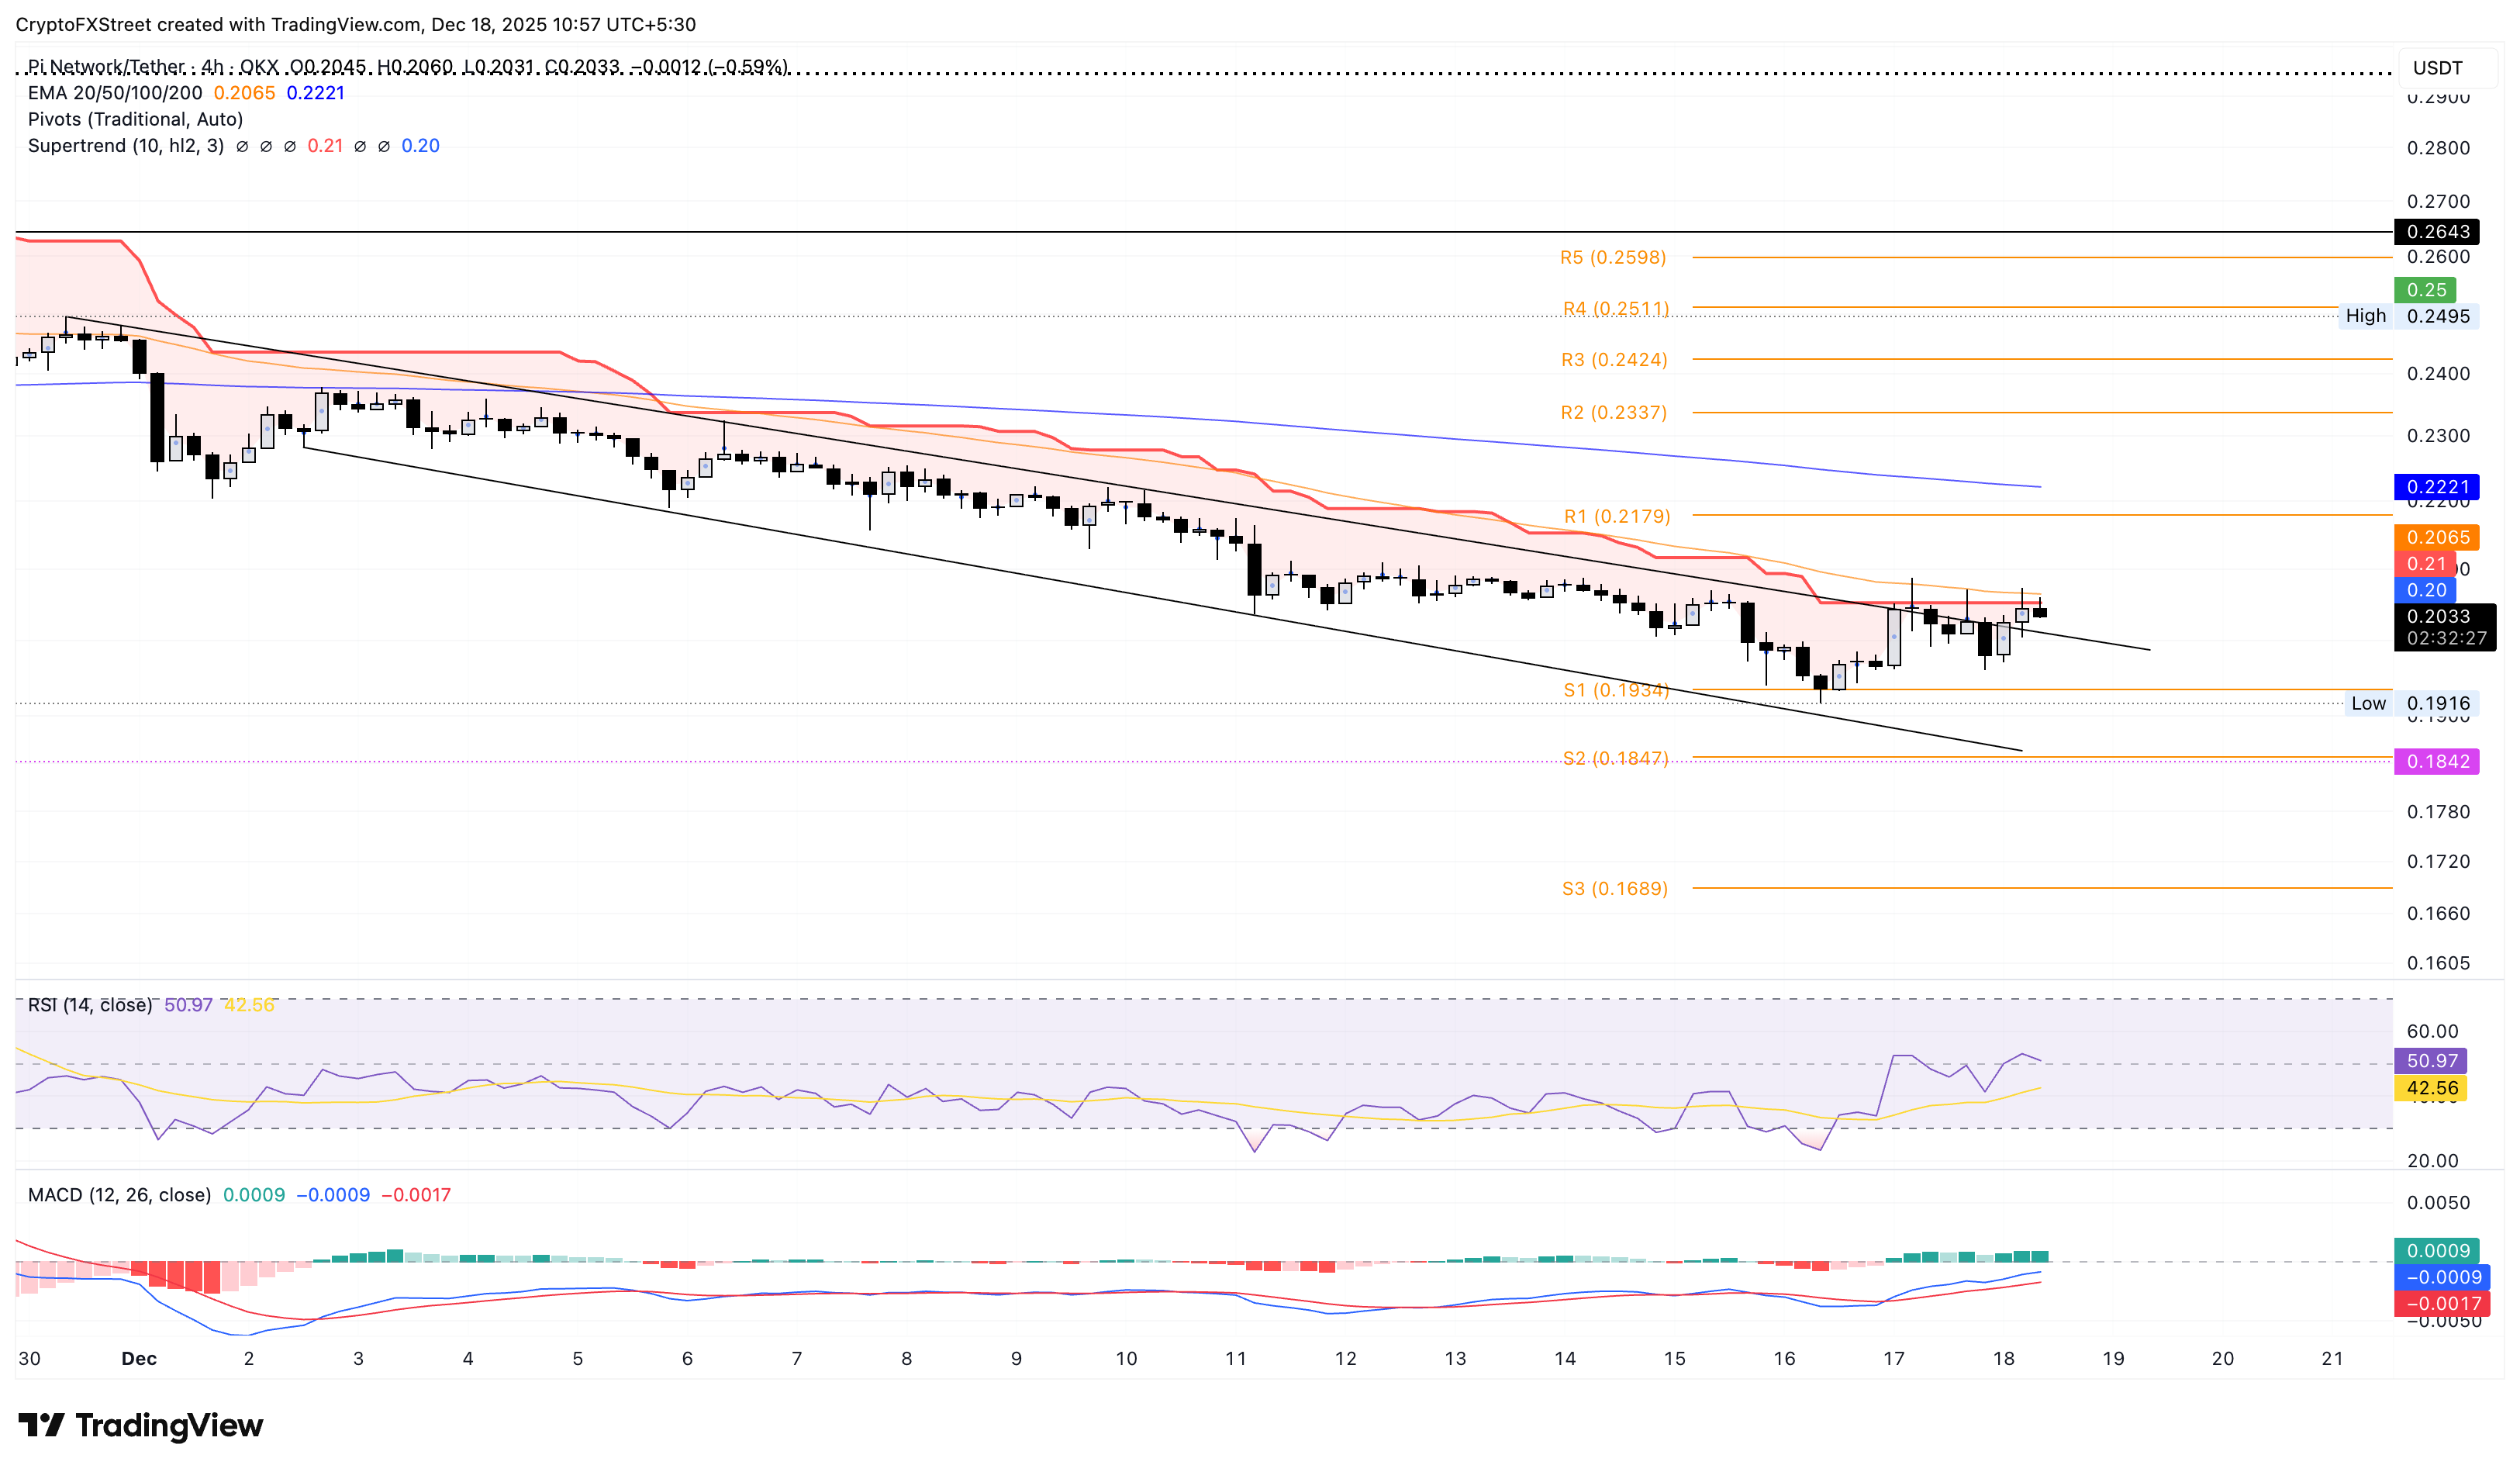
Looking down, if PI reverses below $0.2000, it could retest the S1 Pivot Point at $0.1934, followed by the S2 Pivot Point at $0.1847.
Cryptocurrency metrics FAQs
The developer or creator of each cryptocurrency decides on the total number of tokens that can be minted or issued. Only a certain number of these assets can be minted by mining, staking or other mechanisms. This is defined by the algorithm of the underlying blockchain technology. On the other hand, circulating supply can also be decreased via actions such as burning tokens, or mistakenly sending assets to addresses of other incompatible blockchains.
Market capitalization is the result of multiplying the circulating supply of a certain asset by the asset’s current market value.
Trading volume refers to the total number of tokens for a specific asset that has been transacted or exchanged between buyers and sellers within set trading hours, for example, 24 hours. It is used to gauge market sentiment, this metric combines all volumes on centralized exchanges and decentralized exchanges. Increasing trading volume often denotes the demand for a certain asset as more people are buying and selling the cryptocurrency.
Funding rates are a concept designed to encourage traders to take positions and ensure perpetual contract prices match spot markets. It defines a mechanism by exchanges to ensure that future prices and index prices periodic payments regularly converge. When the funding rate is positive, the price of the perpetual contract is higher than the mark price. This means traders who are bullish and have opened long positions pay traders who are in short positions. On the other hand, a negative funding rate means perpetual prices are below the mark price, and hence traders with short positions pay traders who have opened long positions.


