
XRP slides below 50-day EMA as selling pressure intensifies
By John Isige
Date Published: 16 Jan 2026 | Date Modified: 16 Jan 2026


POPULAR ARTICLES

Ripple (XRP) is edging lower toward the pivotal $2.00 level at the time of writing on Friday, marking three consecutive days of declines. The sell-off extends across the crypto market, with Bitcoin (BTC) falling toward $95,000 and Ethereum (ETH) pressing down on support at $3,300.
- XRP extends losses below the 50-day EMA amid a potential return to risk-off sentiment in the broader crypto market.
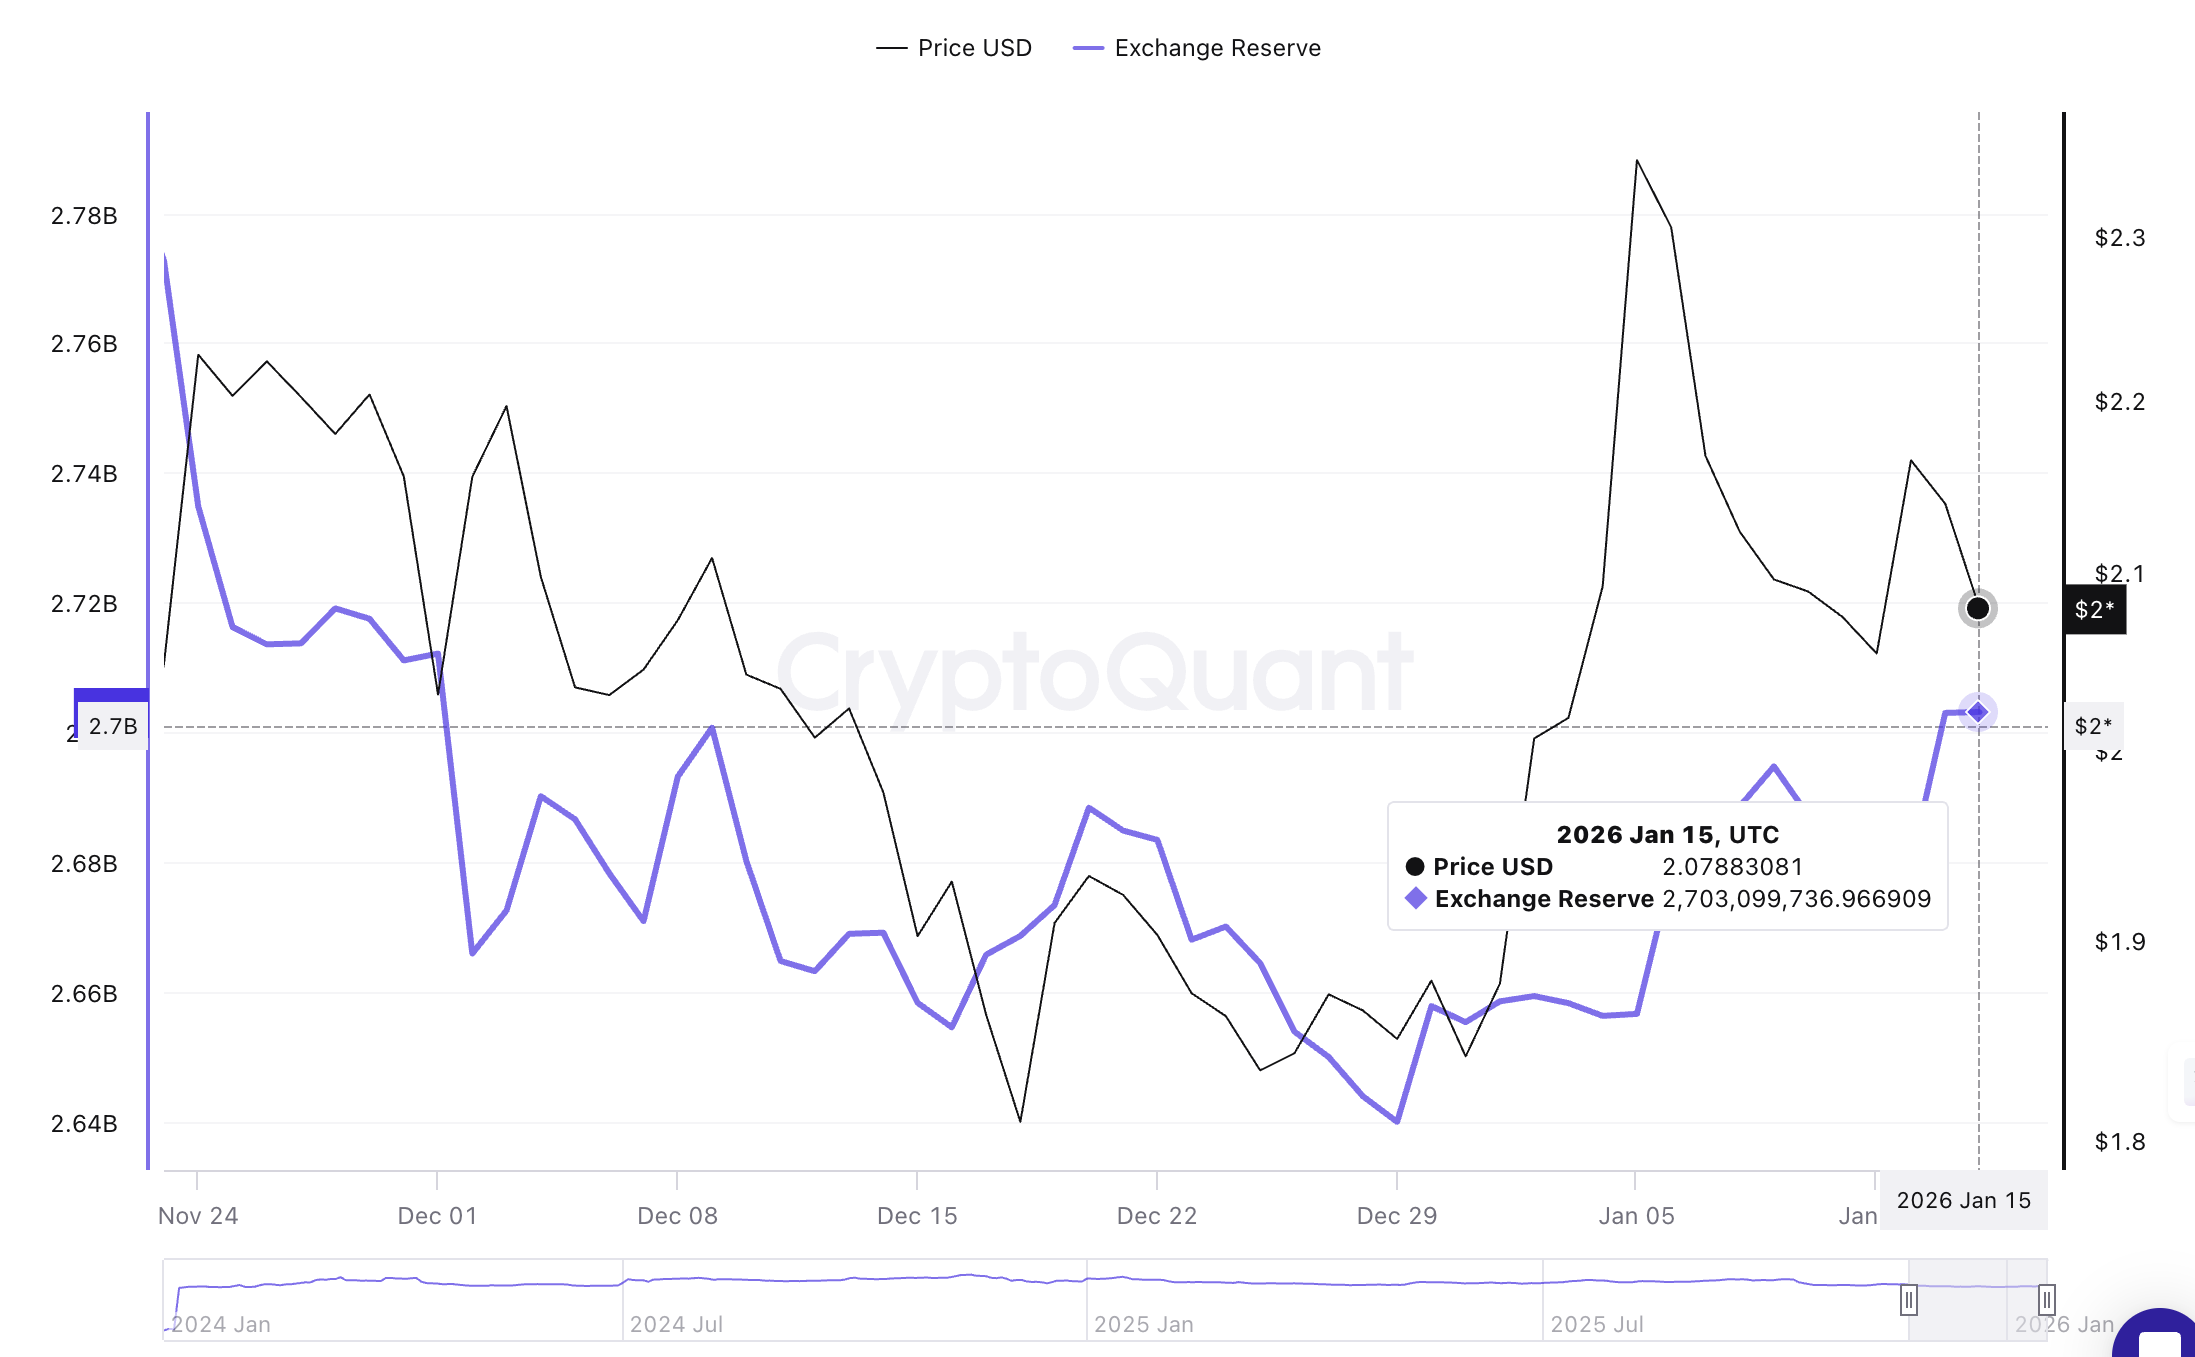
- XRP exchange reserves have grown to 2.7 billion tokens, indicating increased selling pressure.
- Steady demand for spot XRP ETFs fails to strengthen the short-term recovery outlook.
Ripple (XRP) is edging lower toward the pivotal $2.00 level at the time of writing on Friday, marking three consecutive days of declines. The sell-off extends across the crypto market, with Bitcoin (BTC) falling toward $95,000 and Ethereum (ETH) pressing down on support at $3,300.
XRP under pressure as exchange reserves surge
The number of XRP coins held across exchanges has increased to 2.7 billion as of Thursday, from 2.67 billion on Monday. Looking back, XRP exchange reserves stood at 2.64 billion on December 29, suggesting holders are transferring the tokens with the intention of selling when the price rises.
According to CryptoQuant, rising exchange reserves indicate higher selling pressure, which could pose an increased risk to price recovery.
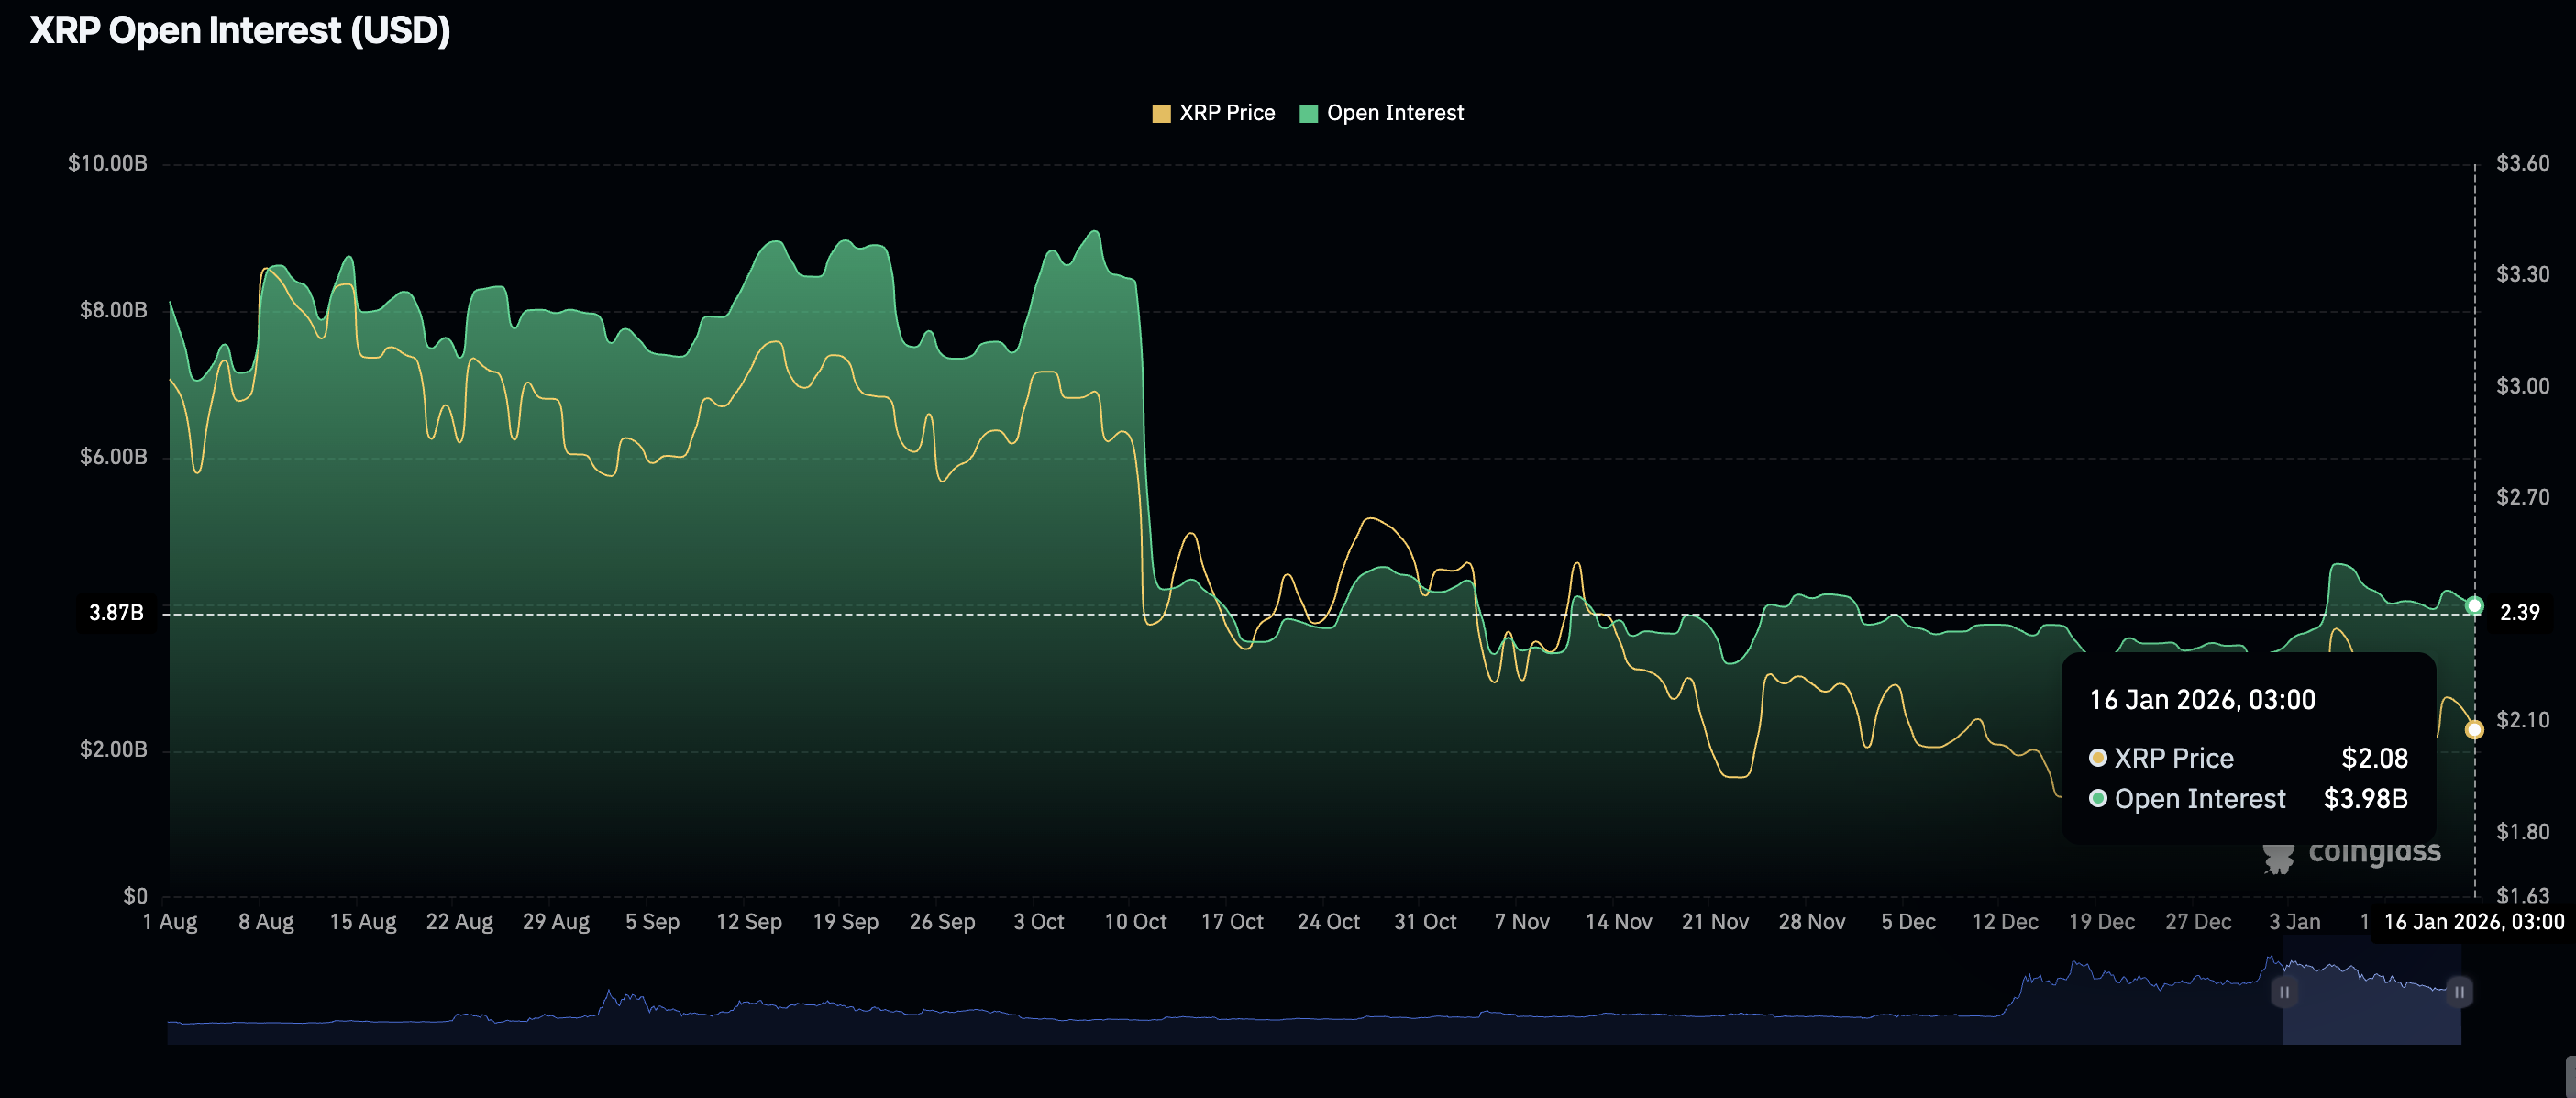
Meanwhile, demand for XRP derivatives has remained weak, falling to $3.98 billion on Friday from $4.08 billion the previous day. The OI peaked at a yearly high of $4.55 billion on January 8, a move that happened a couple of days after XRP rose to $2.42. Further decline in the OI could drive the prices lower.
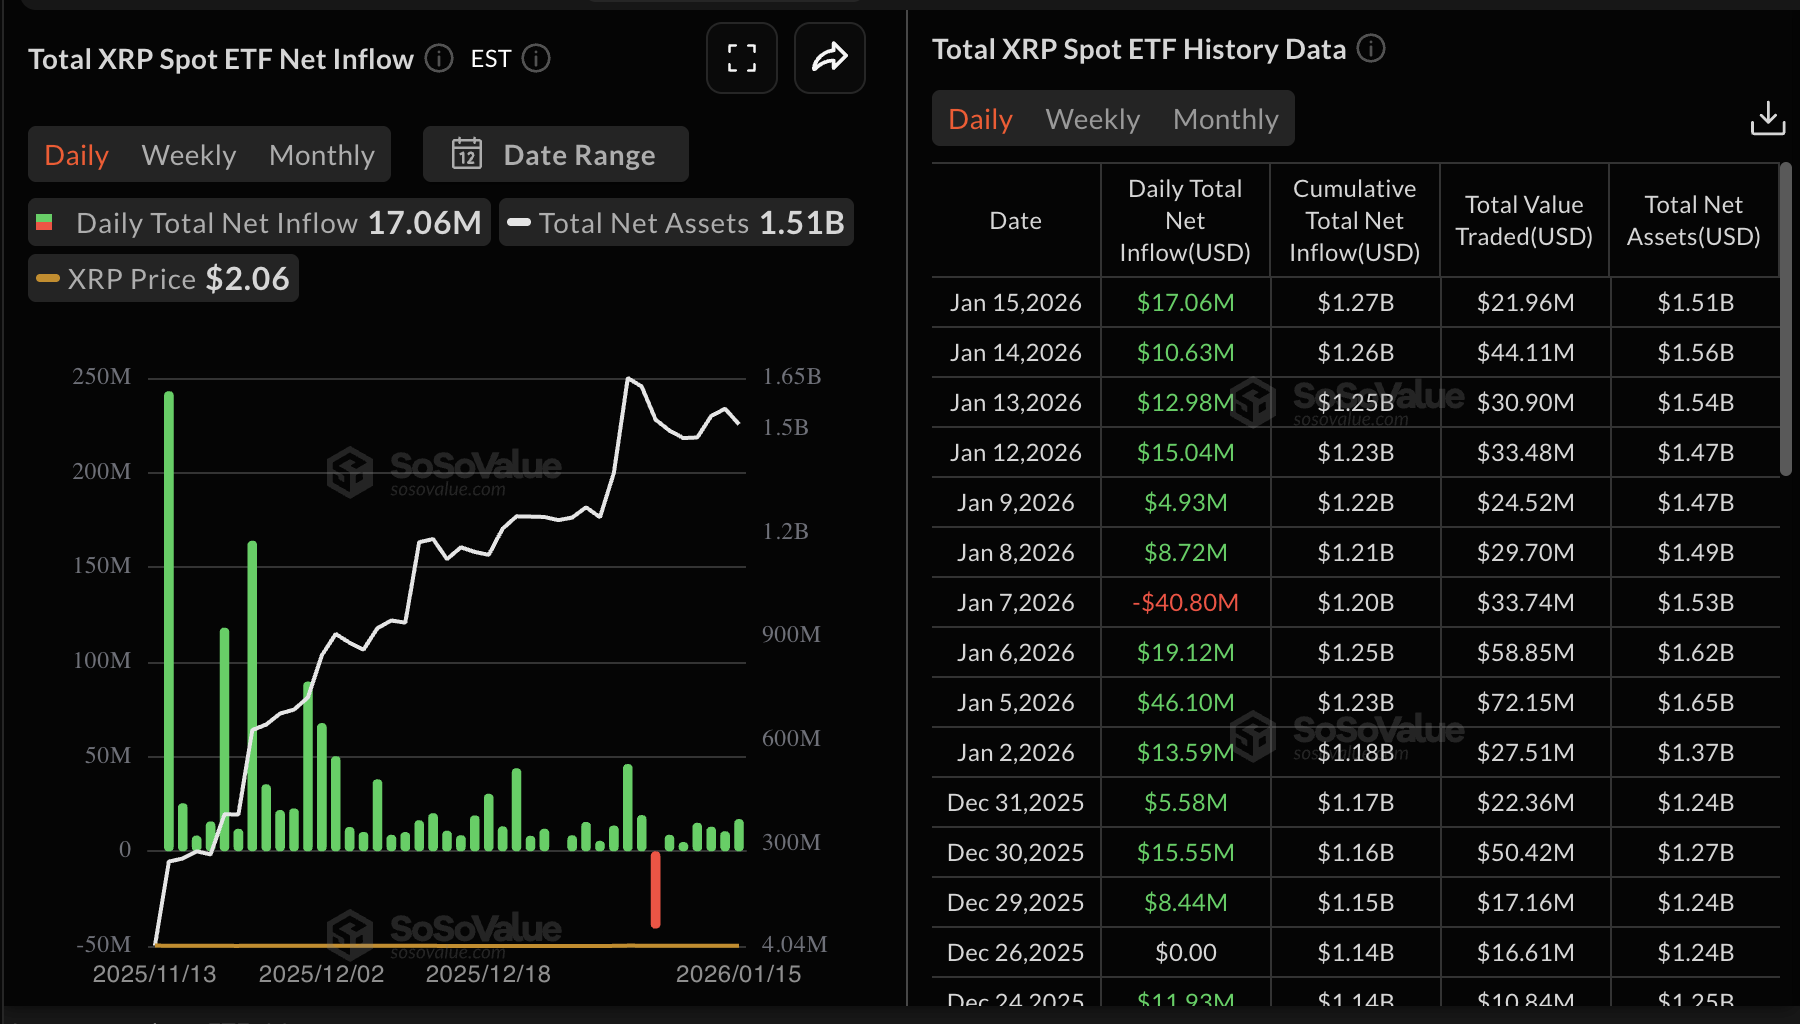
Despite the three-day price correction, institutional sentiment remains relatively positive, as reflected in steady inflows into XRP spot Exchange Traded Funds (ETFs).
US-listed XRP ETFs recorded approximately almost $17 million in inflows on Thursday, up from almost $11 million on Wednesday, according to SoSoValue data. The cumulative inflow stands at $1.27 billion, and the net assets at $1.51 billion, indicating steady investor confidence.
Technical outlook: XRP decline persists as $2.00 support holds
XRP is trading at $2.06 at the time of writing on Friday, as headwinds weigh on the cross-border money remittance token. The 50-day Exponential Moving Average (EMA) at $2.08 caps the immediate upside, preserving the bearish bias.
The Moving Average Convergence Divergence (MACD) has crossed below the signal line on the daily chart, while the histogram bars have turned negative, suggesting downward pressure is building. Bearish influence is poised to increase if the Relative Strength Index (RSI) at 50 on the same chart extends its decline below the midline.
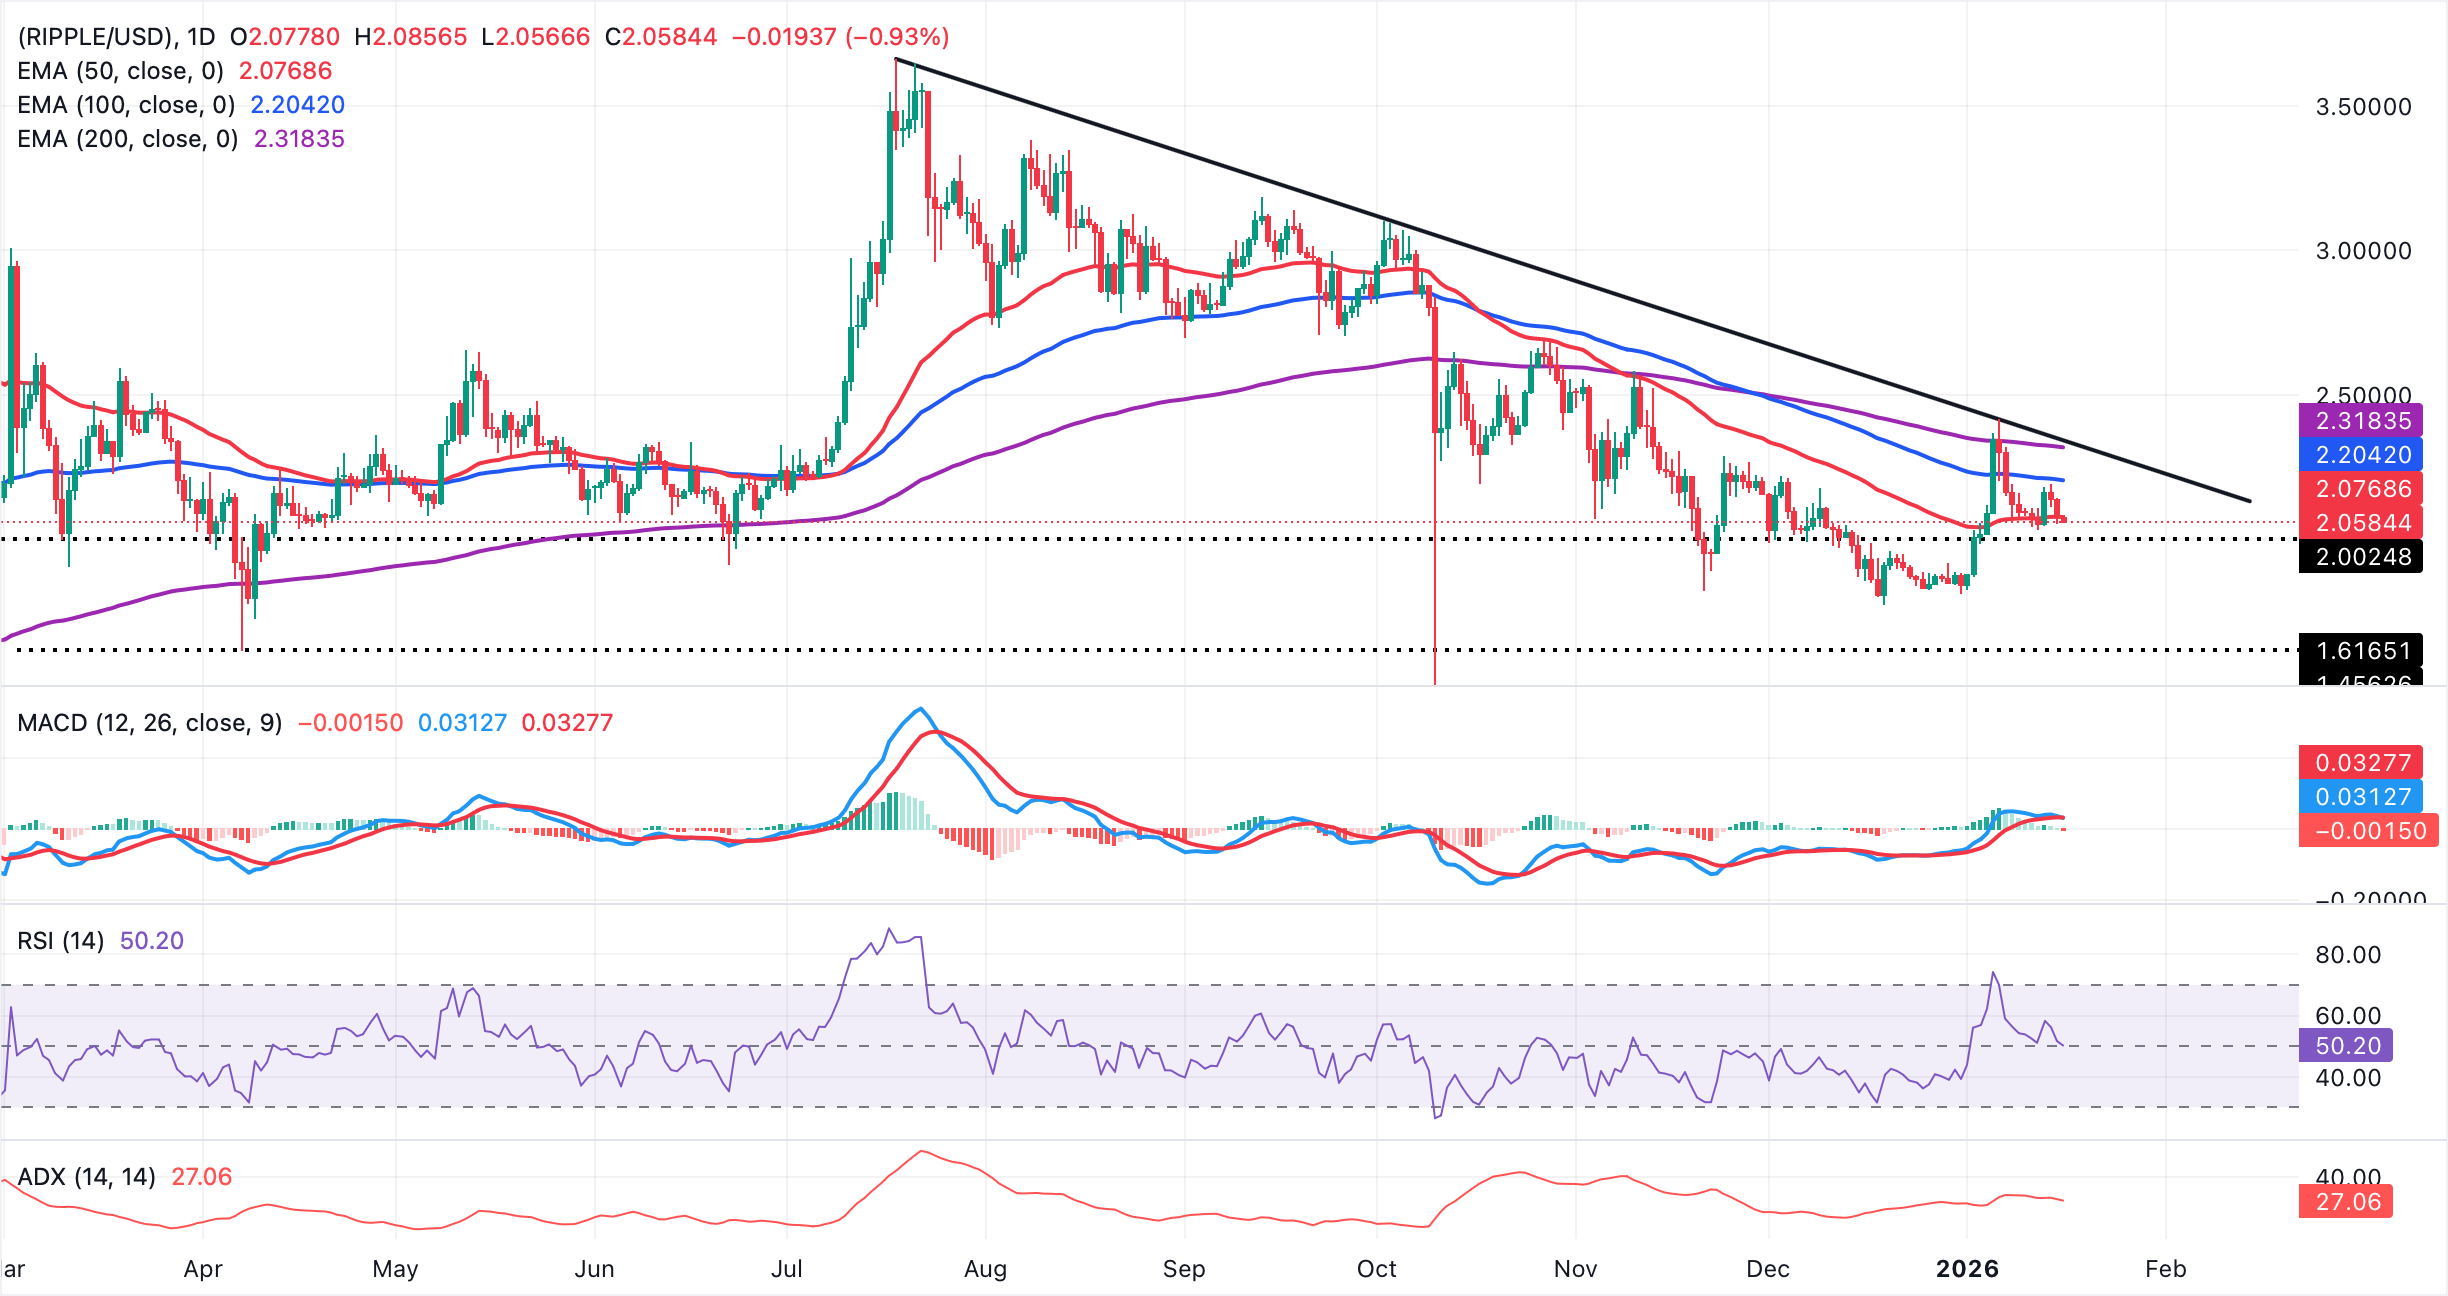
However, closing above the 50-day EMA at $2.08 would ease immediate pressure and open room toward the 100-day EMA at $2.20 and the 200-day EMA at $2.32. Failure to reclaim these barriers keeps the path of least resistance downward.
Cryptocurrency metrics FAQs
The developer or creator of each cryptocurrency decides on the total number of tokens that can be minted or issued. Only a certain number of these assets can be minted by mining, staking or other mechanisms. This is defined by the algorithm of the underlying blockchain technology. On the other hand, circulating supply can also be decreased via actions such as burning tokens, or mistakenly sending assets to addresses of other incompatible blockchains.
Market capitalization is the result of multiplying the circulating supply of a certain asset by the asset’s current market value.
Trading volume refers to the total number of tokens for a specific asset that has been transacted or exchanged between buyers and sellers within set trading hours, for example, 24 hours. It is used to gauge market sentiment, this metric combines all volumes on centralized exchanges and decentralized exchanges. Increasing trading volume often denotes the demand for a certain asset as more people are buying and selling the cryptocurrency.
Funding rates are a concept designed to encourage traders to take positions and ensure perpetual contract prices match spot markets. It defines a mechanism by exchanges to ensure that future prices and index prices periodic payments regularly converge. When the funding rate is positive, the price of the perpetual contract is higher than the mark price. This means traders who are bullish and have opened long positions pay traders who are in short positions. On the other hand, a negative funding rate means perpetual prices are below the mark price, and hence traders with short positions pay traders who have opened long positions.
(The technical analysis of this story was written with the help of an AI tool.)

More than a million users rely on FXStreet for real-time market data, charting tools, expert insights, and forex news. Its comprehensive economic calendar and educational webinars help traders stay informed and make calculated decisions. FXStreet is supported by a team of about 60 professionals, split between the Barcelona headquarters and various global regions.
Read More


