
Solana Price Forecast: Rising demand in SOL ETFs and derivatives boosts bullish rebound
By Vishal Dixit
Date Published: 3 Dec 2025 | Date Modified: 3 Dec 2025


POPULAR ARTICLES

Solana (SOL) trades above $140 by press time on Wednesday, up over 10% in the last 24 hours as Vanguard offers crypto Exchange Traded Funds (ETFs), including Solana ETFs. The sudden recovery boosts risk-on sentiment in Solana derivatives as investors anticipate further gains.
- Solana extends the 9% recovery from Tuesday, aiming for the 50-day EMA at $157.
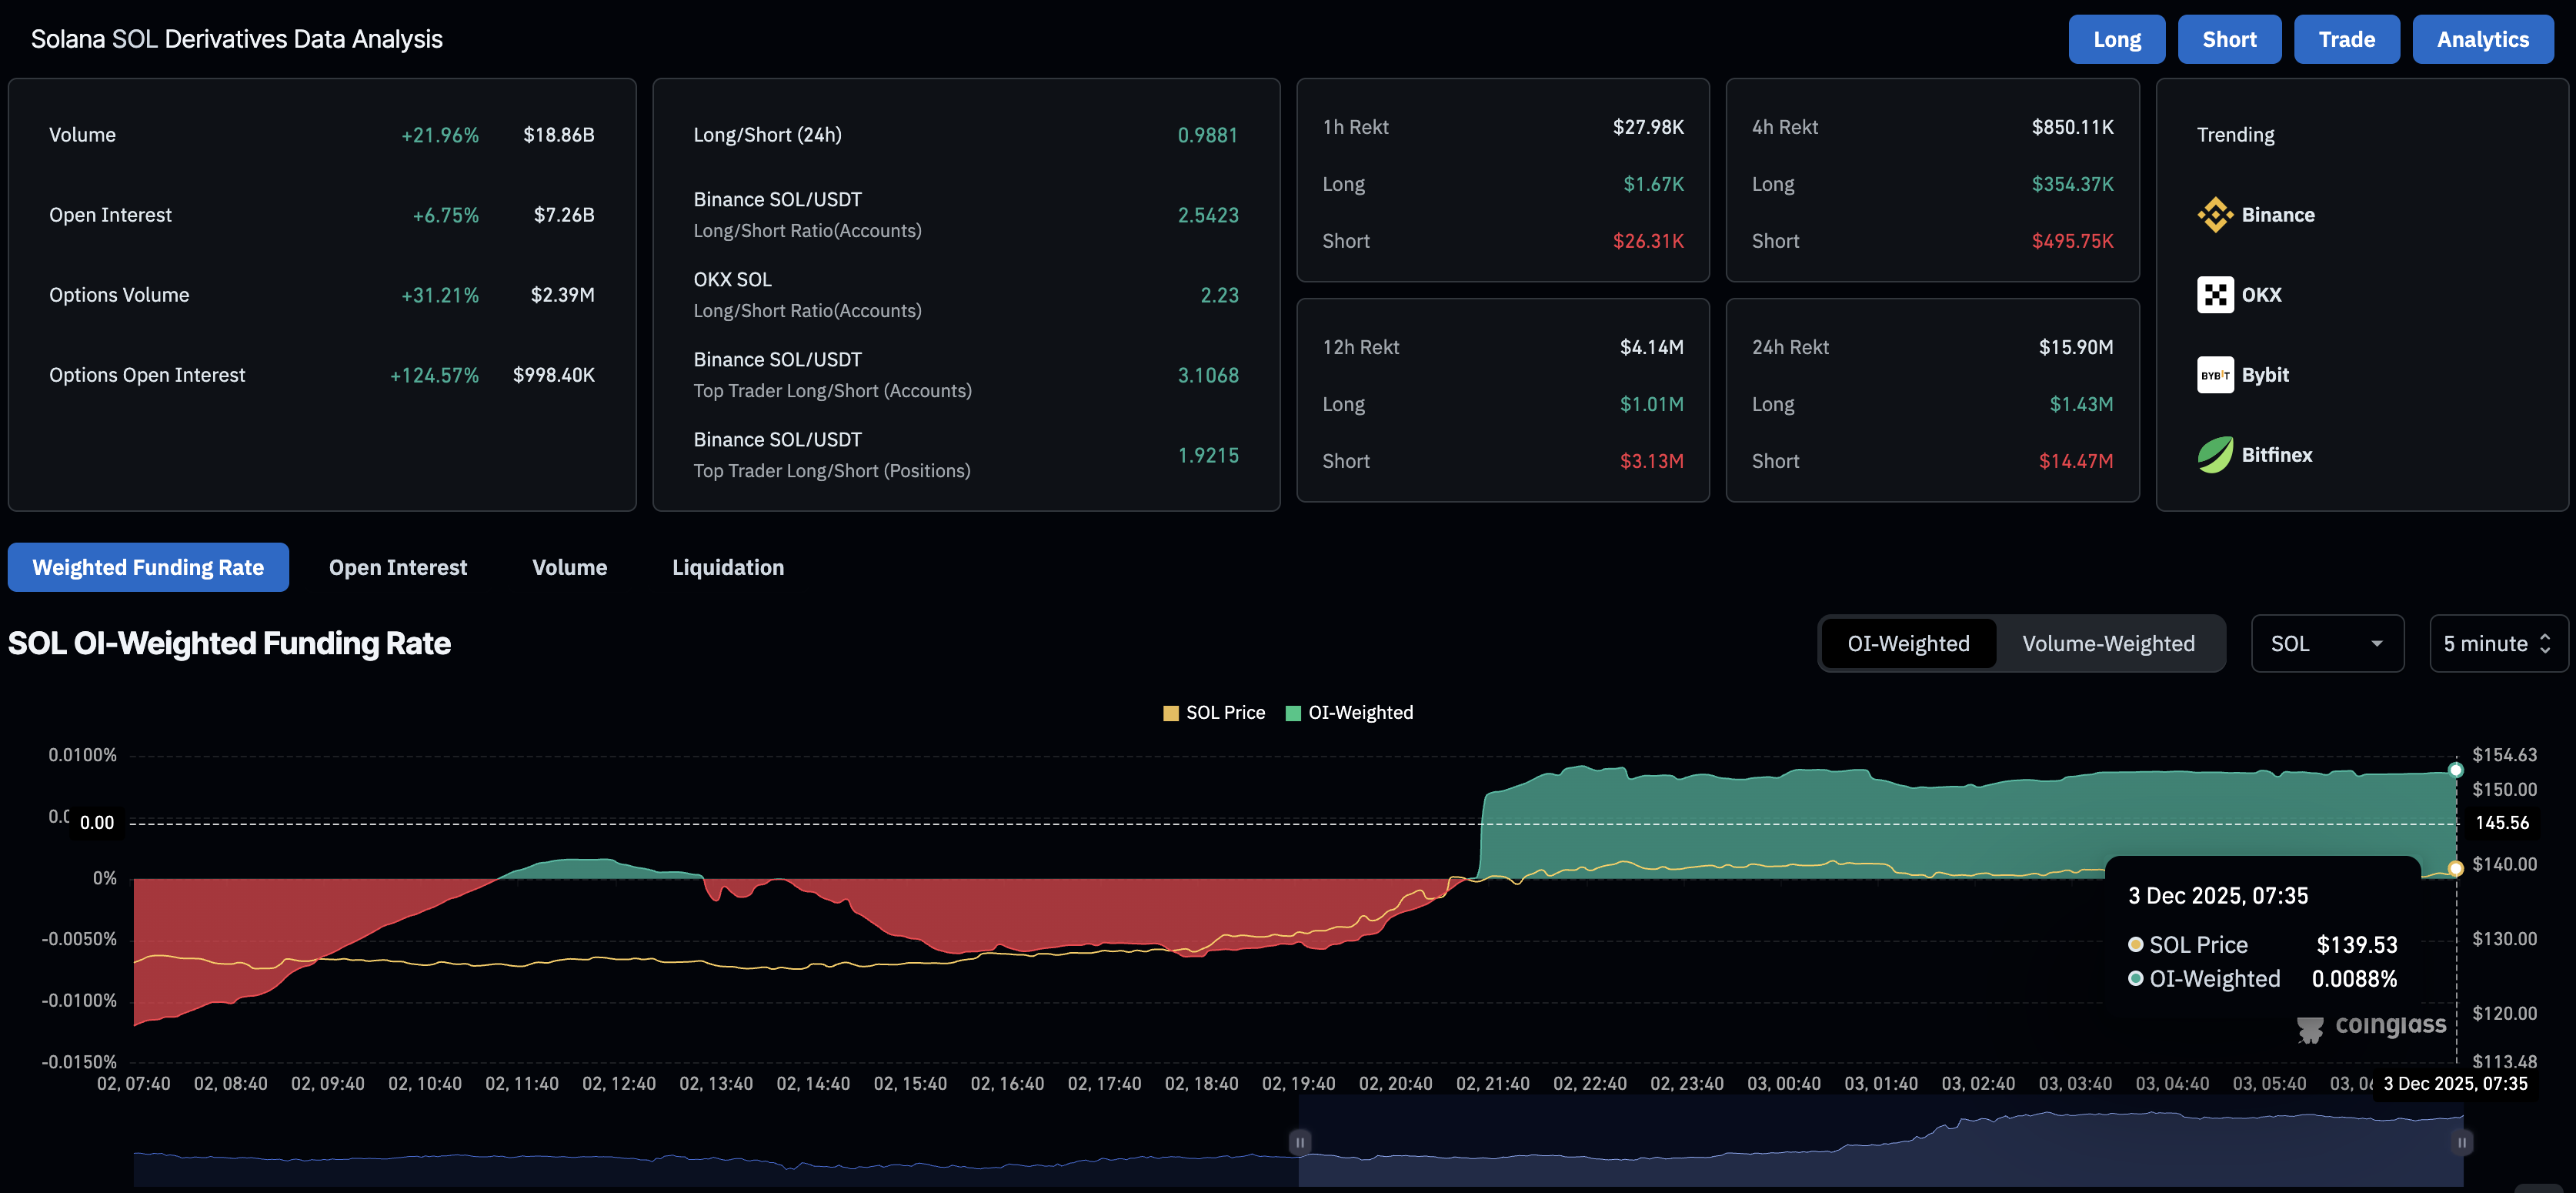
- Derivatives data suggest a positive shift in investors' risk appetite as Open Interest increases.
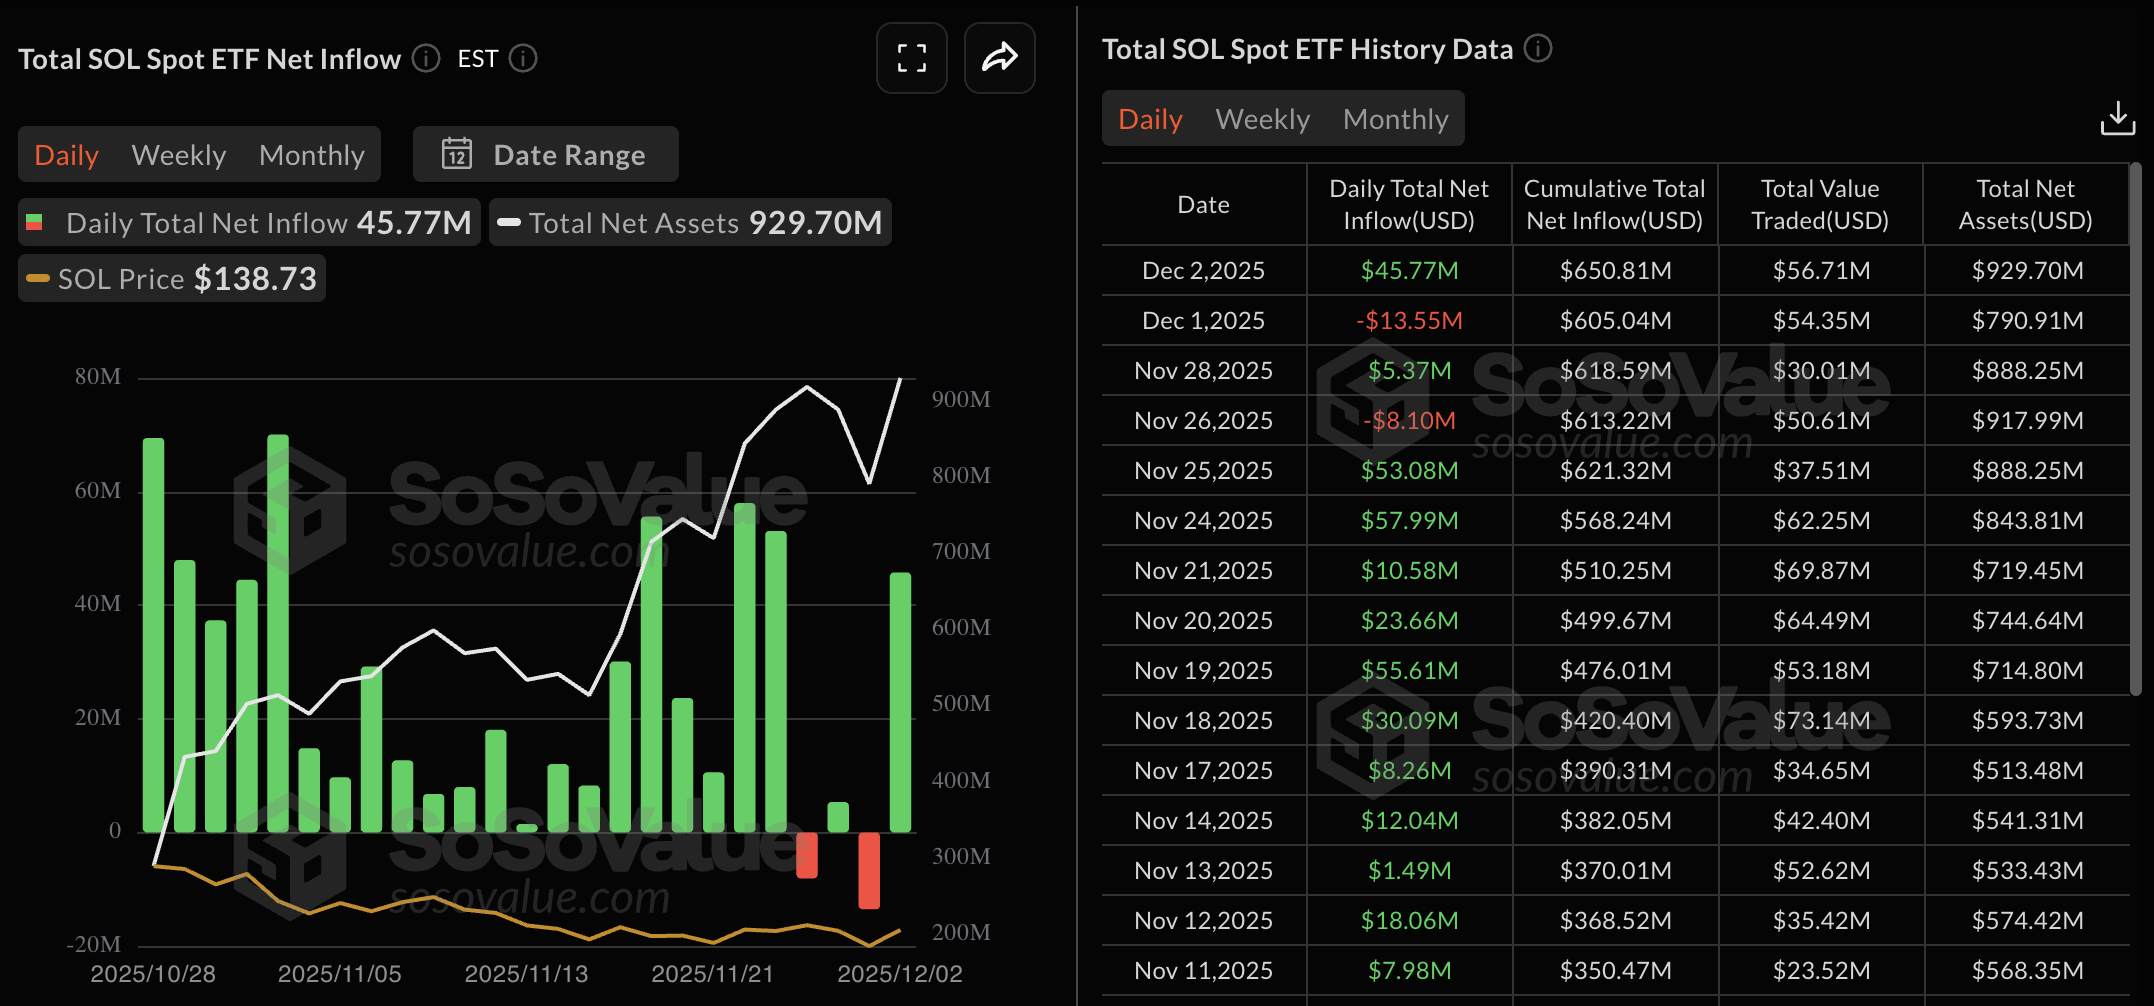
- Solana ETFs record a surge in inflows amid Vanguard’s approval of crypto ETFs.
Solana (SOL) trades above $140 by press time on Wednesday, up over 10% in the last 24 hours as Vanguard offers crypto Exchange Traded Funds (ETFs), including Solana ETFs. The sudden recovery boosts risk-on sentiment in Solana derivatives as investors anticipate further gains. Technically, the outlook for Solana centers on a potential double-bottom breakout targeting the 50-day Exponential Moving Average (EMA).
Demand is back for Solana on all levels
Vanguard's crypto-focused ETFs, including Bitcoin (BTC), Ethereum (ETH), Solana (SOL), and Ripple (XRP), are heating up the cryptocurrency market. Solana is experiencing a renewal in institutional demand with a net inflow of $45.77 million on Tuesday, flipping up from a net outflow of $13.55 million on Monday. Typically, an increase in ETF inflows signals better odds of further recovery and boosts investor confidence.
In line with institutional demand, Solana derivatives experience a rise in risk exposure as investors bet on further recovery. CoinGlass data shows that Solana futures Open Interest (OI) stands at $7.26 billion, up 6.75% over the last 24 hours, reflecting an increase in capital at risk.
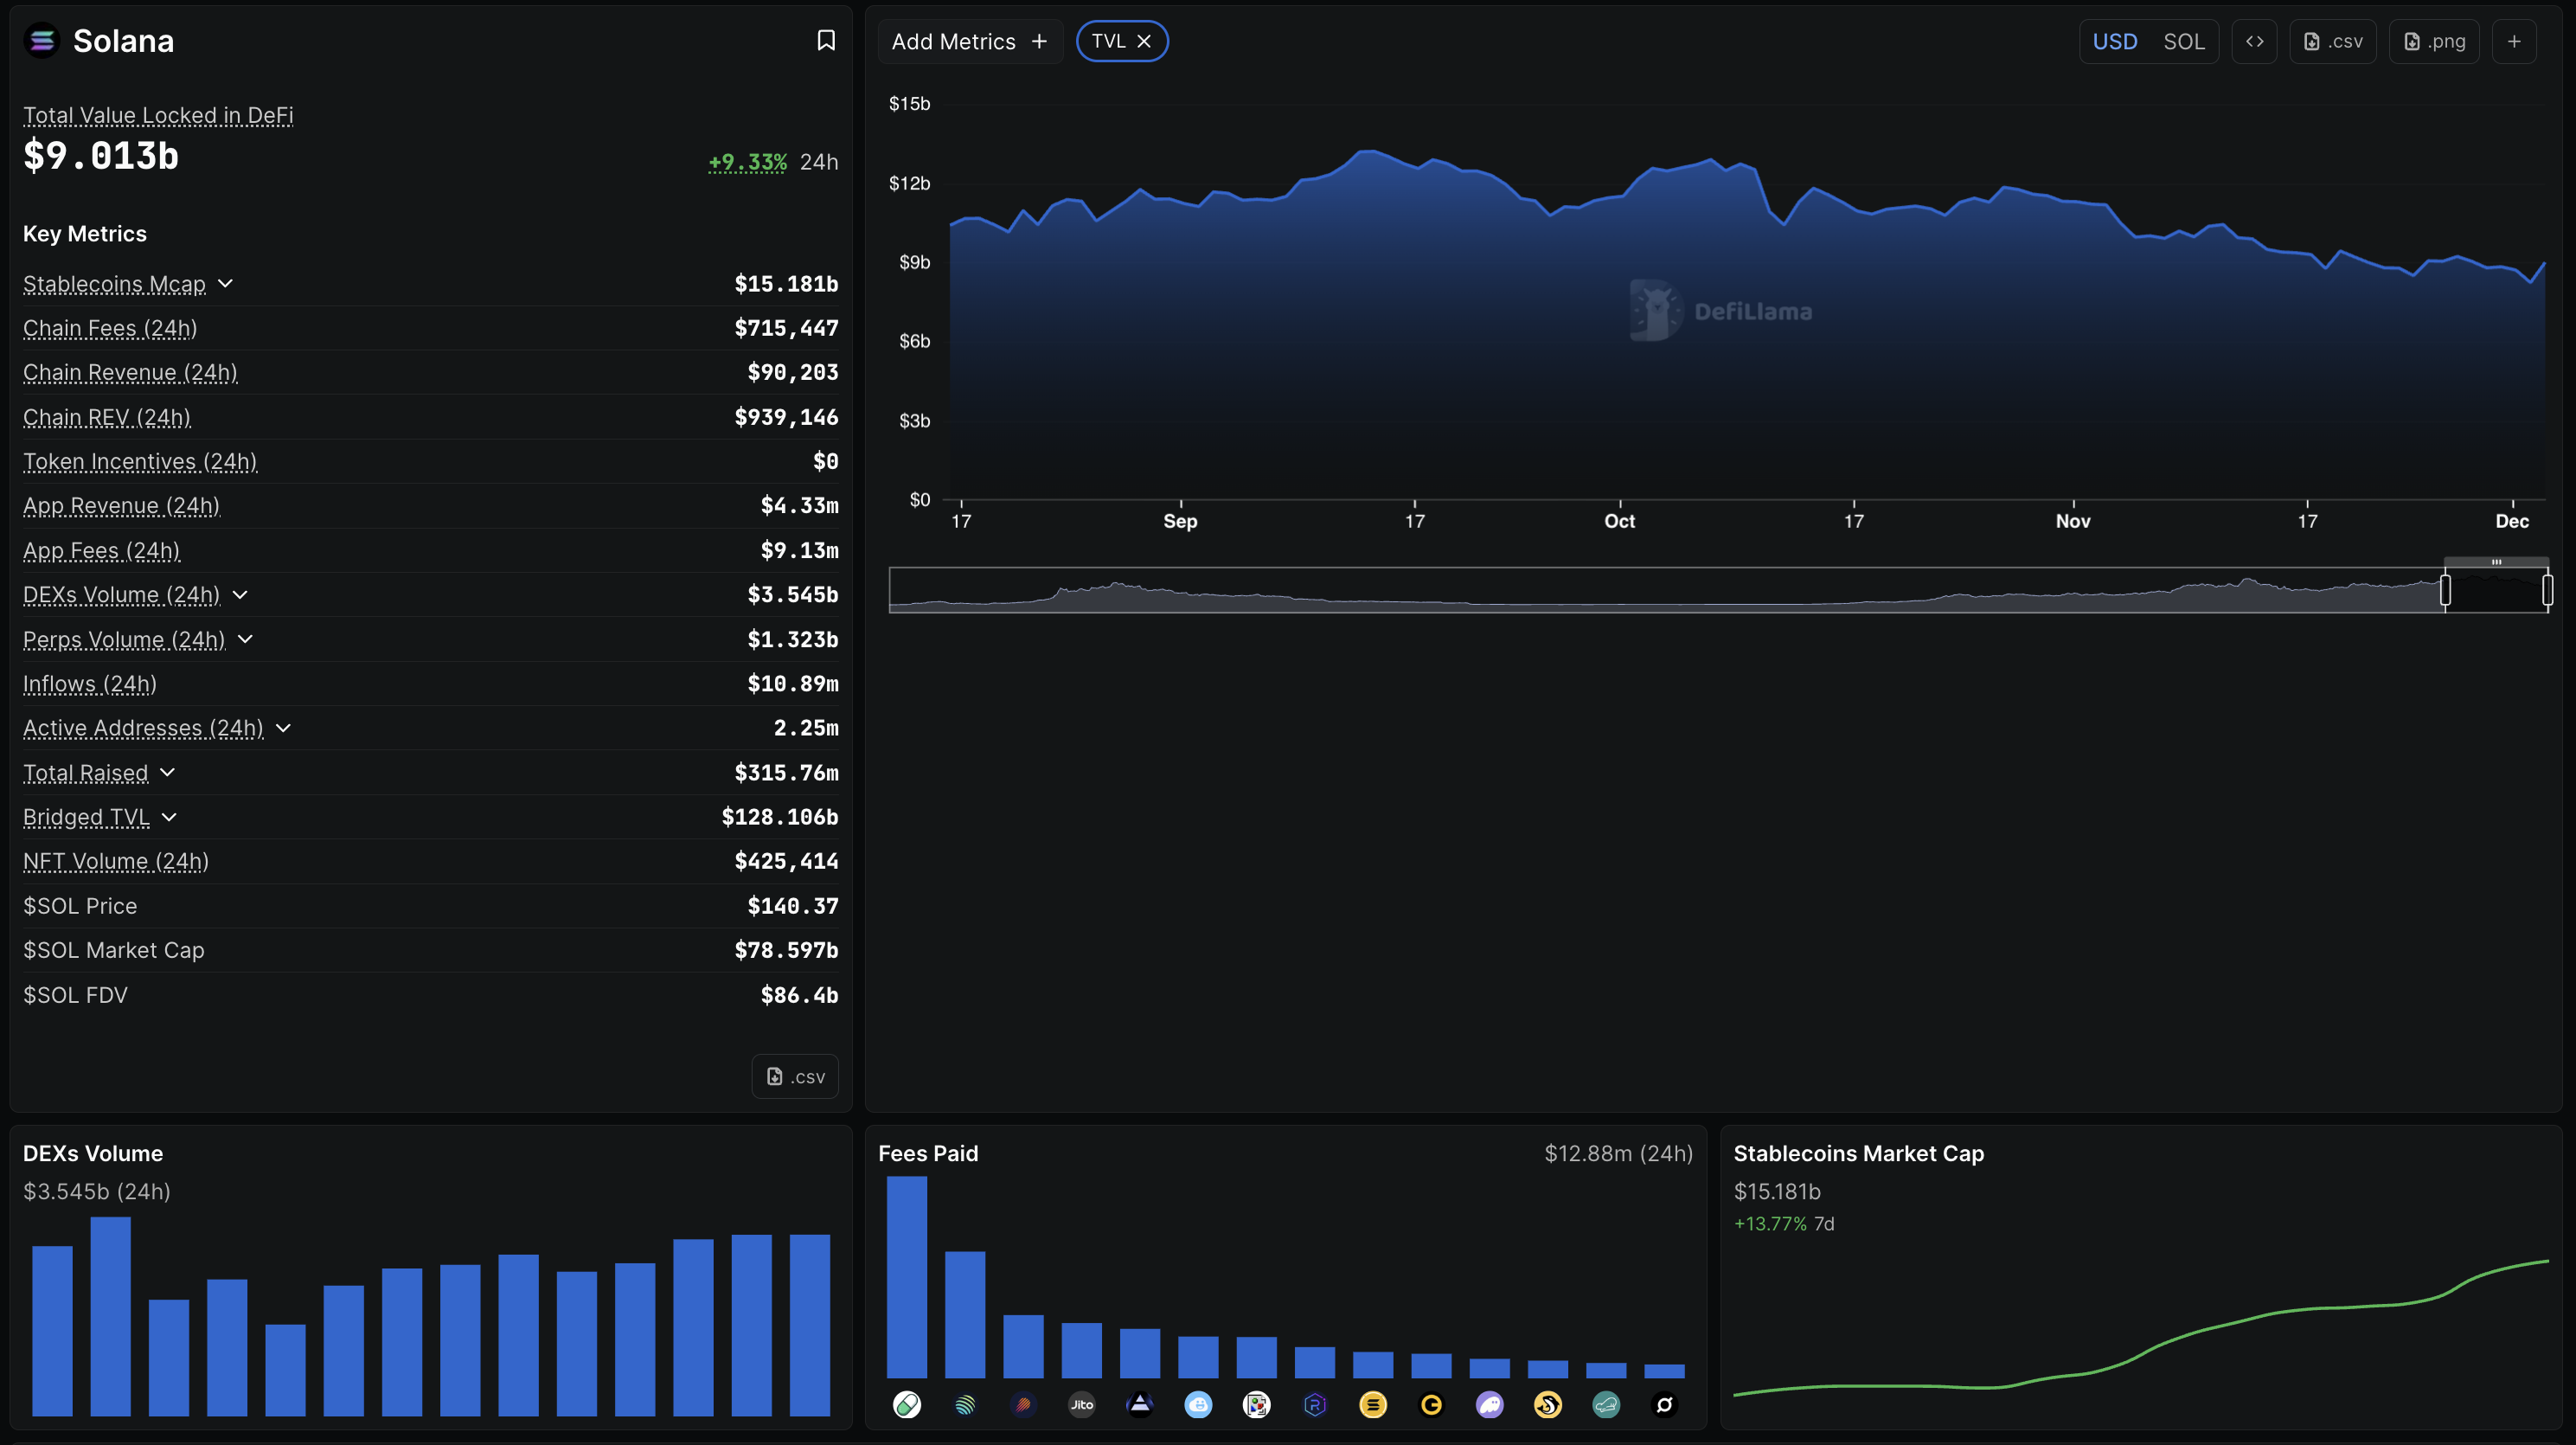
On a more positive note, on-chain data shows an increase in Solana adoption, with its Total Value Locked (TVL) rising 9.33% in the last 24 hours to $9.013 billion. A surge in TVL reflects increased user deposits on the blockchain, signaling greater activity and adoption.
Additionally, the stablecoin liquidity on Solana has increased by over 13% in the last week to $15.181 billion.
Technical outlook: Is Solana ready for a breakthrough?
Solana bounced off the $126 support, which has remained intact since the June 22 low and avoided a daily close beneath it. The rebound also forms a double-bottom pattern with a neckline near $145, close to the November 20 high.
If SOL confirms a daily close above $145, it could extend the rally to the 50-day EMA at $158, followed by the 200-day EMA at $175.
The Relative Strength Index (RSI) at 48 on the daily chart shows a steady rise from oversold levels, indicating a sharp decline in bearish pressure. At the same time, the Moving Average Convergence Divergence (MACD) shows steady recovery within the negative territory.
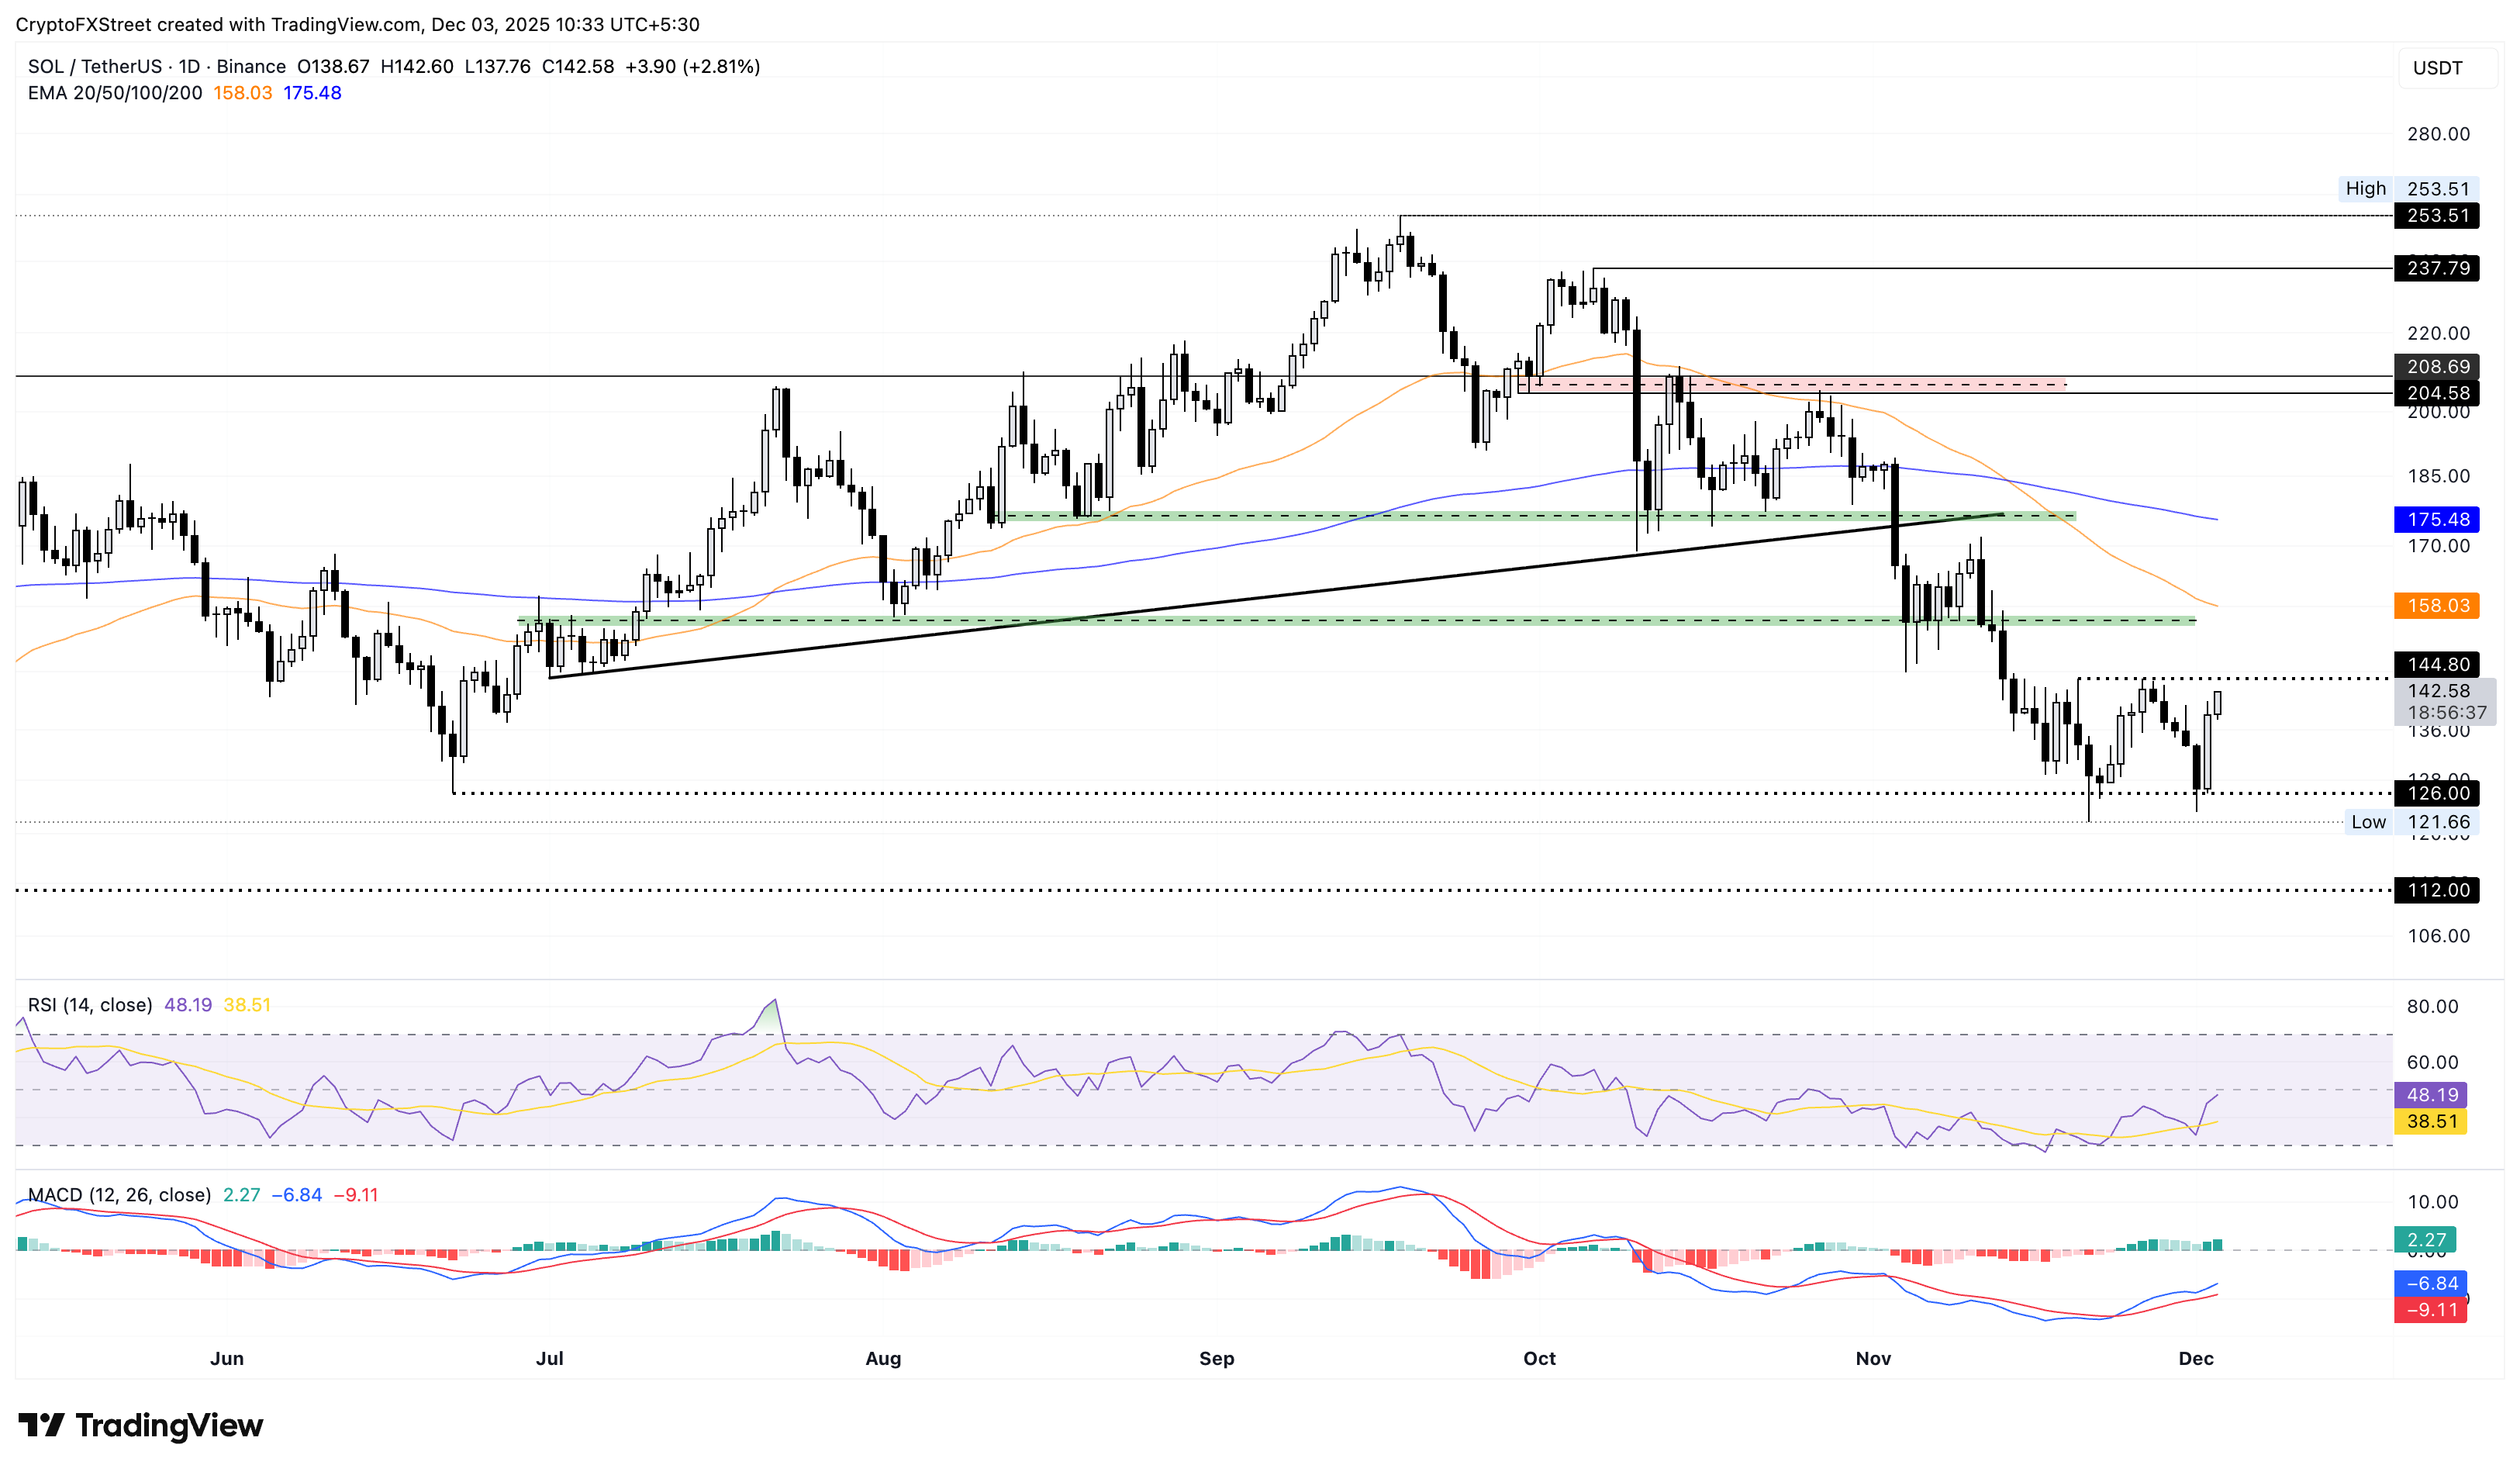
On the flip side, a reversal from $145 could shift Solana into a consolidation phase with the lower band at $126.

More than a million users rely on FXStreet for real-time market data, charting tools, expert insights, and forex news. Its comprehensive economic calendar and educational webinars help traders stay informed and make calculated decisions. FXStreet is supported by a team of about 60 professionals, split between the Barcelona headquarters and various global regions.
Read More


