


- Solana rises nearly 5% on Monday, with bulls aiming to exceed the overhead resistance trendline.
- Derivatives data indicate a rise in funding rate, signaling reduced bearish interest among traders.
- Solana ETFs recorded mild inflows last week, suggesting reduced institutional interest, but marked the sixth straight week of inflows.
Solana (SOL) edges higher by almost 5% at press time on Monday after a Doji candle formation on Sunday. Derivatives data indicate a rise in funding rate, signaling reduced incentive for traders to hold short positions. Meanwhile, the Solana-focused Exchange Traded Funds (ETFs) mark their sixth consecutive week of inflows, indicating a steady interest from institutional investors.
The technical outlook of Solana puts a local resistance trendline that has remained intact since October 6 in focus.
Steady demand for Solana signals improving sentiment
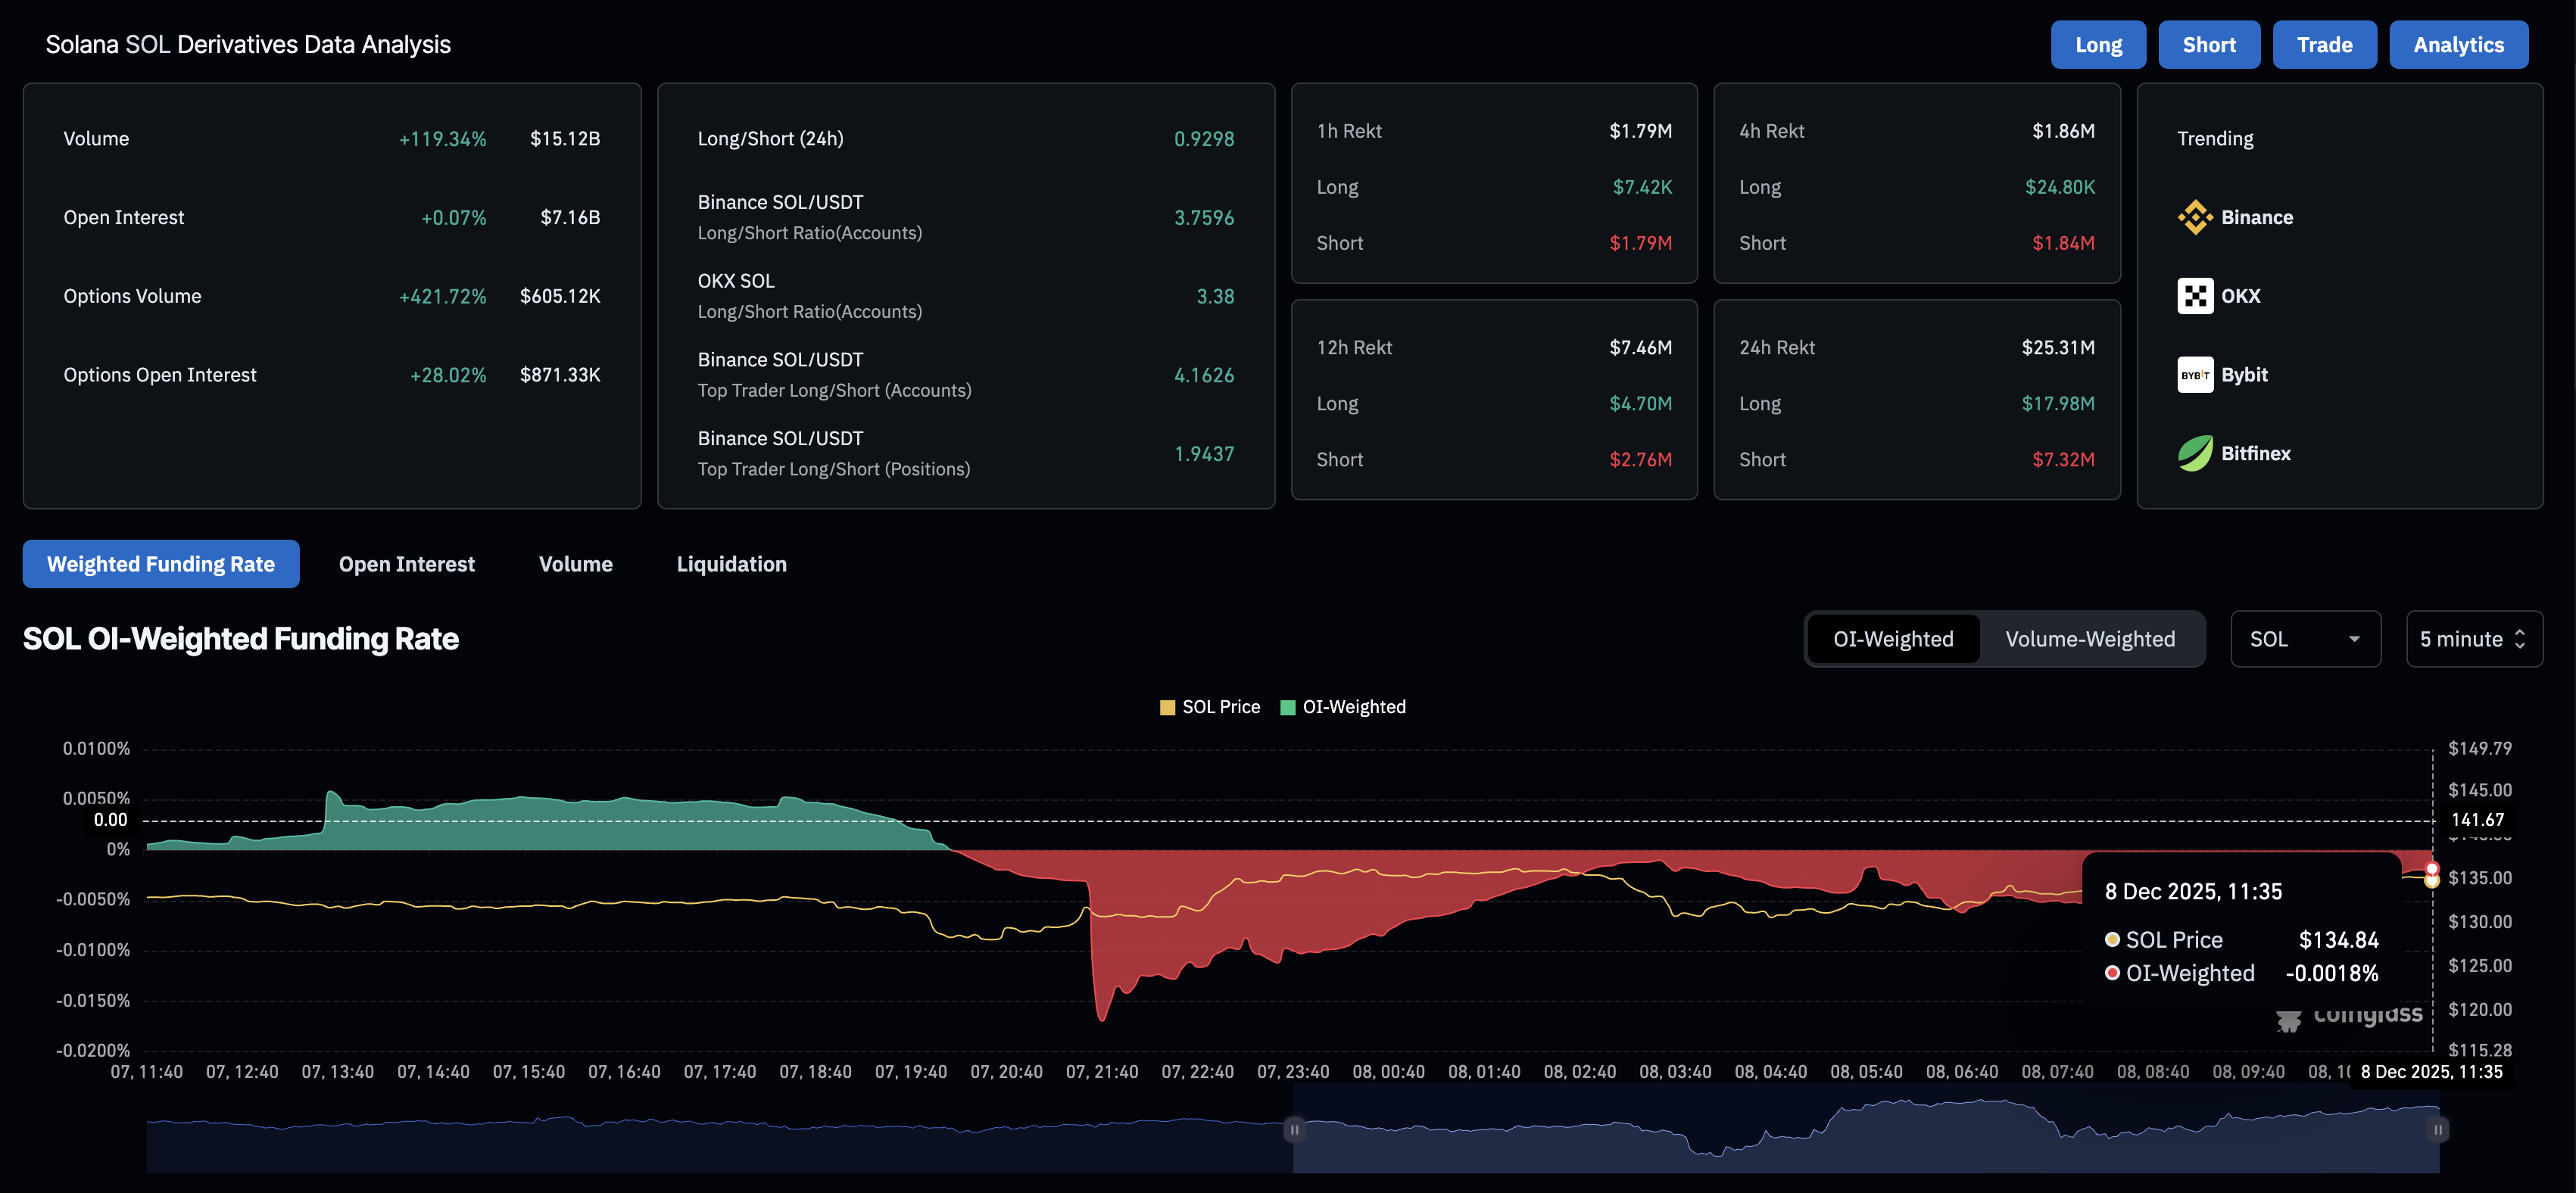
Solana’s futures Open Interest (OI) remains steady above $7 billion, suggesting a near flat capital flow in SOL derivatives. CoinGlass data shows SOL futures OI at $7.16 billion on Monday, broadly stable over the last 24 hours.
However, the rise in OI-weighted funding rate indicates that the interest in holding short positions has significantly decreased. The funding rate stands at -0.0018%, up from -0.170% on Sunday. If funding rates flip positive, it would signal a rise in bullish confidence as bulls will pay a premium to hold long positions.
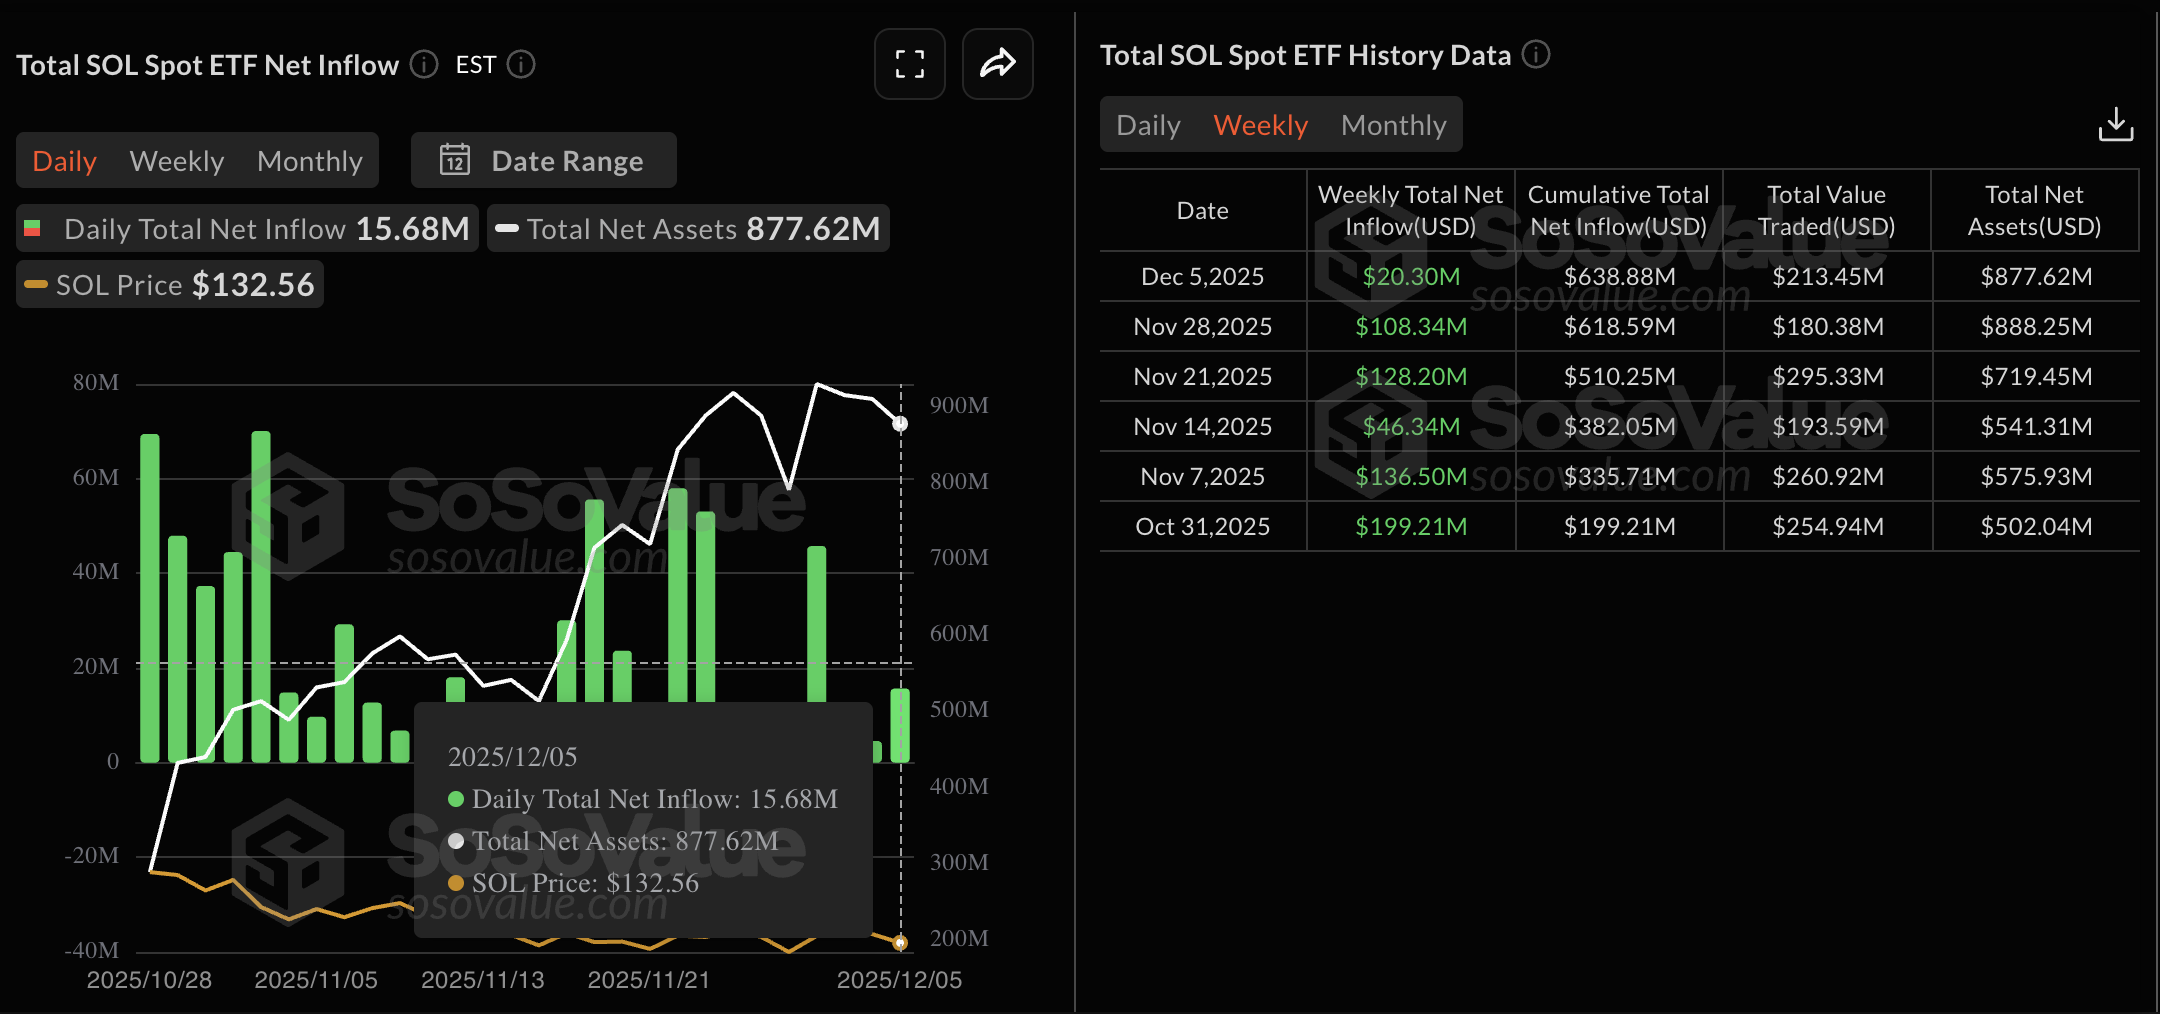
Meanwhile, the institutional interest in Solana has decreased, with $20.30 million in net weekly inflows into SOL ETFs, down from $108.34 million the previous week. Still, the $15.68 million in inflows on Friday extended the streak of weekly inflows to six consecutive weeks.
Solana gains traction, aiming to challenge a crucial resistance trendline
Solana floats above the $121- $127 demand zone on Monday, aiming for the resistance trendline connecting the October 6 and 27 highs, near $140. The short-term recovery in the high-speed blockchain token could confirm the bullish breakout with a decisive daily close above $140.
Solana’s potential breakout rally could face opposition from the declining 50-day and 200-day Exponential Moving Averages (EMAs) at $153 and $173, respectively.
The technical indicators on the daily chart suggest a positive shift in trend momentum. The Relative Strength Index (RSI) at 45 points, upside toward midline, signals a neutral shift from a bearish bias.
Meanwhile, the Moving Average Convergence Divergence (MACD) extends a steady upward trend above its signal line, signaling bullish momentum on edge as a potential crossover could flash renewed bearish pressure.
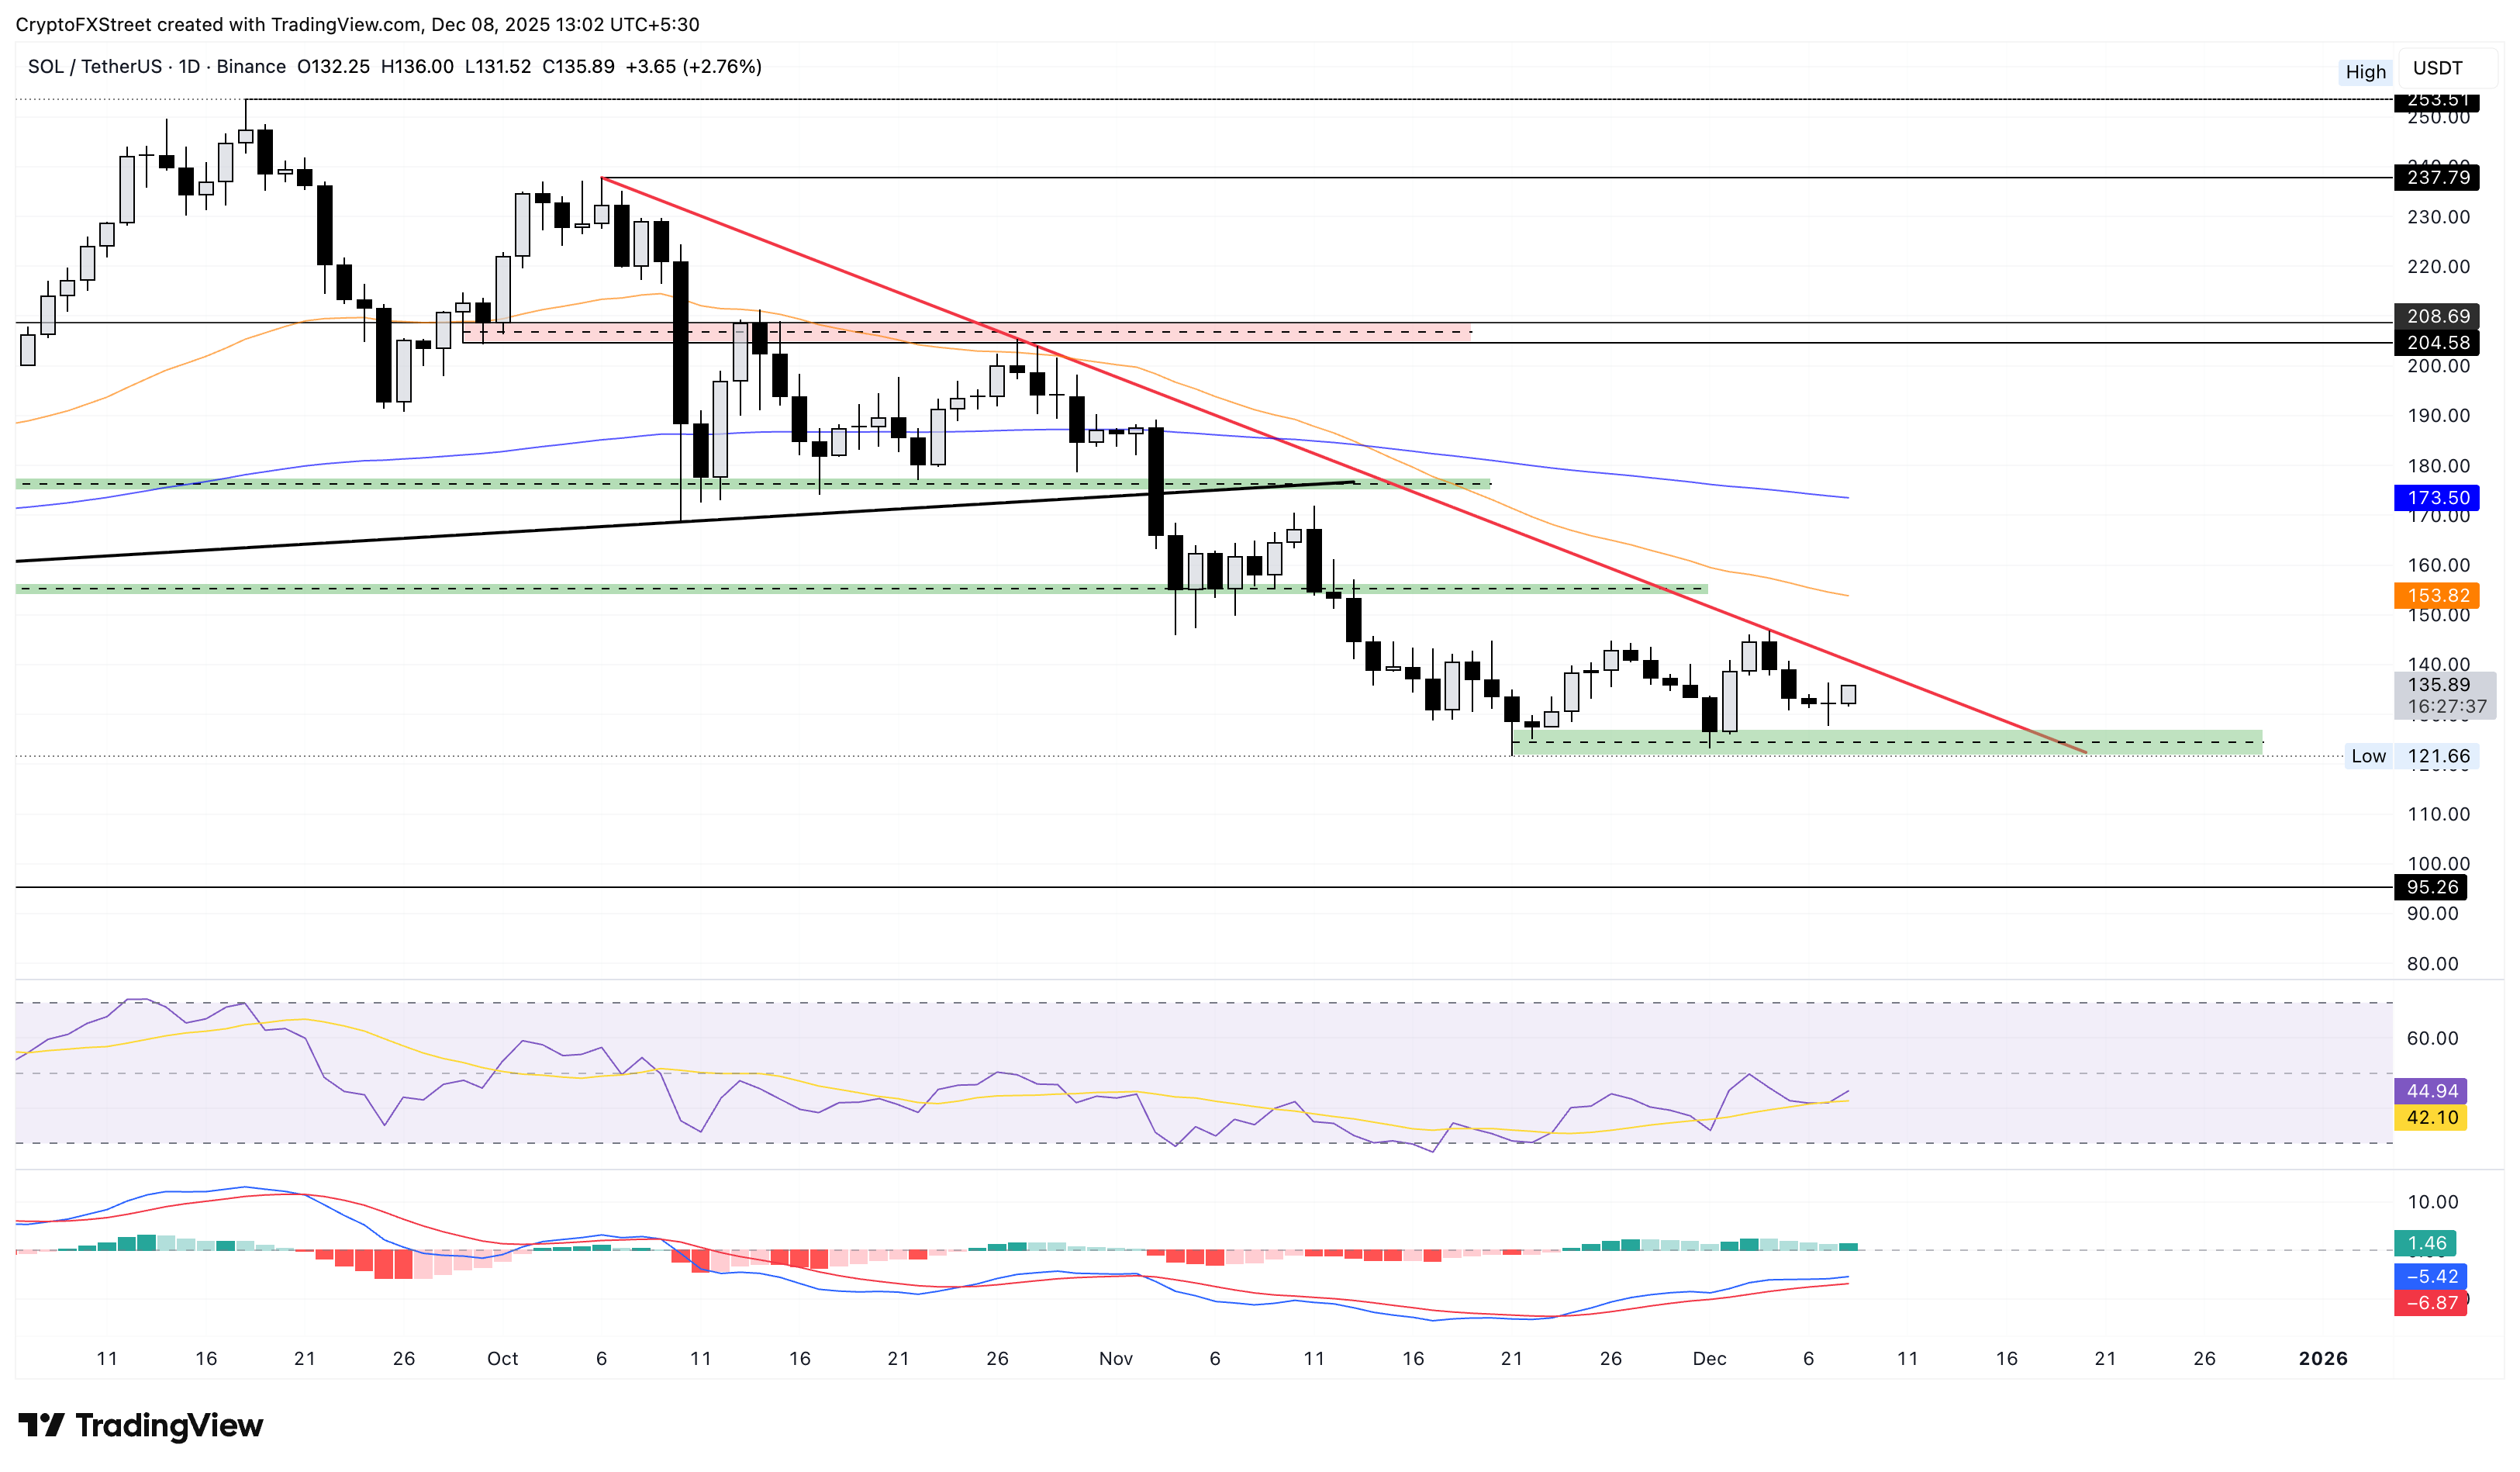
Looking down, if SOL closes below $121, the bears could target April’s low at $95.


