
Trade The World
Stellar Price Forecast: Death Cross in XLM risks a 15% correction as demand softens
By Vishal Dixit
Date Published: 5 Nov 2025 | Date Modified: 5 Nov 2025


POPULAR ARTICLES

Stellar (XLM) breaks out of a falling channel pattern on the downside after two straight days of losses as a Death Cross pattern emerges on the daily chart. The XRP-rival risks further losses as the retail demand softens and analyst Peter Brandt alerts a pattern breakout.
- Stellar floats above $0.2700 after two consecutive days of losses.
- The XLM futures Open Interest drops to mid-April levels, indicating softer retail demand.
- Analyst Peter Brandt shares a breakdown of the descending triangle in XLM, suggesting an extended correction phase is underway.
Stellar (XLM) breaks out of a falling channel pattern on the downside after two straight days of losses as a Death Cross pattern emerges on the daily chart. The XRP-rival risks further losses as the retail demand softens and analyst Peter Brandt alerts a pattern breakout.
Traders are losing confidence in Stellar
Stellar is losing the retail interest as the broader cryptocurrency market takes another bearish hit. CoinGlass data shows a steady decline in the XLM futures Open Interest (OI) to $118.98 million on Wednesday, which was last visited in mid-April. This indicates a consistent decrease in the notional value of all outstanding futures contracts, suggesting that traders are withdrawing capital, reducing leverage, or being forced to liquidate.

Analyst Peter Brandt warns of further correction
Peter Brandt, a veteran market analyst, shared a breakdown of the descending triangle on the daily bars chart, in continuation of a larger triangle breakdown in early October. However, Brandt’s chart fails to mention any target but shows a steady increase in bearish trend momentum as the rising Average Directional Index (ADX) reaches 37 at the time of his tweet.

Stellar’s channel breakdown targets $0.2200
Stellar trades above $0.2700 at press time on Wednesday, recovering over 1% on the day after consecutive days of losses. The prevailing pullback in XLM marks the breakdown of a falling channel on the daily chart, risking an extended correction to the $0.2200 support zone.
Furthermore, the 50-day Exponential Moving Average (EMA) crossed below the 200-day EMA on Monday, flashing a Death Cross pattern, which signals a strong bearish trend.
The momentum indicators on the daily chart corroborate the bearish dominance as the Relative Strength Index (RSI) at 30 indicates intense selling pressure. At the same time, the Moving Average Convergence Divergence (MACD) extends the downward trend below the signal line, indicating a rise in bearish momentum.
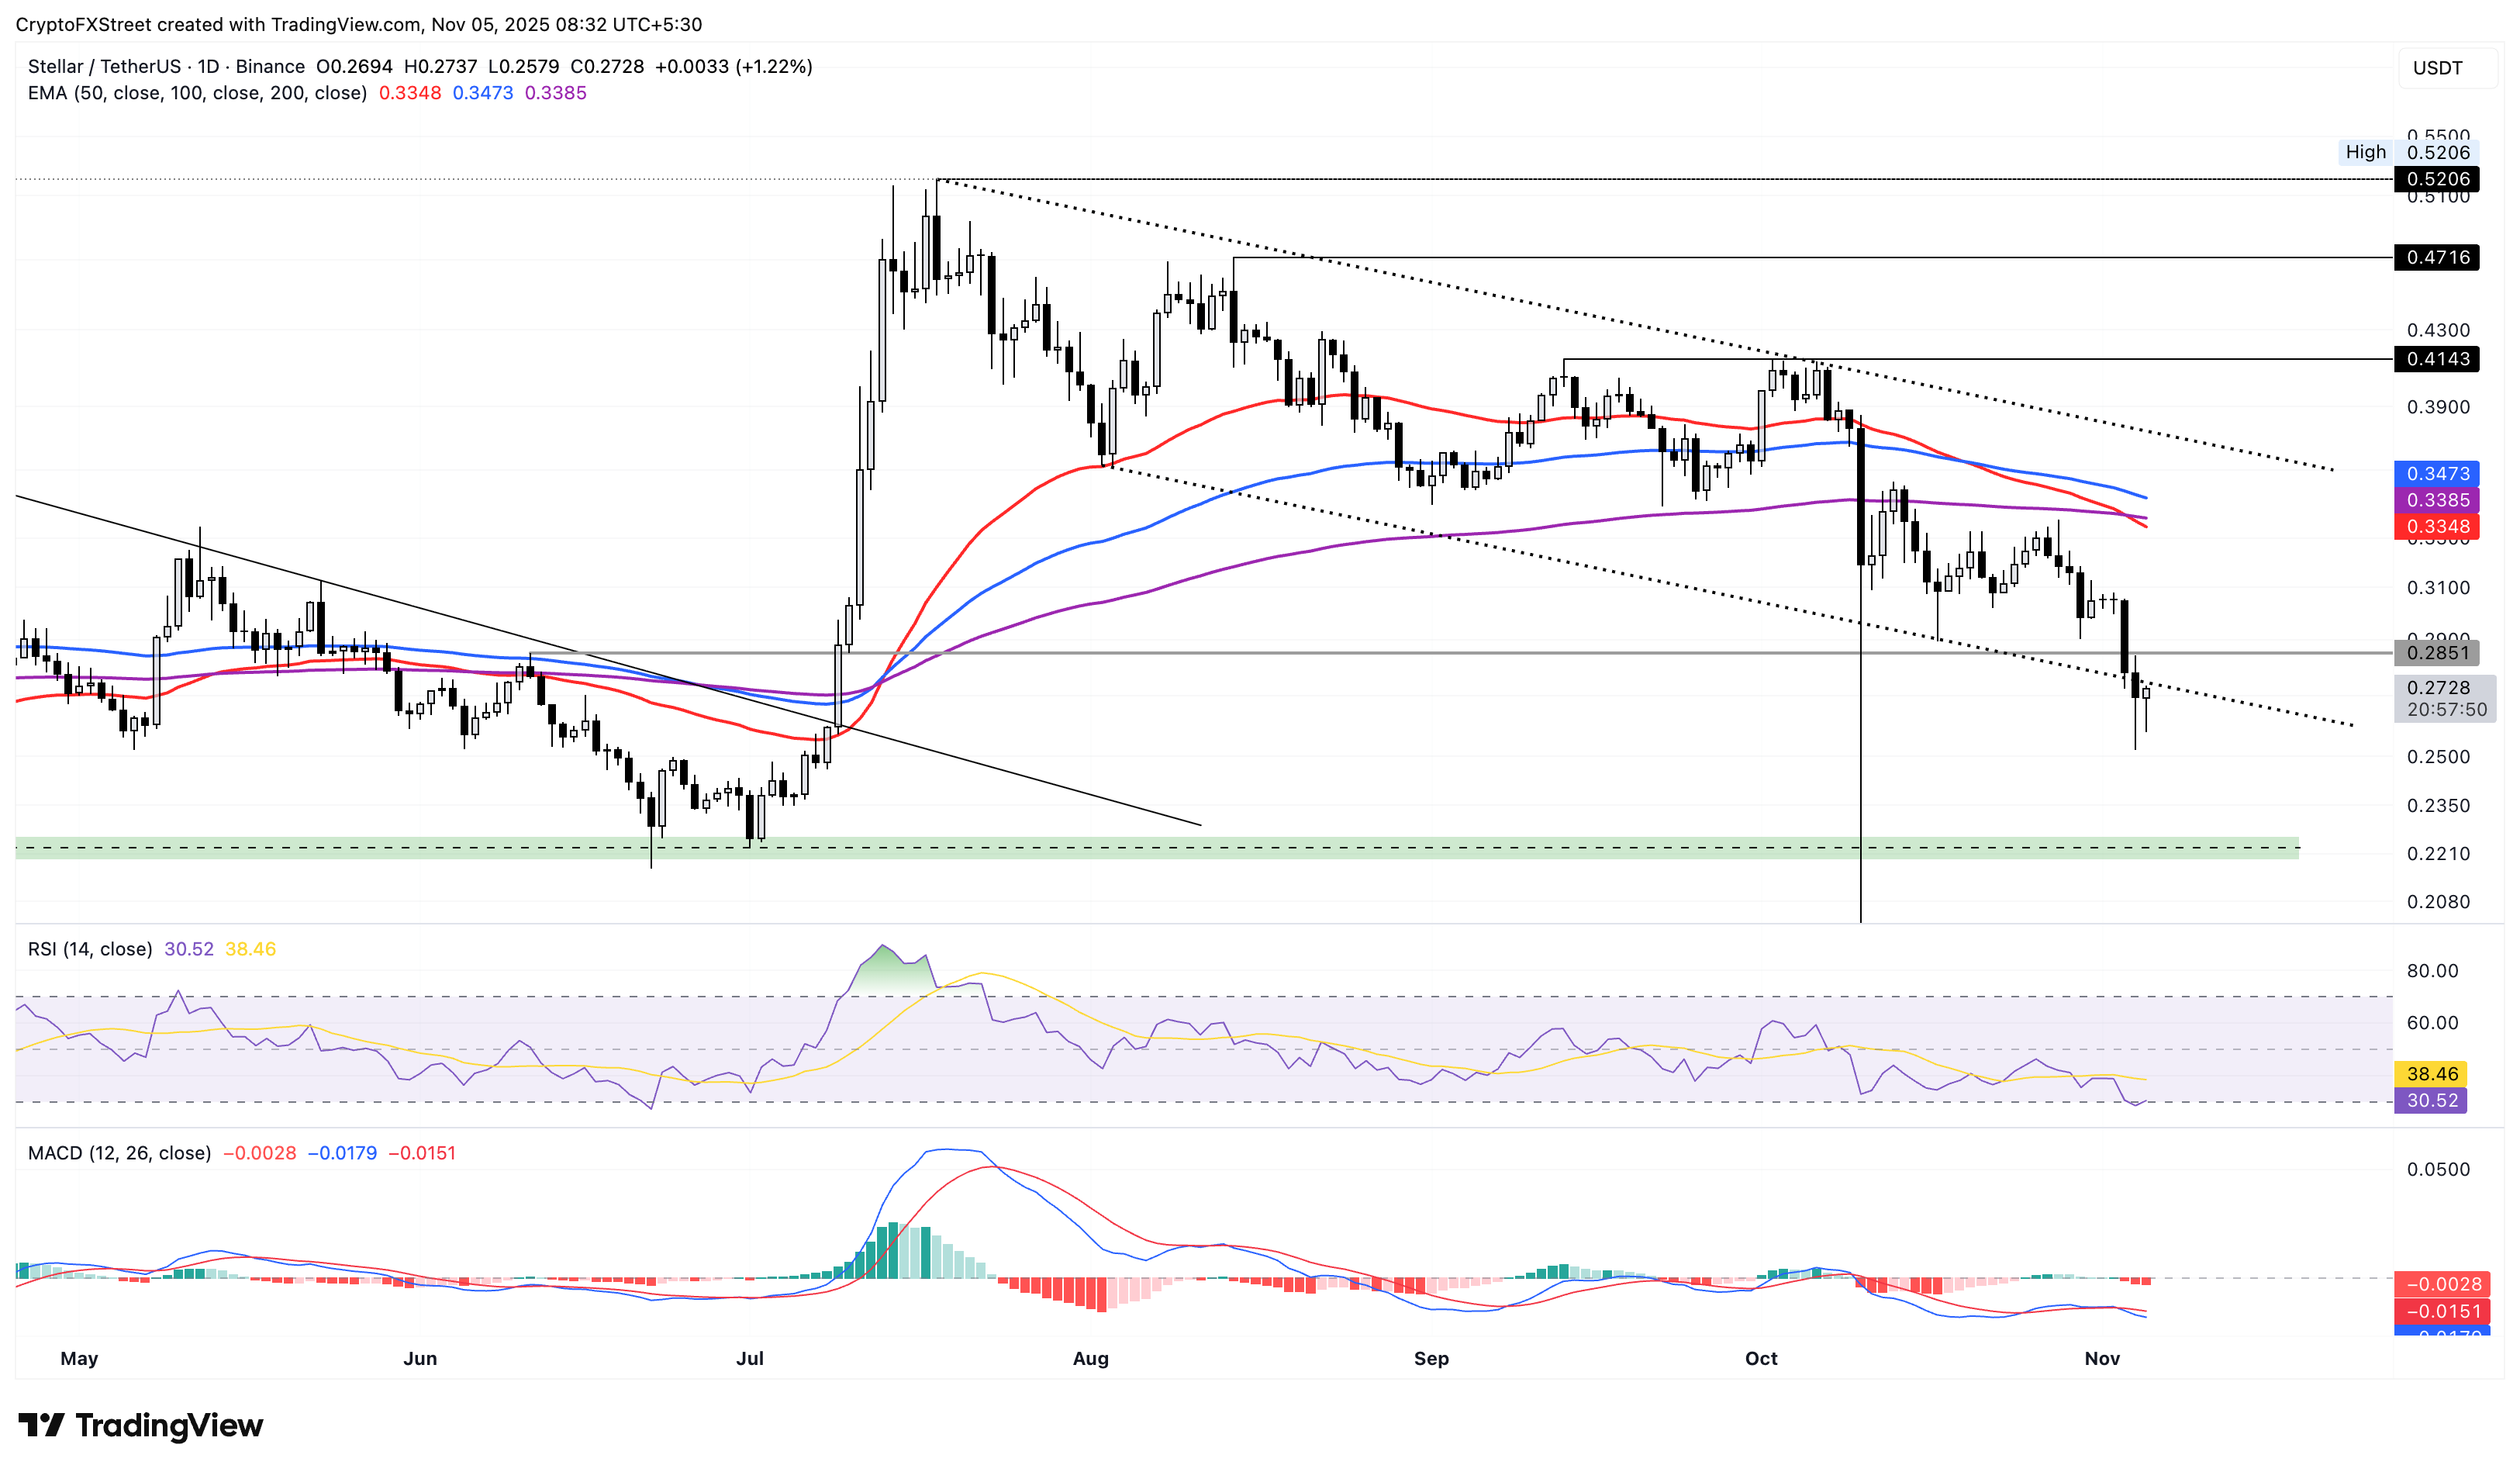
Optimistically, if XLM resurfaces above the June 11 high of $0.2851, it could extend the rally to the $0.3000 psychological level.

FXStreet
More than a million users rely on FXStreet for real-time market data, charting tools, expert insights, and forex news. Its comprehensive economic calendar and educational webinars help traders stay informed and make calculated decisions. FXStreet is supported by a team of about 60 professionals, split between the Barcelona headquarters and various global regions.
Read More


