


- USD/CAD recorded a fresh five-month low of 1.3675 on Wednesday.
- The 14-day Relative Strength Index stands at 26.38, firmly in oversold territory, reinforcing bearish momentum.
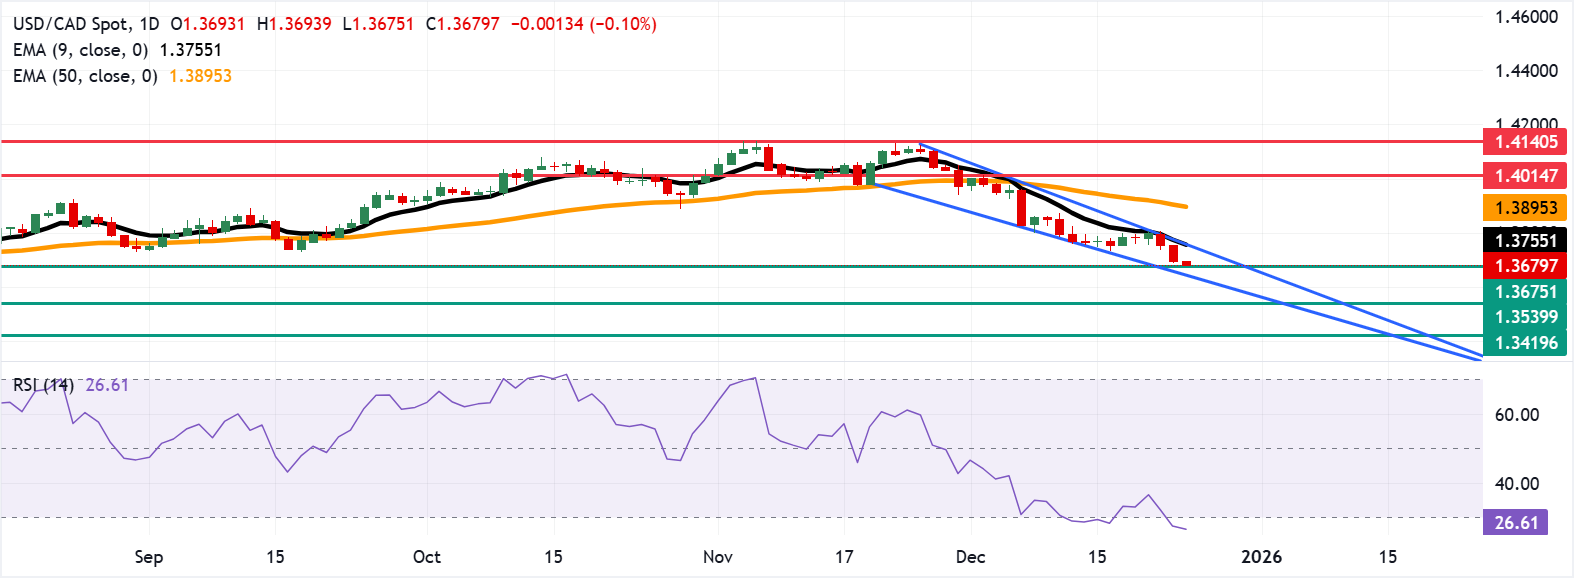
- The primary barrier lies at the nine-day EMA of 1.3754.
USD/CAD loses ground for the third consecutive day, trading around 1.3680 during the early European hours on Wednesday. The daily chart suggests a potential upside breakout, with falling, converging trendlines forming a bullish descending wedge pattern.
The USD/CAD pair holds beneath the descending nine-day Exponential Moving Average (EMA) and the 50-day EMA, maintaining a bearish bias. The bearish alignment persists as the nine-day EMA remains below the 50-day EMA and both slopes lower.
The 14-day Relative Strength Index (RSI) at 26.38 sits in oversold territory and continues to decline, confirming downside momentum. RSI below 30 warns of stretched conditions, but momentum stays with sellers unless price stabilizes above the short-term gauge.
The USD/CAD pair reaches fresh five-month low of 1.3675 on December 24, followed by the lower boundary of the descending wedge around 1.3650. A break below the wedge pattern would reinforce the bearish bias and put downward pressure on the pair to navigate the region around 1.3539, the lowest level since October 2024.
On the upside, the USD/CAD pair may rebound toward the nine-day EMA at 1.3754, aligned with the upper descending wedge boundary around 1.3760. A break above this confluence resistance zone could trigger a rebound and support the pair to target the 50-day EMA at 1.3894. Further barrier lies at the three-week high of 1.4014.
Canadian Dollar Price Today
The table below shows the percentage change of Canadian Dollar (CAD) against listed major currencies today. Canadian Dollar was the strongest against the US Dollar.
| USD | EUR | GBP | JPY | CAD | AUD | NZD | CHF | |
|---|---|---|---|---|---|---|---|---|
| USD | -0.03% | -0.12% | -0.33% | -0.10% | -0.24% | -0.08% | -0.09% | |
| EUR | 0.03% | -0.10% | -0.31% | -0.07% | -0.20% | -0.06% | -0.07% | |
| GBP | 0.12% | 0.10% | -0.21% | 0.02% | -0.11% | 0.04% | 0.03% | |
| JPY | 0.33% | 0.31% | 0.21% | 0.23% | 0.11% | 0.25% | 0.25% | |
| CAD | 0.10% | 0.07% | -0.02% | -0.23% | -0.16% | -0.02% | -0.01% | |
| AUD | 0.24% | 0.20% | 0.11% | -0.11% | 0.16% | 0.15% | 0.11% | |
| NZD | 0.08% | 0.06% | -0.04% | -0.25% | 0.02% | -0.15% | -0.01% | |
| CHF | 0.09% | 0.07% | -0.03% | -0.25% | 0.00% | -0.11% | 0.00% |
The heat map shows percentage changes of major currencies against each other. The base currency is picked from the left column, while the quote currency is picked from the top row. For example, if you pick the Canadian Dollar from the left column and move along the horizontal line to the US Dollar, the percentage change displayed in the box will represent CAD (base)/USD (quote).
(The technical analysis of this story was written with the help of an AI tool.)


