
Trade The World
USD/INR gains as US Dollar outperforms ahead of US NFP data
By Sagar Dua
Date Published: 9 Jan 2026 | Date Modified: 9 Jan 2026


POPULAR ARTICLES
The Indian Rupee (INR) trades sharply lower against the US Dollar (USD) on Friday. The USD/INR pair jumps to near 90.47 as the US Dollar (USD) extends its upside move ahead of the release of the United States (US) Nonfarm Payrolls (NFP) data for December at 13:30 GMT.
- The Indian Rupee drops against the US Dollar ahead of the release of US NFP data for December.
- So far in January, FIIs have dumped their stake worth Rs. 8,017.51 crore in the Indian stock market.
- US President Trump gives the green light to a bill that allows Washington to impose tariffs of up to 500% on countries trading with Russia.
The Indian Rupee (INR) trades sharply lower against the US Dollar (USD) on Friday. The USD/INR pair jumps to near 90.47 as the US Dollar (USD) extends its upside move ahead of the release of the United States (US) Nonfarm Payrolls (NFP) data for December at 13:30 GMT.
As of writing, the US Dollar Index (DXY), which tracks the Greenback’s value against six major currencies, posts a fresh four-week high around 99.00.
The impact of the US NFP data for December will significantly influence market expectations for the Federal Reserve’s (Fed) monetary policy outlook, given that the official employment data from previous months was distorted by the federal government shutdown.
The employment report is expected to show that the economy created 60K fresh jobs, slightly lower than 64K in November. The Unemployment Rate is estimated to have dropped to 4.5% from the prior reading of 4.6%.
According to the New York Fed bank’s latest Survey of Consumer Expectations of December, respondents stated that the prospect of finding a job if unemployed was the worst since the report began in 2013, Reuters reported.
In the NFP report, investors will also focus on Average Hourly Earnings data, a key measure of wage growth, to get fresh cues on the inflation outlook. The wage growth measure is expected to have grown at an annualized pace of 3.6%, faster than 3.5% in November. Month-on-month Average Hourly Earnings are estimated to have risen at a faster pace of 0.3% against the prior reading of 0.1%.
US Dollar Price Today
The table below shows the percentage change of US Dollar (USD) against listed major currencies today. US Dollar was the strongest against the Japanese Yen.
| USD | EUR | GBP | JPY | CAD | AUD | INR | CHF | |
|---|---|---|---|---|---|---|---|---|
| USD | 0.09% | 0.24% | 0.46% | 0.07% | 0.29% | 0.26% | 0.09% | |
| EUR | -0.09% | 0.16% | 0.37% | -0.01% | 0.20% | 0.17% | 0.00% | |
| GBP | -0.24% | -0.16% | 0.21% | -0.16% | 0.04% | 0.02% | -0.15% | |
| JPY | -0.46% | -0.37% | -0.21% | -0.37% | -0.18% | -0.19% | -0.36% | |
| CAD | -0.07% | 0.01% | 0.16% | 0.37% | 0.20% | 0.18% | 0.02% | |
| AUD | -0.29% | -0.20% | -0.04% | 0.18% | -0.20% | -0.02% | -0.19% | |
| INR | -0.26% | -0.17% | -0.02% | 0.19% | -0.18% | 0.02% | -0.16% | |
| CHF | -0.09% | -0.01% | 0.15% | 0.36% | -0.02% | 0.19% | 0.16% |
The heat map shows percentage changes of major currencies against each other. The base currency is picked from the left column, while the quote currency is picked from the top row. For example, if you pick the US Dollar from the left column and move along the horizontal line to the Japanese Yen, the percentage change displayed in the box will represent USD (base)/JPY (quote).
Daily Digest Market Movers: India's retail CPI is expected to come in higher at 1.5%
- The upside move in the USD/INR pair is also driven by weakness in the Indian Rupee. The Indian currency is under pressure as foreign investors continue to dump their stake in the Indian equity market amid renewed trade woes between the US and India.
- So far in January, Foreign Institutional Investors (FIIs) have remained net sellers on five out of six trading days and have offloaded their stake worth Rs. 8,017.51 crore. In 2025, FIIs remained net sellers in eight out of 12 months.
- Trade tensions between the US and India have renewed after President Donald Trump threatened to raise tariffs on imports from New Delhi for their continued oil purchase from Russia.
- Meanwhile, US Senator Lindsey Graham stated this week that President Trump has given the go-ahead for a bill that looks to impose 500% tariffs on countries trading with Russia, Times of India (ToI) reported.
- Such a scenario would further dampen the sentiment of overseas investors towards the Indian stock market. However, the impact of higher tariffs on Indian exports to Washington would be limited as the current rate of import duty in New Delhi, which is 50%, is one of the highest among all trading partners of the US, making Indian imports less competitive already.
- On the domestic front, investors will focus on India’s retail Consumer Price Index (CPI) data for December, which will be released on Monday. India’s retail CPI is estimated to have grown at an annualized pace of 1.5%, faster than 0.71% in November, but will still remain below the Reserve Bank of India’s (RBI) tolerance band of 2%-6%.
Technical Analysis: USD/INR recovers to near 90.50
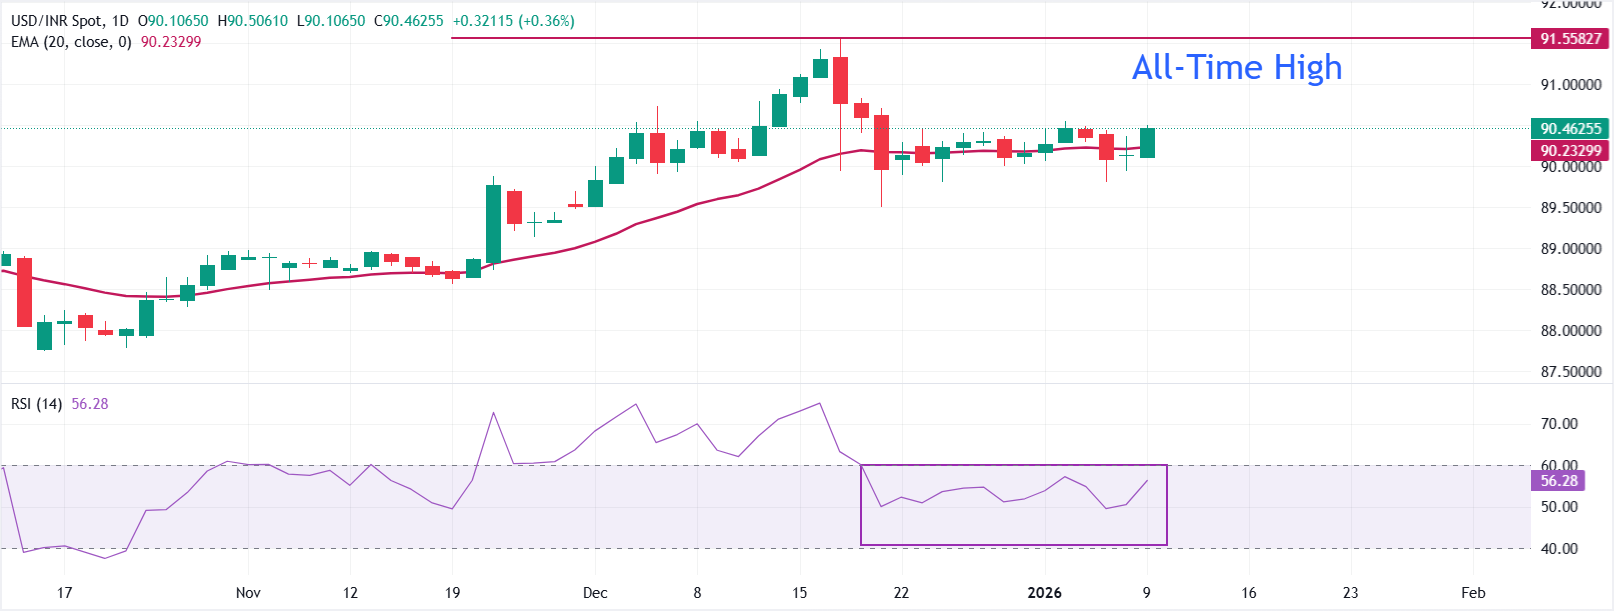
USD/INR trades higher near 90.30 at the time of writing. The 20-day Exponential Moving Average (EMA) at 90.2157 edges higher, with spot holding above it to preserve a mild bullish bias. The short-term slope has firmed after a brief pause, keeping the near-term uptrend supported.
The 14-day Relative Strength Index (RSI) at 53 (neutral) has turned higher from prior readings, aligning with a modest improvement in momentum.
A daily close back above the 20-day EMA would improve momentum and could reopen a topside extension toward the all-time high of 91.55. Failure to clear that gauge keeps a drift lower in play, which might lead to a deeper retracement toward the December 19 low of 89.50.
(The technical analysis of this story was written with the help of an AI tool.)
Economic Indicator
Nonfarm Payrolls
The Nonfarm Payrolls release presents the number of new jobs created in the US during the previous month in all non-agricultural businesses; it is released by the US Bureau of Labor Statistics (BLS). The monthly changes in payrolls can be extremely volatile. The number is also subject to strong reviews, which can also trigger volatility in the Forex board. Generally speaking, a high reading is seen as bullish for the US Dollar (USD), while a low reading is seen as bearish, although previous months' reviews and the Unemployment Rate are as relevant as the headline figure. The market's reaction, therefore, depends on how the market assesses all the data contained in the BLS report as a whole.
Read more.Next release: Fri Jan 09, 2026 13:30
Frequency: Monthly
Consensus: 60K
Previous: 64K
Source: US Bureau of Labor Statistics
America’s monthly jobs report is considered the most important economic indicator for forex traders. Released on the first Friday following the reported month, the change in the number of positions is closely correlated with the overall performance of the economy and is monitored by policymakers. Full employment is one of the Federal Reserve’s mandates and it considers developments in the labor market when setting its policies, thus impacting currencies. Despite several leading indicators shaping estimates, Nonfarm Payrolls tend to surprise markets and trigger substantial volatility. Actual figures beating the consensus tend to be USD bullish.

FXStreet
More than a million users rely on FXStreet for real-time market data, charting tools, expert insights, and forex news. Its comprehensive economic calendar and educational webinars help traders stay informed and make calculated decisions. FXStreet is supported by a team of about 60 professionals, split between the Barcelona headquarters and various global regions.
Read More


