
Trade The World
EUR/JPY Price Forecast: Tests 173.00 support near nine-day EMA
Par Akhtar Faruqui
Date de publication: 15 Sep 2025 | Date de modification: 15 Sep 2025


POPULAR ARTICLES

EUR/JPY depreciates after two days of losses, trading around 173.10 during the European hours on Monday. The technical analysis of the daily chart suggests a persistent bullish bias as the currency cross moves upwards within the ascending channel pattern.
- EUR/JPY may rebound toward 173.91, the highest since July 2024.
- The 14-day Relative Strength Index is holding above 50, indicating a sustained bullish bias.
- A break below 173.00 would prompt the currency cross to test the nine-day EMA at 172.82.
EUR/JPY depreciates after two days of losses, trading around 173.10 during the European hours on Monday. The technical analysis of the daily chart suggests a persistent bullish bias as the currency cross moves upwards within the ascending channel pattern.
The 14-day Relative Strength Index (RSI) is positioned above the 50 mark, indicating the market bias is bullish. Additionally, the short-term price momentum is strengthening as the EUR/JPY cross is positioned above the nine-day Exponential Moving Average (EMA).
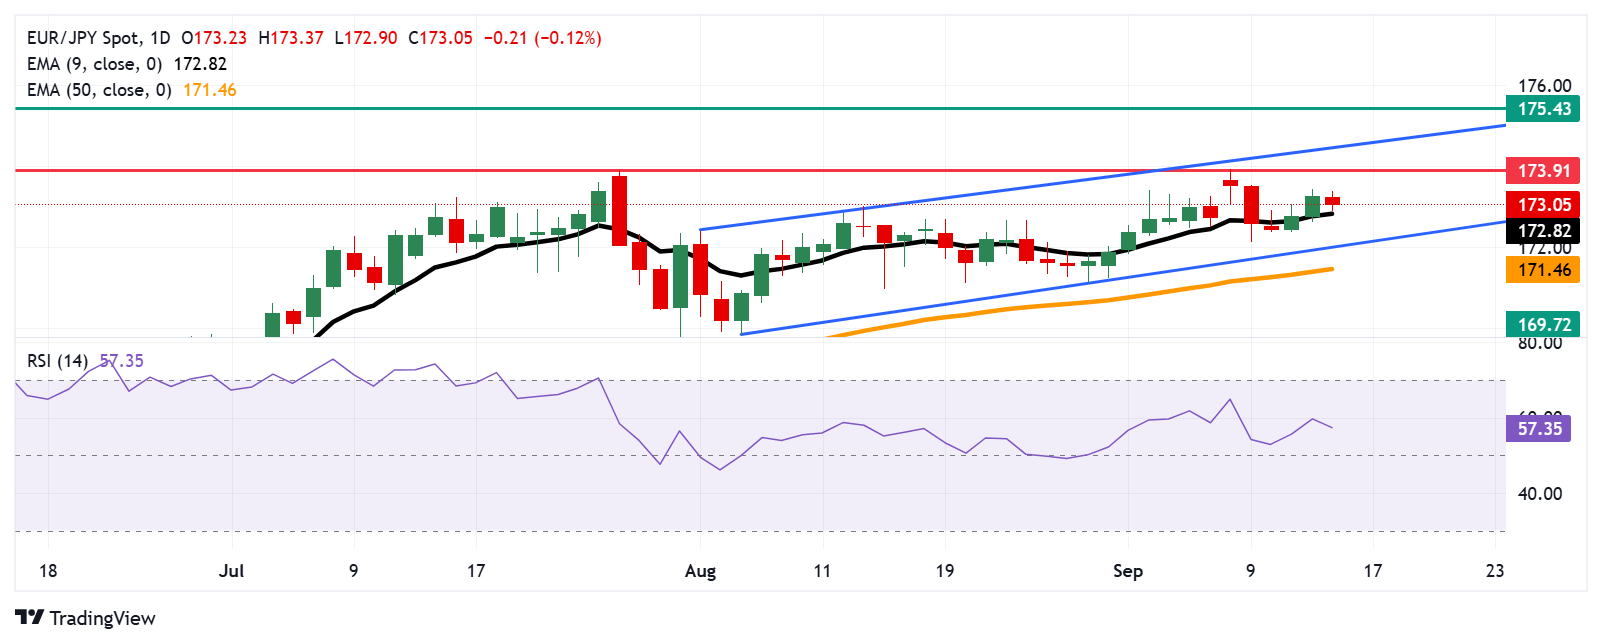
On the upside, the EUR/JPY cross may target the 173.91, the highest since July 2024, recorded on September 8, followed by the upper boundary of the ascending channel around 174.50. A break above the channel would strengthen the bullish bias and support the currency cross to approach the all-time high of 175.43, reached in July 2024.
The psychological level of 173.00 is acting as the immediate support, followed by the nine-day EMA of 172.82. A break below this level would weaken the short-term price momentum and prompt the EUR/JPY cross to approach the ascending channel’s lower boundary around the crucial level of 172.00. Further declines below the channel would weaken the bullish bias and put downward pressure on the currency cross to test the 50-day EMA at 171.46.
EUR/JPY: Daily Chart
Euro Price Today
The table below shows the percentage change of Euro (EUR) against listed major currencies today. Euro was the weakest against the Japanese Yen.
| USD | EUR | GBP | JPY | CAD | AUD | NZD | CHF | |
|---|---|---|---|---|---|---|---|---|
| USD | -0.05% | -0.22% | -0.16% | -0.05% | -0.24% | -0.16% | -0.07% | |
| EUR | 0.05% | -0.14% | -0.19% | 0.00% | -0.15% | -0.15% | -0.03% | |
| GBP | 0.22% | 0.14% | 0.04% | 0.15% | -0.01% | -0.01% | -0.00% | |
| JPY | 0.16% | 0.19% | -0.04% | 0.09% | -0.03% | -0.01% | 0.10% | |
| CAD | 0.05% | -0.01% | -0.15% | -0.09% | -0.08% | -0.16% | -0.15% | |
| AUD | 0.24% | 0.15% | 0.01% | 0.03% | 0.08% | 0.00% | 0.07% | |
| NZD | 0.16% | 0.15% | 0.01% | 0.00% | 0.16% | -0.00% | 0.00% | |
| CHF | 0.07% | 0.03% | 0.00% | -0.10% | 0.15% | -0.07% | -0.01% |
The heat map shows percentage changes of major currencies against each other. The base currency is picked from the left column, while the quote currency is picked from the top row. For example, if you pick the Euro from the left column and move along the horizontal line to the US Dollar, the percentage change displayed in the box will represent EUR (base)/USD (quote).

Acuity Trading
Acuity Trading est une fintech basée à Londres fondée en 2013, spécialisée dans les données alternatives et l’analyse de sentiment alimentées par l’IA pour le trading et l’investissement. Ils ont révolutionné le trading en ligne avec des outils visuels de news et de sentiment, et continuent de mener le marché grâce à des données alternatives génératrices d’alpha et des outils de trading très engageants basés sur les recherches et technologies IA les plus récentes.
Read More


