
Trade The World
GBP/USD Price Forecast: Tests the confluence zone around 1.3500, nine-day EMA support
Par Akhtar Faruqui
Date de publication: 29 Aug 2025 | Date de modification: 29 Aug 2025


POPULAR ARTICLES

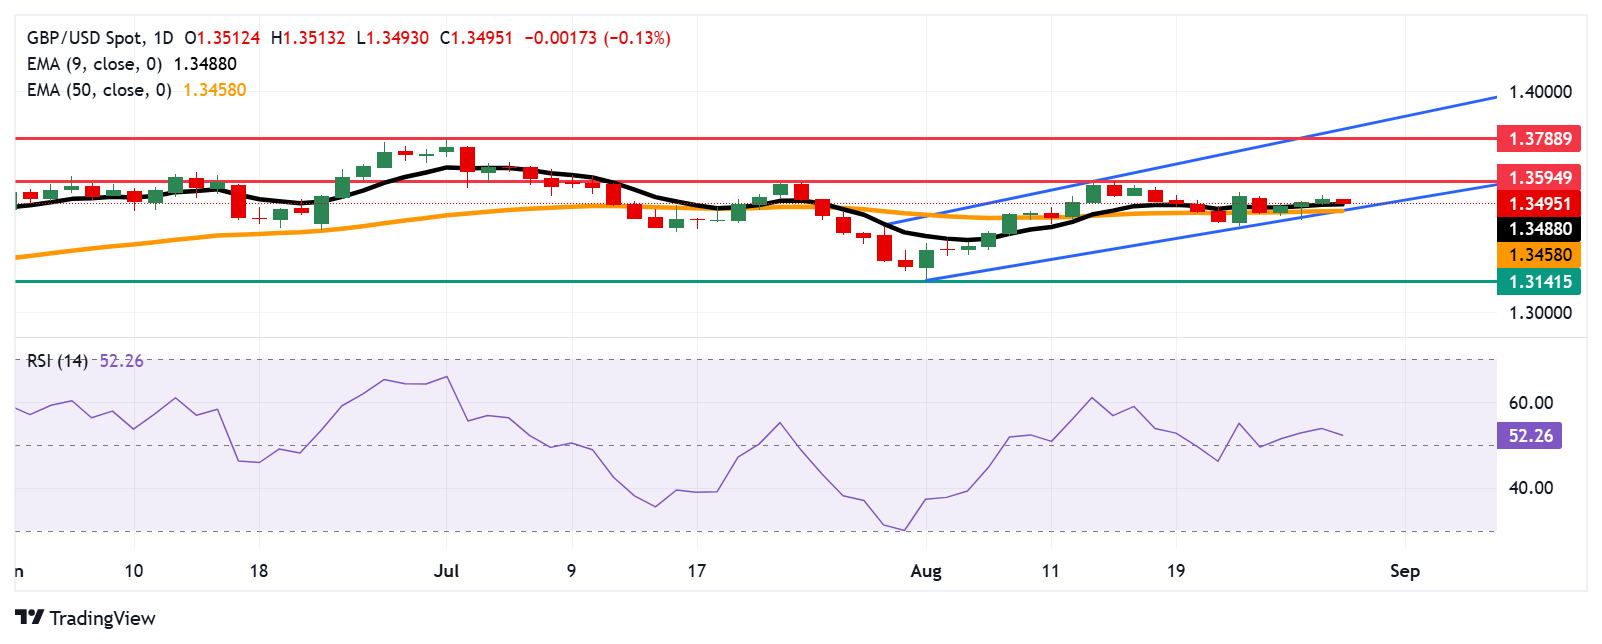
The GBP/USD pair halts its three-day winning streak, trading around 1.3500 during the Asian hours on Friday. The bullish bias prevails as the daily chart’s technical analysis suggests that the pair remains within the ascending channel pattern.
- GBP/USD may find the initial barrier at the monthly high of 1.3594.
- The 14-day Relative Strength Index holds above the 50 mark, reinforcing the bullish bias.
- The primary support lies at the nine-day EMA of 1.3488.
The GBP/USD pair halts its three-day winning streak, trading around 1.3500 during the Asian hours on Friday. The bullish bias prevails as the daily chart’s technical analysis suggests that the pair remains within the ascending channel pattern.
The 14-day Relative Strength Index (RSI) is positioned above the 50 level, strengthening the bullish bias. Additionally, the GBP/USD pair remains above the nine-day Exponential Moving Average (EMA), suggesting the short-term price momentum is stronger.
On the upside, the GBP/USD pair may target the monthly high at 1.3594, which was reached on August 14. A break above this level could reinforce the bullish bias and support the pair to approach the 1.3788, the highest since October 2021, which was recorded on July 1. Further advances could prompt the pair to test the upper boundary of the ascending channel around 1.3840.
The GBP/USD pair could find the primary support at the nine-day EMA of 1.3488, followed by the 50-day EMA at 1.3458, aligned with the ascending channel’s lower boundary. A break below this crucial support zone would cause the emergence of the bearish bias and put downward pressure on the pair to navigate the region around the four-month low of 1.3141, which was recorded on May 12.
GBP/USD: Daily Chart
Pound Sterling Price Today
The table below shows the percentage change of British Pound (GBP) against listed major currencies today. British Pound was the weakest against the Australian Dollar.
| USD | EUR | GBP | JPY | CAD | AUD | NZD | CHF | |
|---|---|---|---|---|---|---|---|---|
| USD | 0.17% | 0.13% | 0.12% | 0.04% | -0.10% | -0.09% | 0.17% | |
| EUR | -0.17% | -0.03% | -0.07% | -0.13% | -0.21% | -0.26% | -0.01% | |
| GBP | -0.13% | 0.03% | -0.08% | -0.09% | -0.19% | -0.17% | 0.02% | |
| JPY | -0.12% | 0.07% | 0.08% | -0.00% | -0.23% | -0.18% | 0.13% | |
| CAD | -0.04% | 0.13% | 0.09% | 0.00% | -0.17% | -0.11% | 0.11% | |
| AUD | 0.10% | 0.21% | 0.19% | 0.23% | 0.17% | -0.03% | 0.20% | |
| NZD | 0.09% | 0.26% | 0.17% | 0.18% | 0.11% | 0.03% | 0.25% | |
| CHF | -0.17% | 0.01% | -0.02% | -0.13% | -0.11% | -0.20% | -0.25% |
The heat map shows percentage changes of major currencies against each other. The base currency is picked from the left column, while the quote currency is picked from the top row. For example, if you pick the British Pound from the left column and move along the horizontal line to the US Dollar, the percentage change displayed in the box will represent GBP (base)/USD (quote).

Acuity Trading
Acuity Trading est une fintech basée à Londres fondée en 2013, spécialisée dans les données alternatives et l’analyse de sentiment alimentées par l’IA pour le trading et l’investissement. Ils ont révolutionné le trading en ligne avec des outils visuels de news et de sentiment, et continuent de mener le marché grâce à des données alternatives génératrices d’alpha et des outils de trading très engageants basés sur les recherches et technologies IA les plus récentes.
Read More


