Overall, the recent selloff in gold does not signal the collapse of the safe-haven thesis. Instead, it reflects short-term macro repricing driven by war-related inflation concerns. Historical experience suggests that after near-term turbulence, gold retains solid medium- to long-term upside potential. The current price range, particularly around $5,000–$5,100, may represent a positioning window following panic-driven selling, providing an opportunity for the continuation of a structural bull market.
In the early stages of the conflict, Middle East tensions escalated sharply as the United States and Israel launched airstrikes on Iran, with Iranian retaliation involving the Strait of Hormuz. Fears of disrupted oil transportation quickly emerged, and safe-haven flows poured into gold. April gold futures briefly broke above $5,400 per ounce. Crude oil prices surged, intensifying market anxiety. During this phase, geopolitical uncertainty was the primary driver of gold’s short-term rally.
As the conflict dragged on, soaring oil prices fueled inflation expectations, prompting investors to reprice the Federal Reserve’s policy path. Rate-cut expectations were sharply reduced, the 10-year U.S. Treasury yield rose to around 4.1%–4.15%, and the U.S. dollar index rebounded toward 99. Higher yields and a stronger dollar increased the opportunity cost of holding gold, causing macro pressures to outweigh short-term safe-haven demand. Gold recorded a one-day decline of roughly 4%, illustrating the double-edged nature of war: geopolitical support for gold exists but is offset by inflation fears and dollar strength.
Subsequently, the U.S. Labor Department reported weekly initial jobless claims of 213,000, in line with expectations. The stable data eased concerns of a hard economic landing, triggering a technical rebound in gold. This recovery was driven primarily by short covering and dip buying. However, the core macro pressures remain unresolved, leaving the market in a state of elevated short-term volatility.
The central reason behind the temporary weakening of gold’s safe-haven performance lies in war-driven inflation pressures and the repricing of the Fed’s policy path. Risks to the Strait of Hormuz pushed oil prices up by about $10 per barrel, potentially adding approximately 0.2–0.3 percentage points to U.S. CPI. Markets fear that the Fed may maintain higher interest rates to combat inflation, increasing the opportunity cost of holding gold. Meanwhile, fading rate-cut expectations, rising real yields, and a stronger dollar have raised the cost of gold purchases for non-U.S. investors.
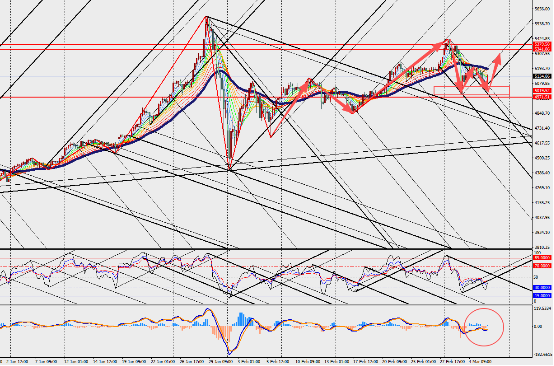
Market Interpretation:
On the four-hour chart, gold is consolidating with a rebound, while MACD lines and volume indicators expand below the zero axis. Structural factors continue to support prices, including sustained central bank buying in emerging markets, long positioning in ETFs, and stable mine supply. The current pattern resembles the early phase of the Russia–Ukraine conflict in 2022, when gold initially surged and then retraced. In the short term, gold may remain range-bound with a slightly weaker bias. Investors should closely monitor upcoming U.S. February nonfarm payroll and CPI data.