
Trade The World
AB, Quant, and Starknet hold gains as Bitcoin drops below $100,000
Par Vishal Dixit
Date de publication: 14 Nov 2025 | Date de modification: 14 Nov 2025


POPULAR ARTICLES

Altcoins, AB (AB), Quant (QNT), and Starknet (STRK) sustain gains made in the last 24 hours, as Bitcoin trades below $100,000 by press time on Friday, logging a nearly 5% drop so far this week.
- AB trades near the 100-day EMA after an 18% surge on Thursday, aiming for a potential breakout.
- Quant extends gains with a breakout from a consolidation range as bullish momentum steadies.
- Starknet rebounds from the 100-day EMA on Thursday, targeting the 200-day EMA breakout.
Altcoins, AB (AB), Quant (QNT), and Starknet (STRK) sustain gains made in the last 24 hours, as Bitcoin trades below $100,000 by press time on Friday, logging a nearly 5% drop so far this week. The technical outlook highlights QNT extending its range breakout rally while AB and STRK face overhead pressure, risking a potential pullback later in the day.
Bitcoin risks falling under $95,000
Bitcoin approaches the $98,200 support level marked by the June 22 low, with the fourth consecutive bearish candle on the daily chart. The extended correction this week marks the lowest daily close since May 7 and fuels the downside shift in the 50-day Exponential Moving Average (EMA), aiming for a Death Cross pattern with the 200-day EMA.
The correction in Bitcoin and altcoins mimics the pullback from Wall Street and Asian markets, which is underpinned by the lack of unemployment data in the October US jobs report and the reduced chances of a potential interest rate cut in December.
The technical indicators on the daily chart reflect a bearish trend as the Relative Strength Index (RSI) moves away from the midline, inching towards the oversold zone with rising selling pressure. If RSI extends oscillation near oversold levels, it could indicate a steady bearish momentum.
At the same time, the Moving Average Convergence Divergence (MACD) reverses from the signal line, extending the downtrend and sell indication on Bitcoin.
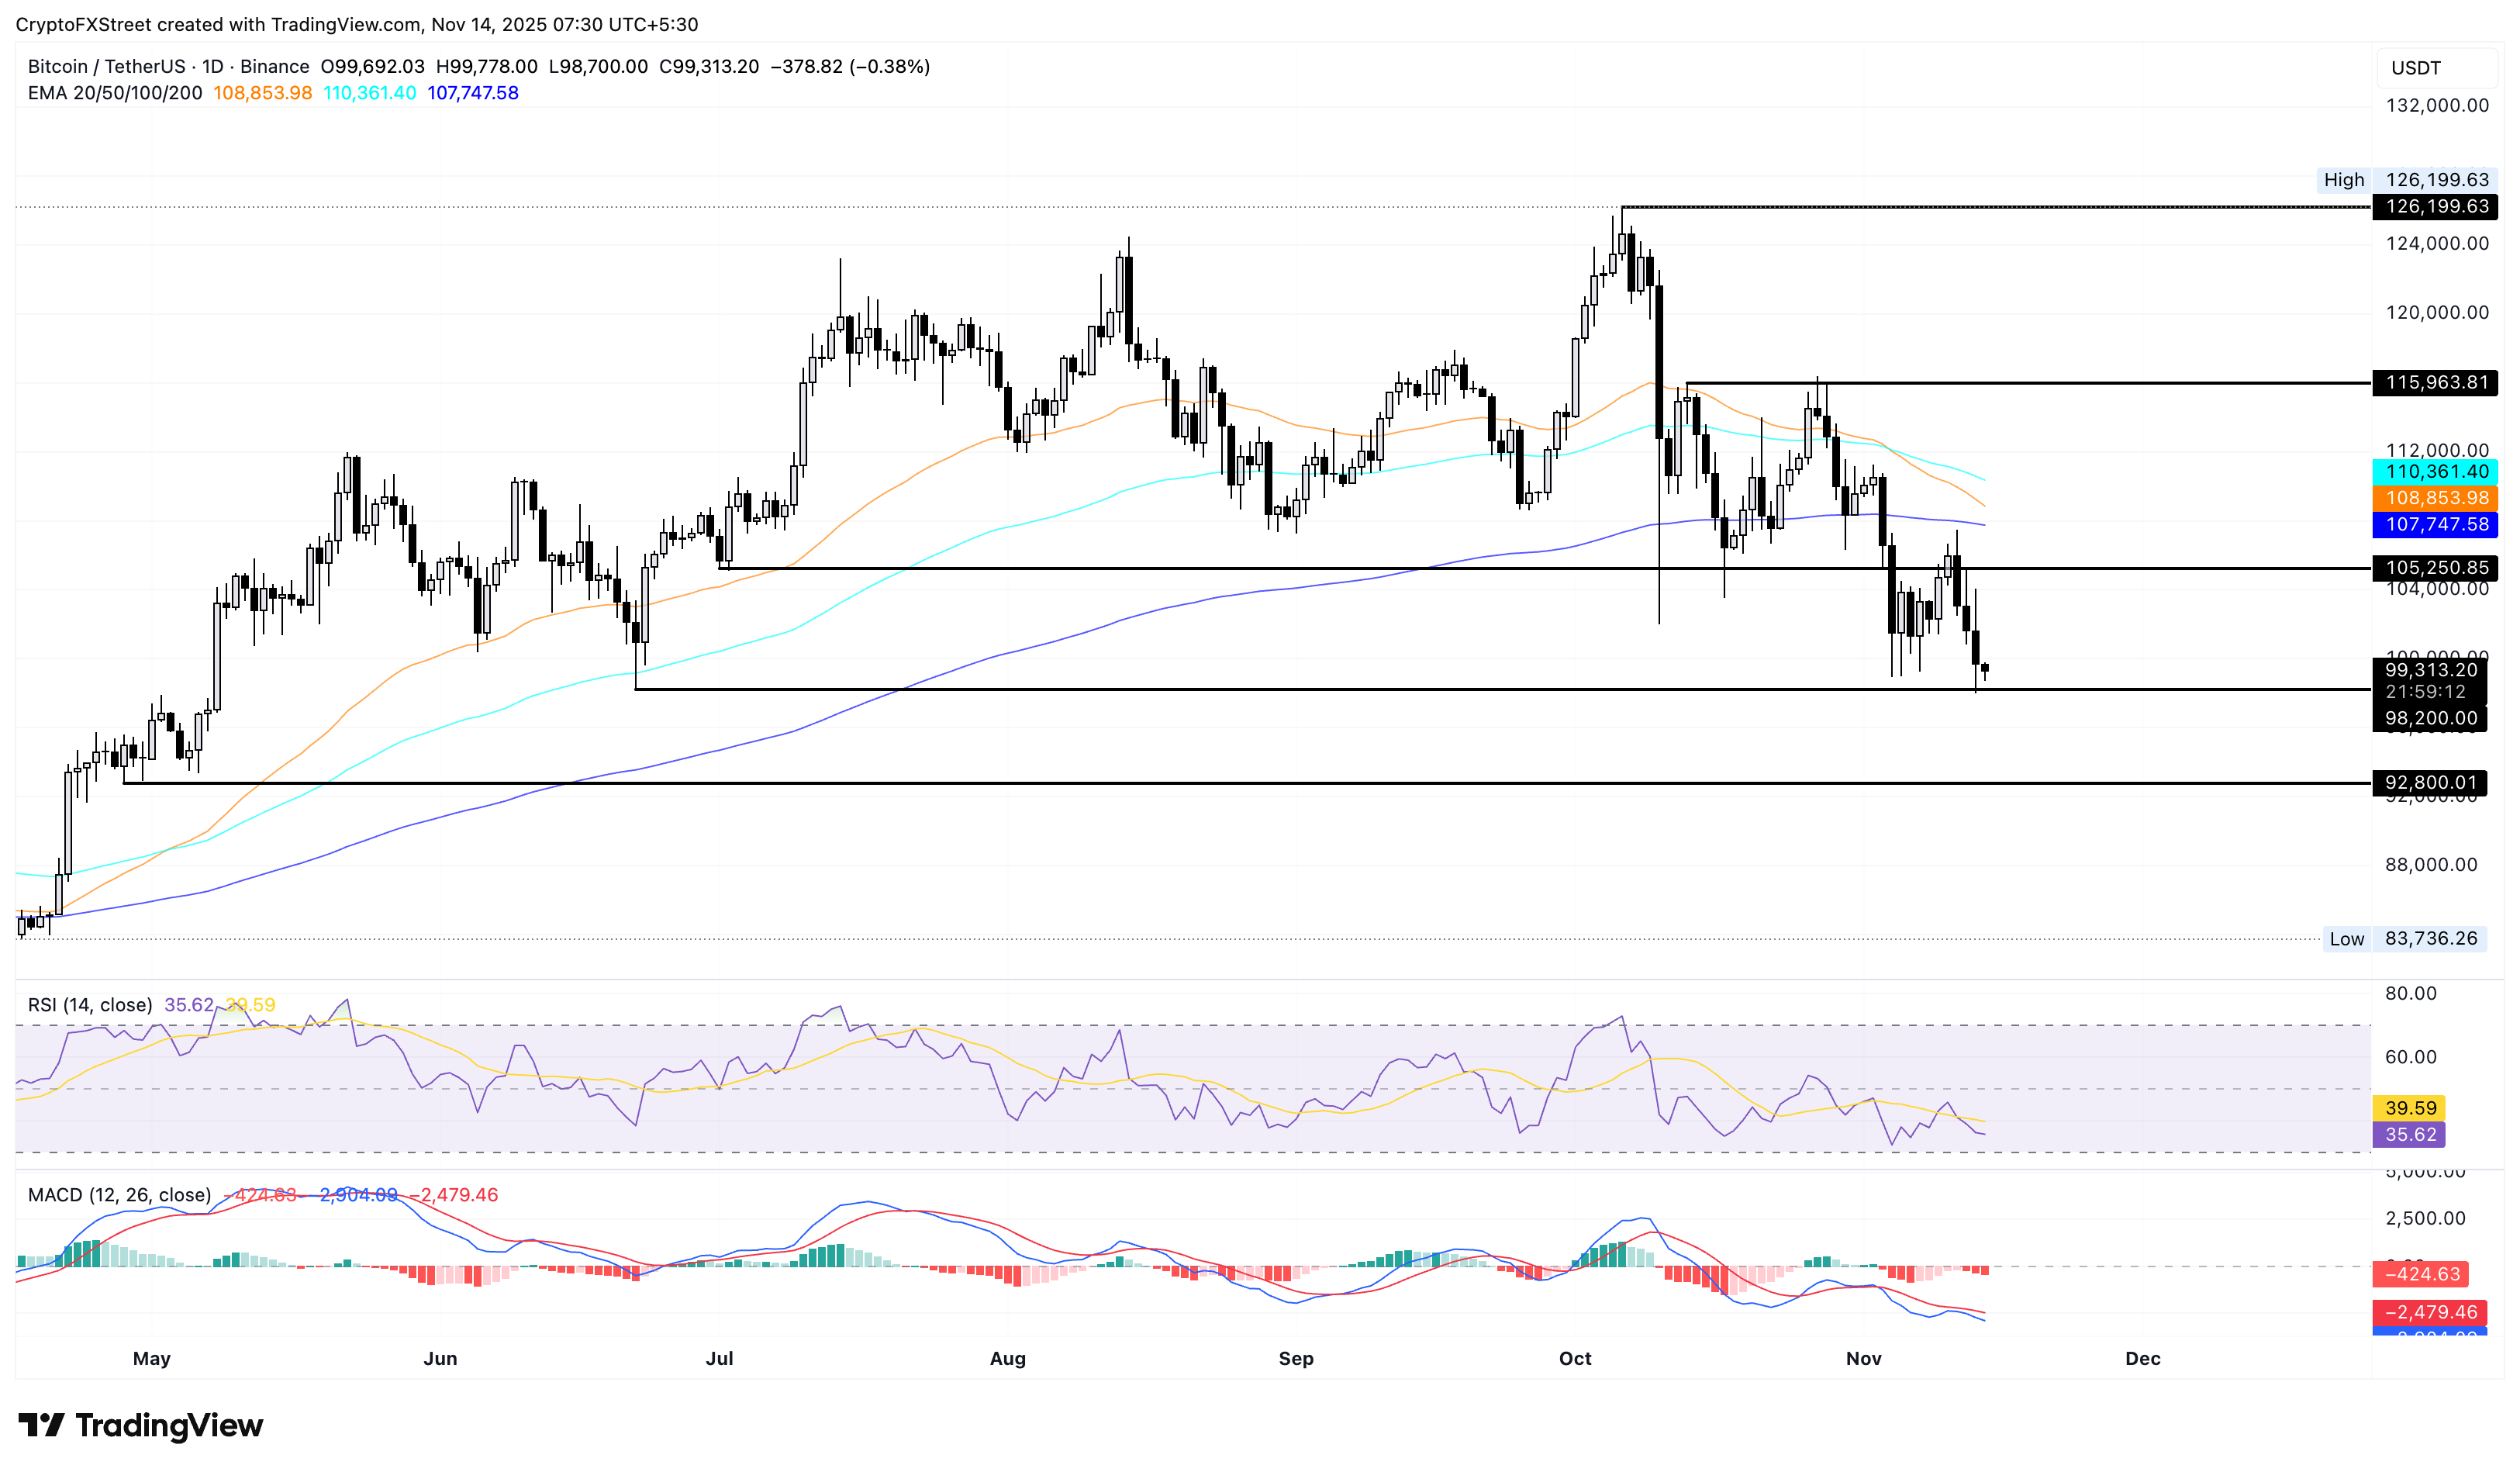
If BTC drops under $98,200, it could test the $92,800 low from April 28.
AB rally halts at the 100-day EMA
AB holds steady near the 100-day EMA at $0.007588 at press time on Friday, sustaining the 18% gains from Thursday. A decisive close above this moving average would require exceeding the 200-day EMA at $0.007943 to reinstate an uptrend, which could target the R2 Pivot Point at $0.009577.
The recovery run in AB gains traction as the RSI is at 69 on the daily chart, turning flat near the overbought zone. Meanwhile, the MACD extends an uptrend above the signal line after a crossover on Tuesday.
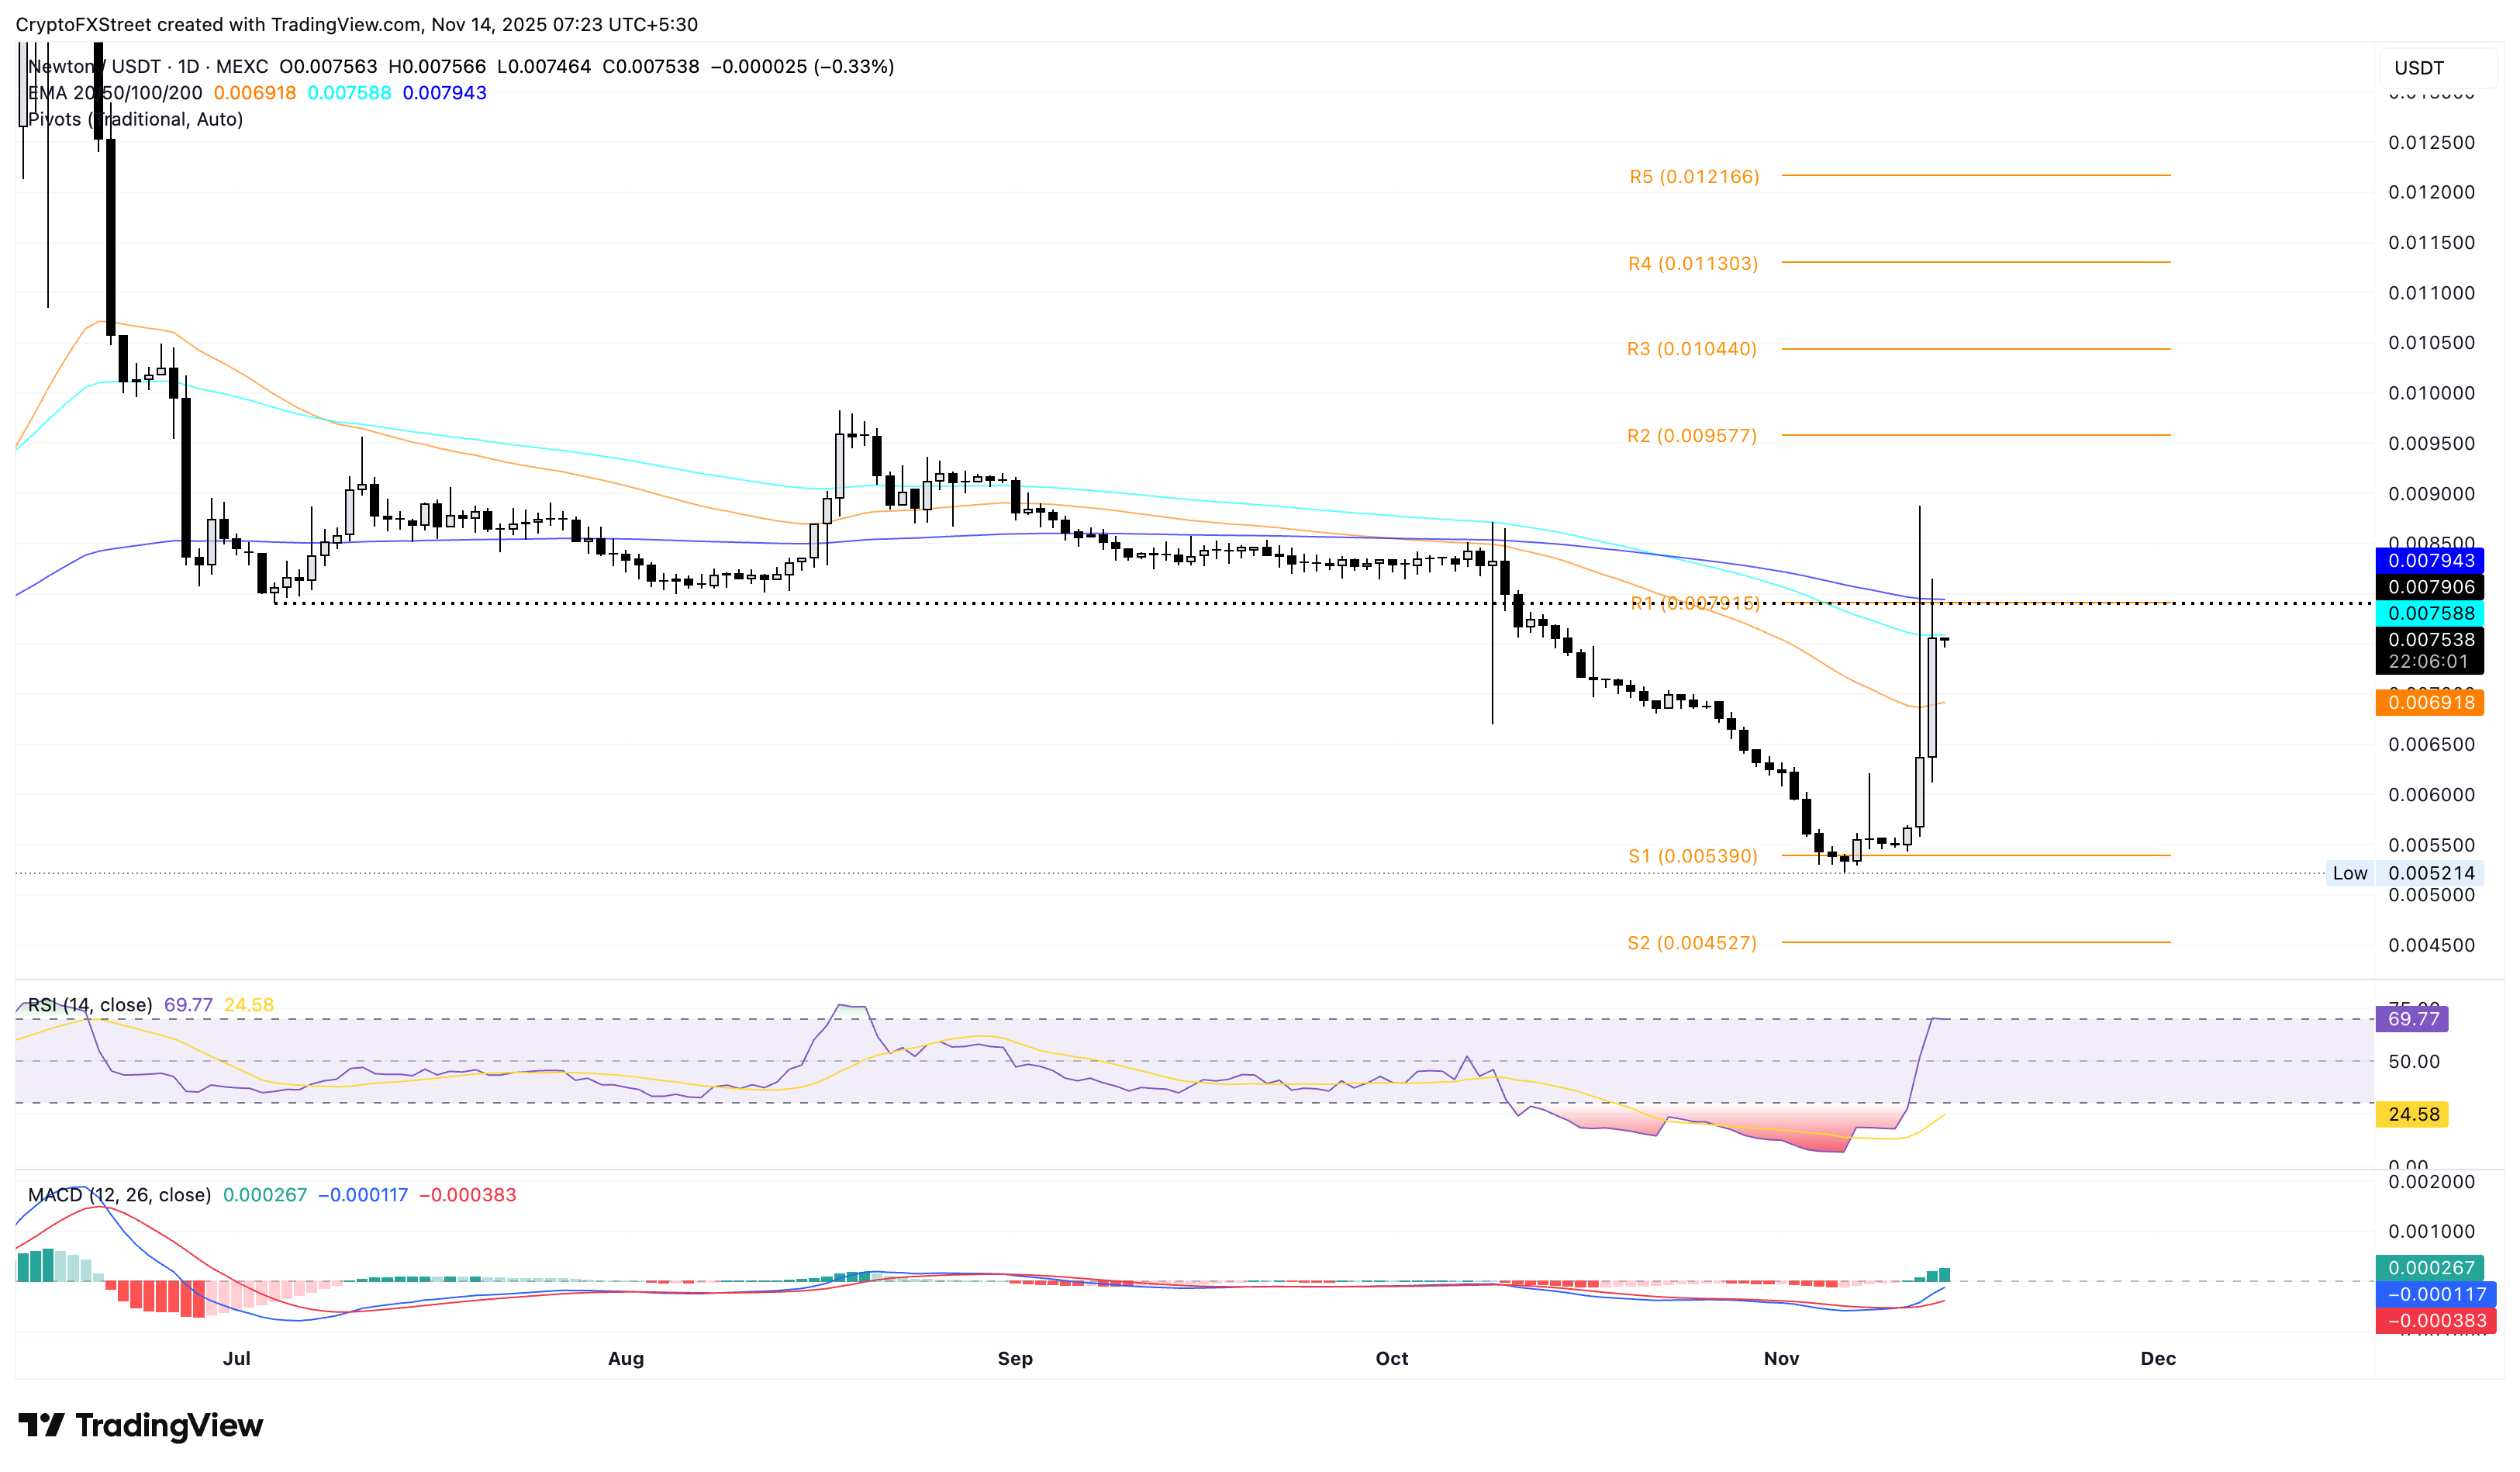
However, the long wick candles in the past two days reflect strong overhead supply pressure near the 200-day EMA. If bullish exhaustion kicks in, the overhead pressure could cause AB to revert to the 50-day EMA at $0.006918.
Quant’s range breakout rally gains traction
Quant extends the breakout of a consolidation range on the 4-hour chart, as previously anticipated by FXStreet. The QNT price is approaching the $94 resistance, marked by the October 13 high.
If the breakout rally exceeds this level, QNT could test the $100 psychological level. Furthermore, the recovery run fuels the upshift in the 50-day EMA, increasing the chances of a Golden Cross pattern with the 200-day EMA.
Similar to AB, the momentum indicators signal strong bullish momentum for Quant.
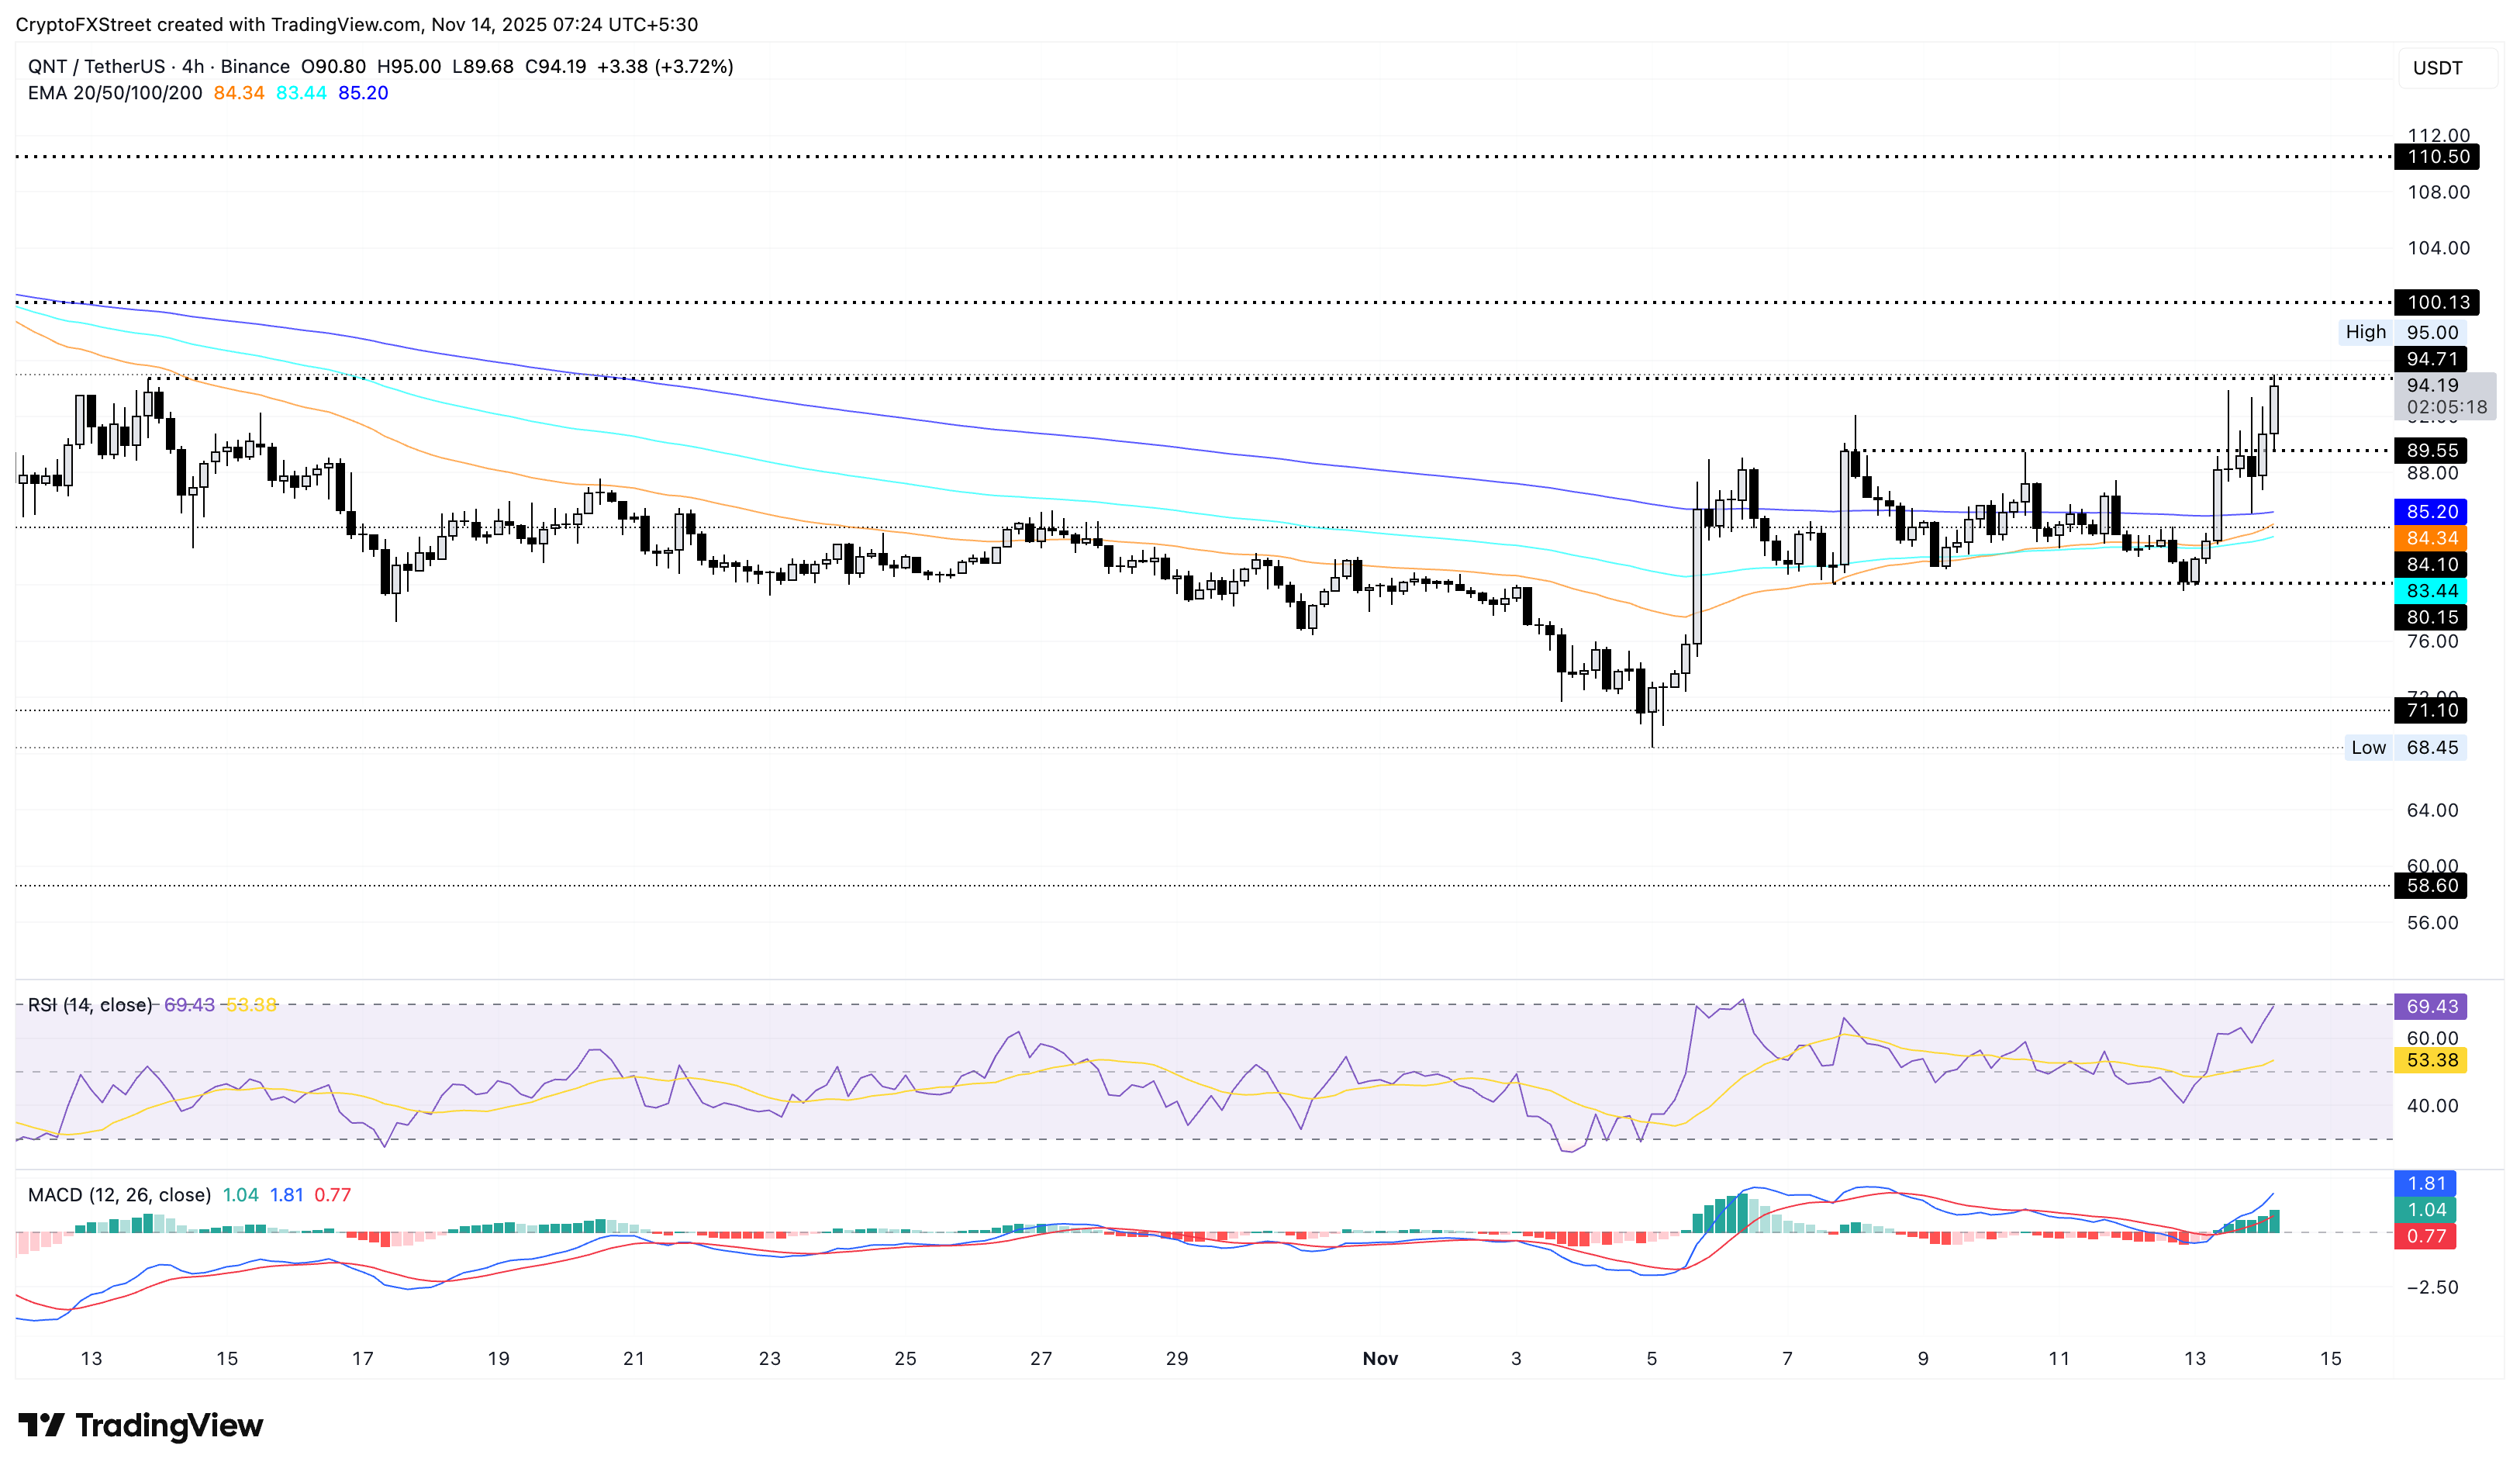
On the other hand, QNT could find support at the $89 level, which has acted as the resistance of the consolidation range, followed by the 200-day EMA at $85.
Starknet steadies between crucial moving averages
Starknet fluctuates in a range movement bound between the $0.1956 ceiling from March 6 high and the low of $0.0962 from June 22. At the time of writing, STRK steadies on Friday between the converging 50- and 200-day EMAs, after a near 8% rise on Thursday.
If the STRK price exceeds the 200-day EMA at $0.1618, it could target the $0.1956 ceiling.
However, the momentum indicators signal lukewarm bullishness as the RSI at 56 holds above the halfway line while the MACD and signal line take a lateral break from the uptrend.
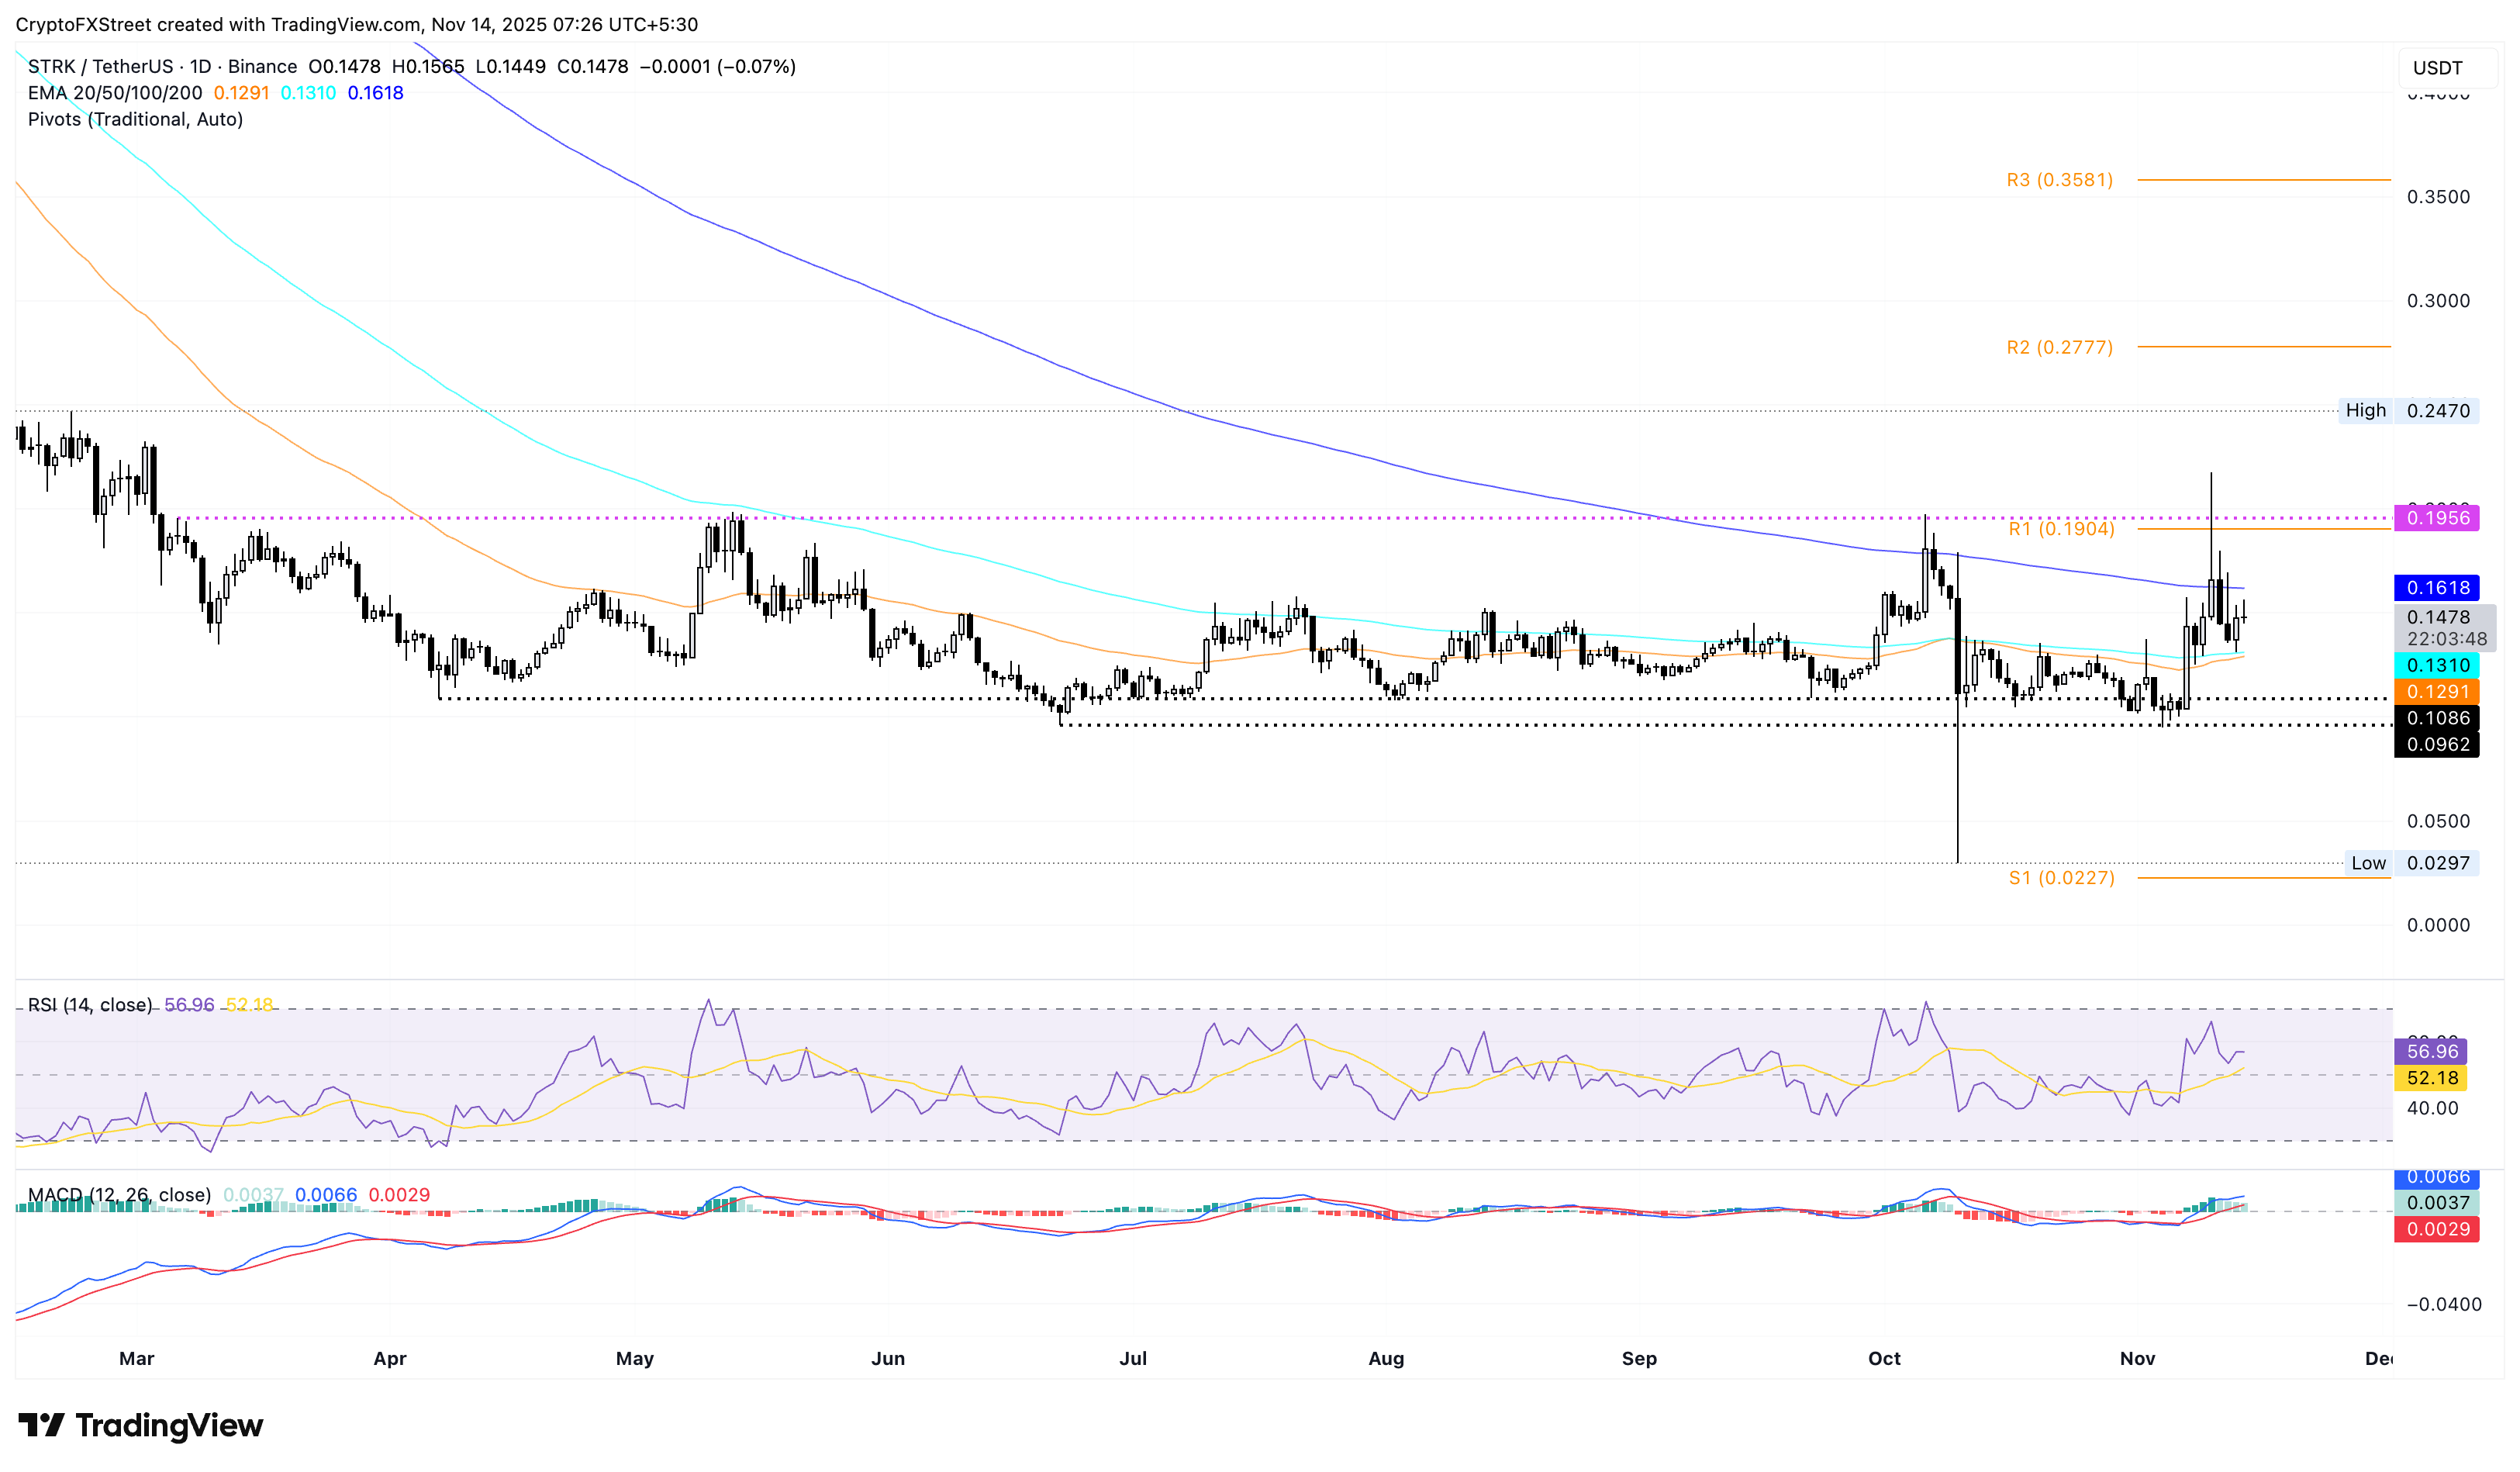
Looking down, if STRK slips below the 50-day EMA at $0.1291, it could result in a drop to $0.9962.
(This story was corrected on November 14 at 4:14 GMT to say, in the heading, that Bitcoin drops below $100,000.)

FXStreet
Plus d’un million d’utilisateurs se tournent vers FXStreet pour des données de marché en temps réel, des outils de graphiques, des analyses d’experts et des actualités Forex. Leur calendrier économique complet et leurs webinaires éducatifs aident les traders à rester informés et à prendre des décisions éclairées. FXStreet s’appuie sur une équipe d’environ 60 professionnels répartis entre le siège de Barcelone et diverses régions du monde.
Read More


