
Aptos Price Forecast: Rally extends to fourth day amid $50 million commitment for ecosystem development
Par Vishal Dixit
Mis à jour: 8 May 2026


ARTICLES POPULAIRES

Aptos (APT) trades above $1.00 on Friday, extending a four-day rally and retesting levels not seen since the end of March amid the announcement that the Aptos Foundation and AptosLabs have committed over $50 million to infrastructure development.
- Aptos edges further above $1.00 on Friday, extending its rally for a fourth consecutive day which led prices to break above a long-resistance descending trendline.
- The Aptos Foundation and AptosLabs announce over $50 million for ecosystem development, including a strategic fund for trading and AI partners.
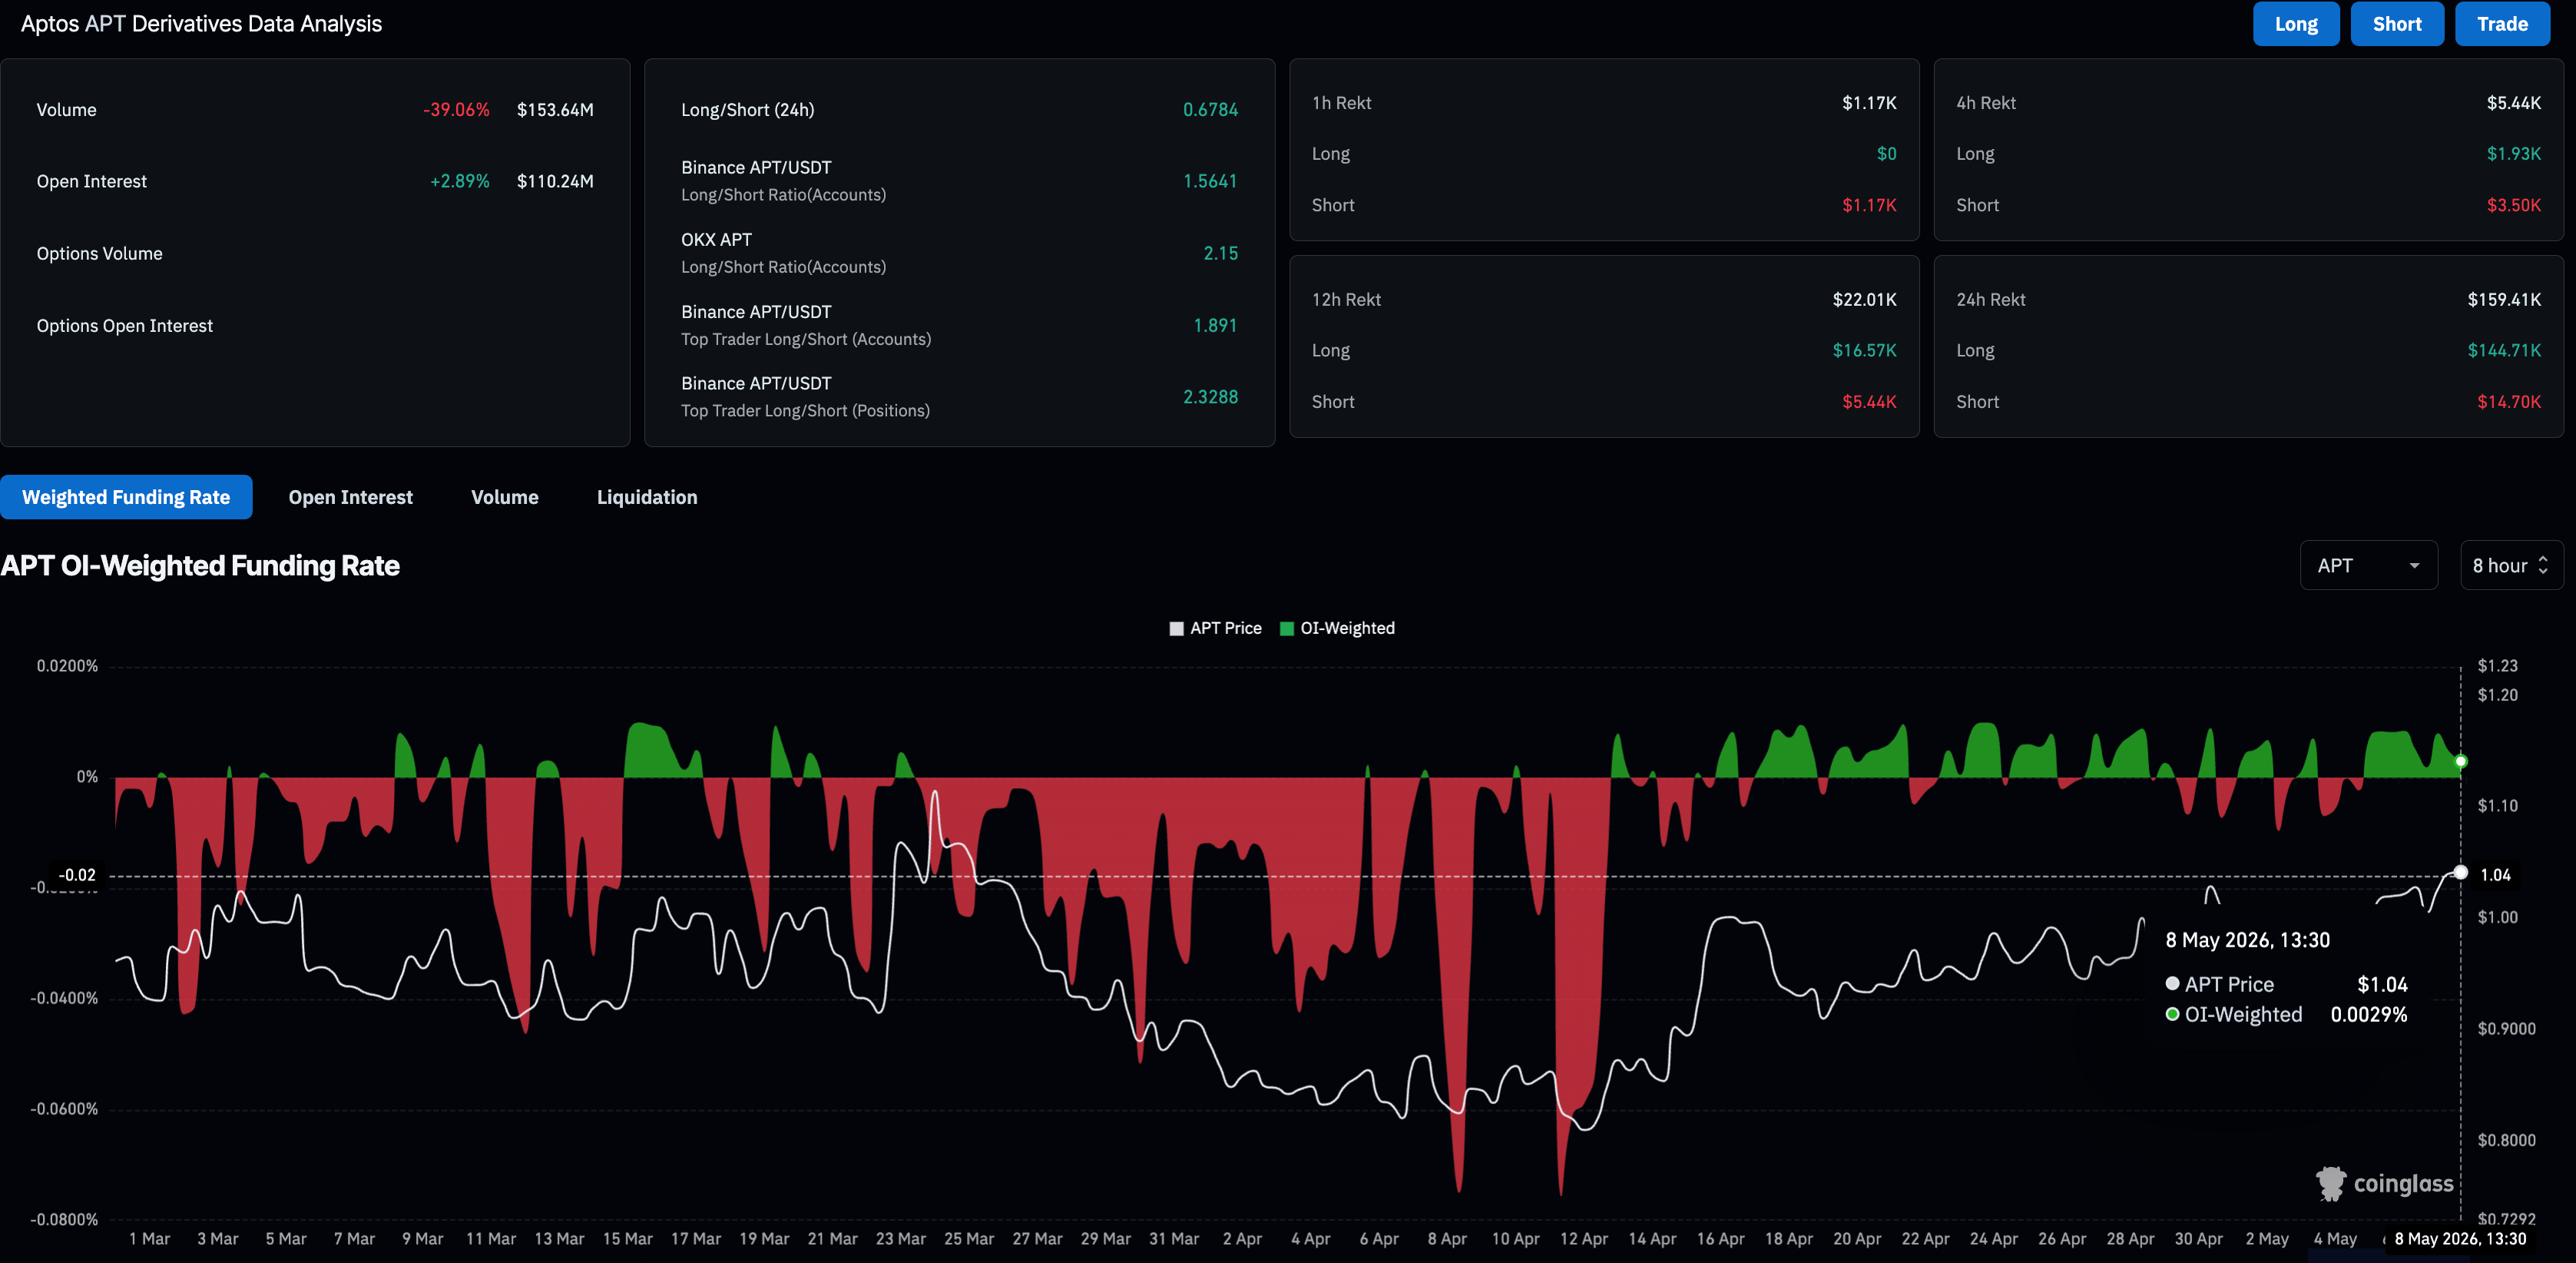
- Derivatives data show a mild increase in retail strength with a positional buildup in Aptos futures.
Aptos (APT) trades above $1.00 on Friday, extending a four-day rally and retesting levels not seen since the end of March amid the announcement that the Aptos Foundation and AptosLabs have committed over $50 million to infrastructure development.
New $50 million infrastructure commitment fuels retail strength
The Aptos Foundation and AptosLabs announced over $50 million for ecosystem development on Friday. The infrastructure development will include funding for first-party products, research, protocol infrastructure and a strategic fund for trading and AI partners.
The commitment is aimed at building institutional grade execution and autonomous solutions, according to the announcement. Upcoming features on Aptos aim to build an encrypted mempool, improve institutional connectivity with a multi-leader consensus, and privacy-focused perpetual trading powered by the APT tokens, which burns on use, gates access, and unlocks performance via staking.
On the derivatives side, Aptos is gaining retail strength. CoinGlass data shows the Aptos futures Open Interest (OI) is up over 2% in the last 24 hours, reaching $110.24 million, indicating a rise in active positions or leverage exposure. At the same time, the OI-weighted funding rate is at 0.0029%, reflecting a bullish incline among traders to buy long positions at a premium.
Technical Analysis: Aptos rally has further room to run
Aptos trades around $1.0430 at press time on Friday, holding above the 50-day Exponential Moving Average (EMA) at $0.9746 after reclaiming the broken downward resistance line around $0.9850, which now acts as a nearby support area. This keeps the near-term tone neutral-to-bullish despite the broader downtrend backdrop, as the token still trades well beneath the 100-day EMA at $1.1357 and the 200-day EMA at $1.7308.
Momentum readings on the daily chart back the latest recovery attempt, with the Relative Strength Index (RSI) at 63 pushing towards the overbought zone, while the Moving Average Convergence Divergence (MACD) line is holding above its signal line, hinting that buying pressure is building rather than fading.
On the topside, initial resistance emerges at the March 24 high at $1.1250, close to the 100-day EMA near $1.1360, which guards the path toward the more distant February 1 high at $1.3020, where the broader bearish structure would be challenged.
On the downside, immediate support is seen at the former trendline break area near $0.9850, followed by the 50-day EMA at $0.9750. A daily close back below this zone would weaken the constructive bias and expose a deeper pullback toward earlier lows.
(The technical analysis of this story was written with the help of an AI tool.)

Plus d’un million d’utilisateurs se tournent vers FXStreet pour des données de marché en temps réel, des outils de graphiques, des analyses d’experts et des actualités Forex. Leur calendrier économique complet et leurs webinaires éducatifs aident les traders à rester informés et à prendre des décisions éclairées. FXStreet s’appuie sur une équipe d’environ 60 professionnels répartis entre le siège de Barcelone et diverses régions du monde.
Lire la suite


