
Bitcoin Price Forecast: BTC edges down as Trump rejection of Iran peace plan weighs on sentiment
Par Manish Chhetri
Mis à jour: 11 May 2026


ARTICLES POPULAIRES

Bitcoin (BTC) trades lower on Monday, below $81,000 as of writing, after surging over 4.5% the previous week. Institutional demand supported BTC’s bullish price action, with spot Exchange Traded Funds (ETFs) recording their sixth consecutive week of inflows.
- Bitcoin falls on Monday after gaining over 4.5% the previous week.
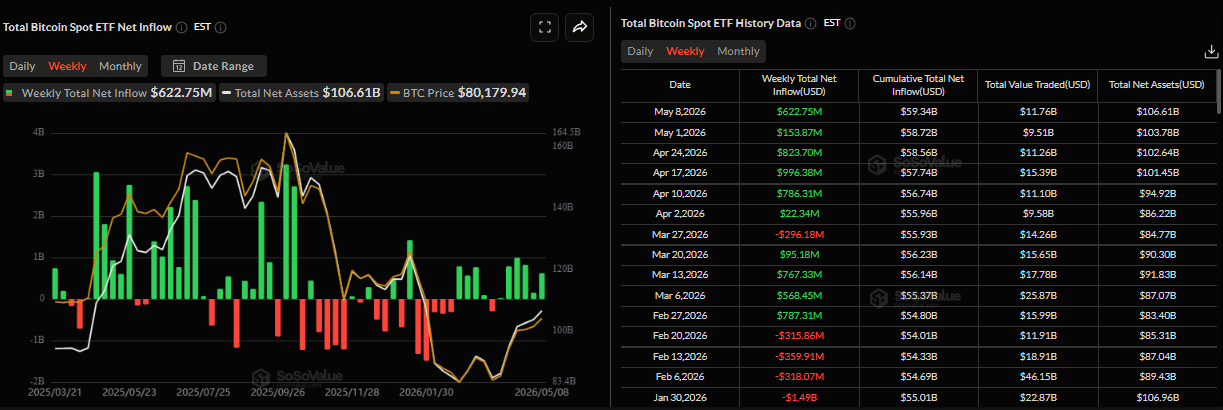
- Demand from US-listed spot BTC ETFs remained strong last week, with around $623 million in inflows, marking the sixth consecutive week of gains.
- Risk sentiment weakens to start the week as Trump rejects fresh peace offer from Iran.
Bitcoin (BTC) trades lower on Monday, below $81,000 as of writing, after surging over 4.5% the previous week. Institutional demand supported BTC’s bullish price action, with spot Exchange Traded Funds (ETFs) recording their sixth consecutive week of inflows. However, risk sentiment fades as renewed tensions in the Strait of Hormuz overshadow earlier optimism about a possible US-Iran peace deal, limiting the Crypto Kings’ upside.
Strong institutional demand supports BTC’s gains
Bitcoin’s price surge last week was supported by strong institutional demand. SoSoValue data showed that Bitcoin spot ETFs recorded weekly inflows of $622.75 million, marking the sixth consecutive week of positive flows. If this trend continues and intensifies, BTC could see further gains ahead.
Geopolitical risks limit BTC’s upside momentum
Risk sentiment dampened as the optimism over a potential US-Iran peace deal and the de-escalation of conflict faded quickly amid renewed hostilities in the Strait of Hormuz.
US President Donald Trump and Iran both rejected each other’s peace proposals for ending the war and the gradual reopening of the Strait of Hormuz amid major disagreements over Iran’s nuclear program.
In fact, the Wall Street Journal reported that Iran has rejected US demands to dismantle its nuclear facilities and suspend uranium enrichment for 20 years. Trump quickly lashed out at the Iranian response, calling it “totally unacceptable.”
These recent developments keep geopolitical risks in play and put a lid on risk appetite on Monday, driving risky assets such as BTC to correct slightly.
Some signs of concerns
Whale alert user on X posted on Sunday that a dormant BTC wallet containing 500 BTC, worth $40.71 million, has been activated after 12.5 years. However, the reason for this transfer remains unclear. Sometimes, a dormant wallet moves tokens for address management or security purposes, which does not indicate concern. But if these coins are moved to exchanges (to book profits), it could increase short-term selling pressure in BTC.
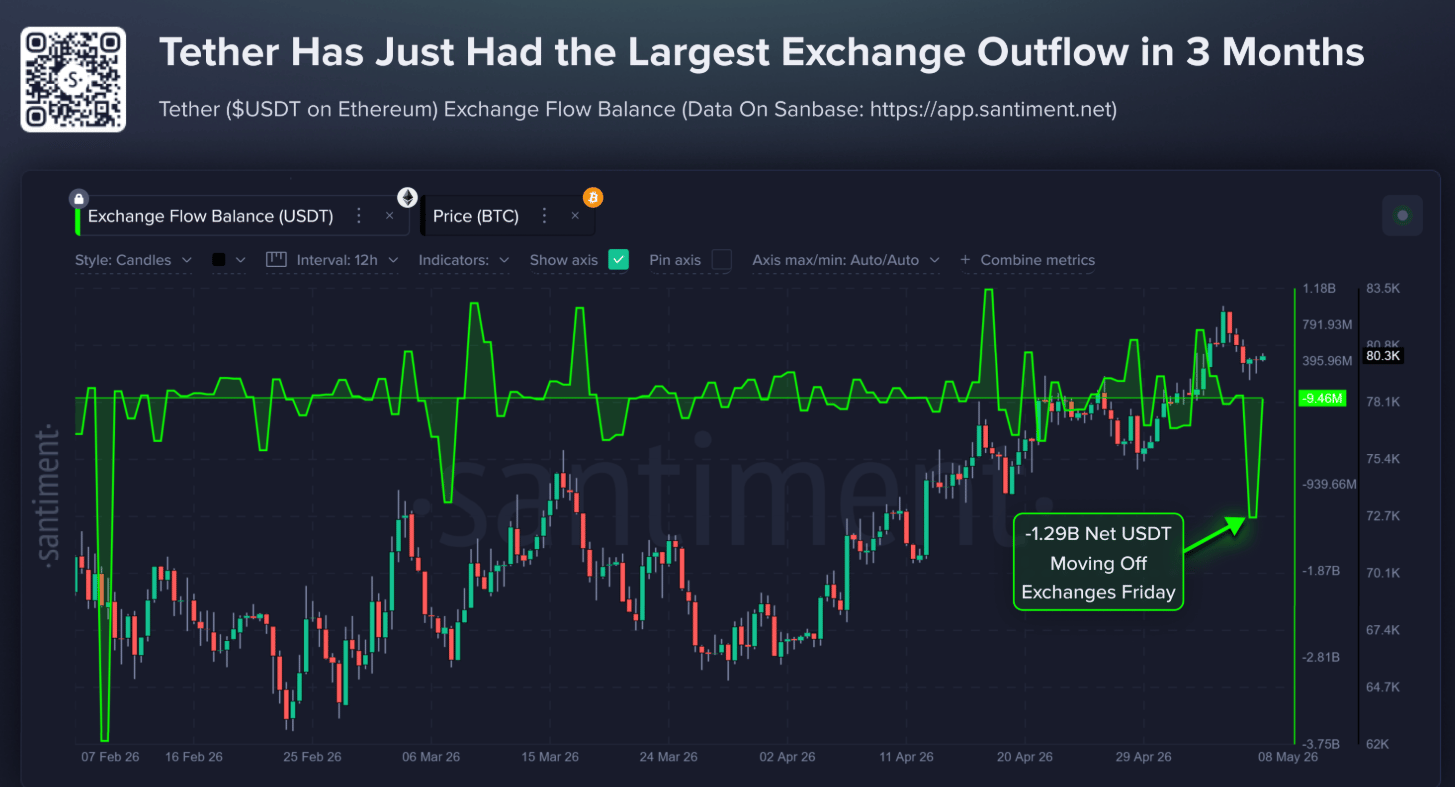
In addition, Santiment data showed that Tether (on Ethereum) recorded its largest exchange outflow in roughly three months on Friday, with -1.29 billion net USDT moving off exchanges.
Typically, stablecoin outflows from exchanges suggest that traders are withdrawing buying power from trading platforms rather than deploying capital into immediate crypto purchases or keeping funds readily available for trading.
Santiment analyst noted, “However, large USDT outflows of this magnitude typically reflect institutional or whale-tier participants moving funds to self-custody wallets, DeFi protocols, or OTC desks ahead of larger planned moves. It is capital being re-positioned, not capital exiting the ecosystem entirely."
Traders should keep an eye on these outflow spikes, as similar trends have historically preceded short-term market corrections. As shown in the chart below, on February 9, a massive $3.72 billion USDT outflow coincided with a mild Bitcoin pullback over the following two weeks before the market established a strong buying opportunity on February 24.
Bitcoin Price Forecast: BTC faces rejection near the overhead supply
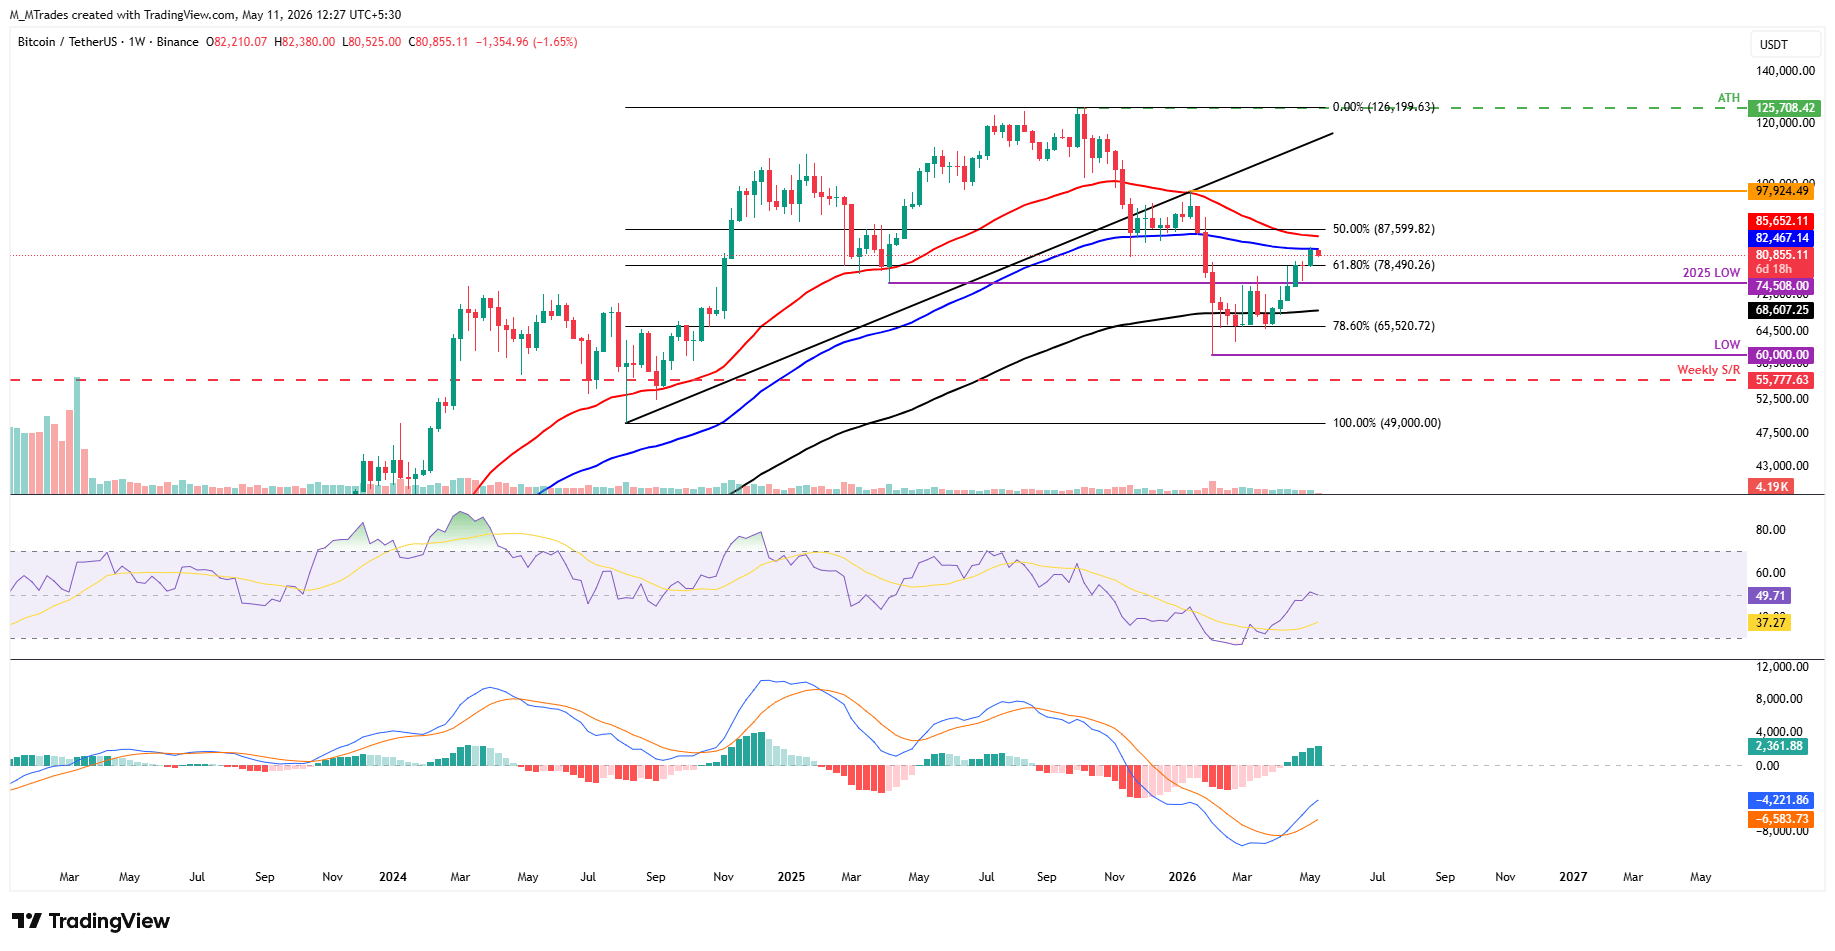
Bitcoin posted its highest weekly close since February at $82,210, up 4.63% last week. However, BTC retested and failed to reclaim the key 100-week Exponential Moving Average (EMA) at $82,467, which remains a strong overhead resistance level. At the start of this week, BTC trades slightly lower at around $80,900 on Monday.
If BTC continues its correction, it could extend the decline toward the key $80,000 psychological support. A slip below this level could extend the pullback toward the 61.8% Fibonacci retracement level at $78,490 (drawn from the October all-time high of $126,199 to the February low of $60,000).
Momentum is mixed but improving, with the Relative Strength Index (RSI) on the weekly chart hovering near a neutral 49 while the Moving Average Convergence Divergence (MACD) histogram remains firmly positive, hinting that bullish pressure is attempting to reassert itself despite the recent consolidation.
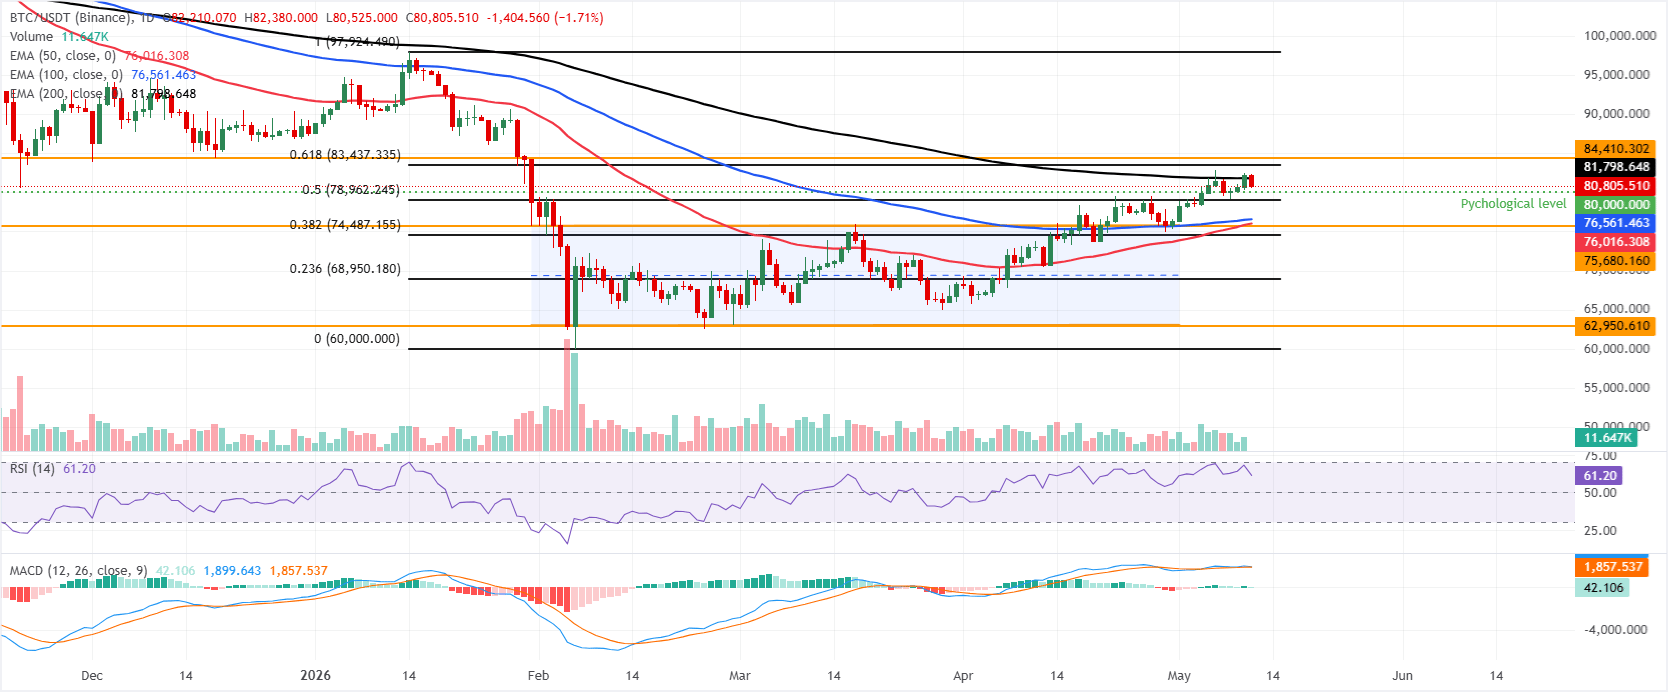
On the daily chart, the largest cryptocurrency by market capitalization maintains a constructive bullish bias as price holds well above the 50-day and 100-day EMAs, clustered around the mid-$76,000s, and above the 50% retracement at $78,962 (drawn from the January high to the Feburary low).
The immediate technical cap emerges at the 200-day EMA near $81,798, ahead of the denser resistance band formed by the 61.8% Fibonacci retracement at $83,437 and the horizontal barrier at $84,410, while a still-elevated RSI on the daily chart near 61 and a mildly positive MACD reading hint that upside momentum, though not aggressive, remains supportive of further gains while these supports hold.
On the downside, initial support is seen at the psychological level around $80,000, followed by the 50% retracement at $78,962, which reinforces the near-term floor. Deeper pullbacks would expose a layered demand zone between the 100-day EMA at $76,561, the 50-day EMA at $76,016, and the former channel top $75,680, ahead of broader Fibonacci and channel support levels down at $74,487 and $68,950.
(The technical analysis of this story was written with the help of an AI tool.)
Bitcoin, altcoins, stablecoins FAQs
Bitcoin is the largest cryptocurrency by market capitalization, a virtual currency designed to serve as money. This form of payment cannot be controlled by any one person, group, or entity, which eliminates the need for third-party participation during financial transactions.
Altcoins are any cryptocurrency apart from Bitcoin, but some also regard Ethereum as a non-altcoin because it is from these two cryptocurrencies that forking happens. If this is true, then Litecoin is the first altcoin, forked from the Bitcoin protocol and, therefore, an “improved” version of it.
Stablecoins are cryptocurrencies designed to have a stable price, with their value backed by a reserve of the asset it represents. To achieve this, the value of any one stablecoin is pegged to a commodity or financial instrument, such as the US Dollar (USD), with its supply regulated by an algorithm or demand. The main goal of stablecoins is to provide an on/off-ramp for investors willing to trade and invest in cryptocurrencies. Stablecoins also allow investors to store value since cryptocurrencies, in general, are subject to volatility.
Bitcoin dominance is the ratio of Bitcoin's market capitalization to the total market capitalization of all cryptocurrencies combined. It provides a clear picture of Bitcoin’s interest among investors. A high BTC dominance typically happens before and during a bull run, in which investors resort to investing in relatively stable and high market capitalization cryptocurrency like Bitcoin. A drop in BTC dominance usually means that investors are moving their capital and/or profits to altcoins in a quest for higher returns, which usually triggers an explosion of altcoin rallies.

Plus d’un million d’utilisateurs se tournent vers FXStreet pour des données de marché en temps réel, des outils de graphiques, des analyses d’experts et des actualités Forex. Leur calendrier économique complet et leurs webinaires éducatifs aident les traders à rester informés et à prendre des décisions éclairées. FXStreet s’appuie sur une équipe d’environ 60 professionnels répartis entre le siège de Barcelone et diverses régions du monde.
Lire la suite


