
Bitcoin Price Forecast: BTC recovery falters despite ETF inflows and Strategy purchases
Par Manish Chhetri
Mis à jour: 7 Apr 2026


ARTICLES POPULAIRES

Bitcoin (BTC) extends its decline, trading below $69,000 at the time of writing on Tuesday after being rejected from a key technical level the previous day.
- Bitcoin price extends its decline on Tuesday after facing rejection from the 50-day EMA near $70,300.
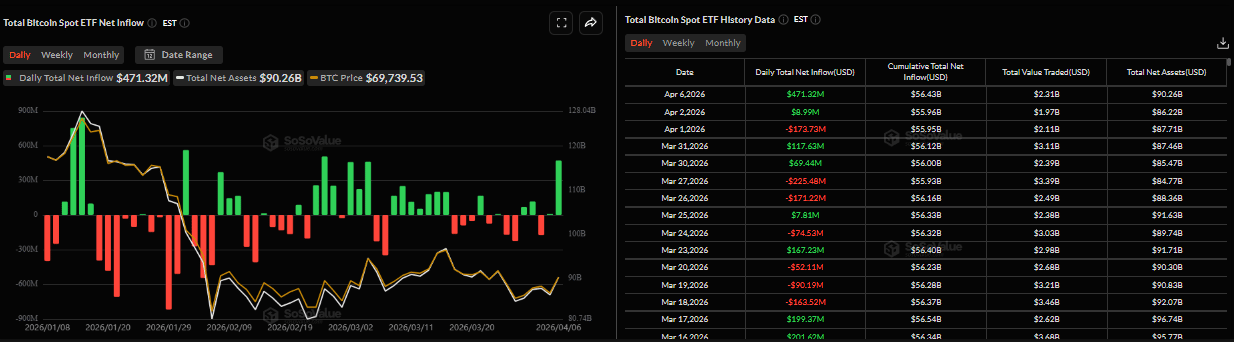
- US-listed spot ETF records an inflow of around $470 million while Strategy adds 4,871 BTC on Monday.
- Geopolitical tensions remain elevated as Donald Trump’s deadline threat toward Iran looms large, keeping market sentiment cautious.
Bitcoin (BTC) extends its decline, trading below $69,000 at the time of writing on Tuesday after being rejected from a key technical level the previous day. Despite institutional and corporate demand showing early signs of returns, the near-term market outlook for the Crypto King remains cautious, as traders wait for the deadline of US President Donald Trump’s ultimatum to Iran, which could provide fresh direction for BTC.
Trump’s ultimatum nears, keeping sentiment cautious
Bitcoin started the week on a positive note, recovering to a high of $70,351 during the first half of the day, as news emerged that Iran received the US ceasefire proposal through Pakistan and was reviewing it, which boosted risk sentiment slightly.
However, this recovery was quickly erased as BTC closed the day with slight losses. Iranian officials have stated that they won’t open the Strait of Hormuz in exchange for a temporary ceasefire.
On Tuesday, an advisor to Iran’s Parliament Speaker Mohammad Bagher Ghalibaf said that US President Donald Trump has about 20 hours to either surrender to Iran or his allies will return to the Paleolithic Age. The advisor emphasized that Iran will not back down.
The spokesperson for Iran’s top joint military command called Trump’s threats “delusional.” He added that the threats will not make up for the “disgrace and humiliation” of the US in the region.
Moreover, Donald Trump’s deadline, warning of potential strikes on Iran’s civilian infrastructure – including power plants and bridges – if the Strait of Hormuz is not reopened by Tuesday at 8:00 PM Eastern Time, is fast approaching, keeping market sentiment cautious as Bitcoin trades below $69,000 on Tuesday.
Any negative developments between the US and Iran could further dampen risk appetite and weigh on Bitcoin’s price, as geopolitical uncertainty continues to drive broader market direction.
Institutional and corporate demand returns
Institutional demand began the week on a positive note. SoSoValue data shows that spot Bitcoin Exchange Traded Funds (ETFs) recorded an inflow of $471.32 million on Monday, the highest single-day inflow since February 25. If these institutional demands continue and intensify, the BTC price could recover.
On the corporate side, Strategy (MSTR) announced on X on Monday that it had purchased 4,871 BTC, bringing its total holding to 766,970 BTC. This highlights its continued aggressive accumulation strategy, despite the $14.46 billion unrealized loss on its Bitcoin holdings for Q1. Strategy’s average purchase price for all its holdings is $75,644, above current market prices.
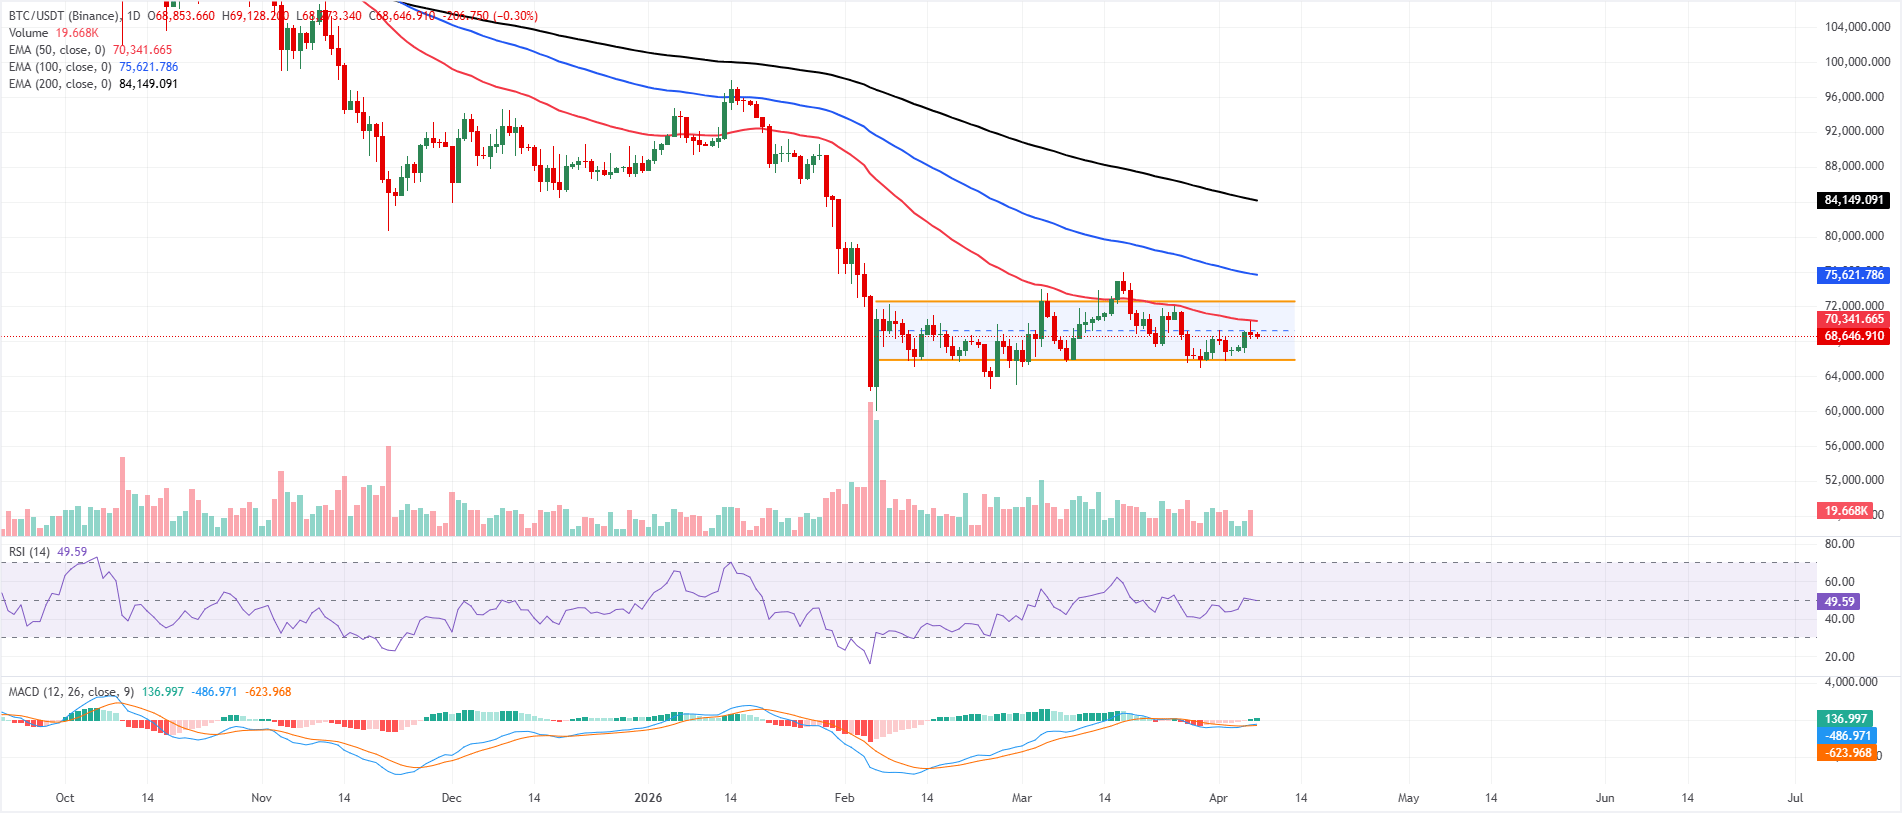
Bitcoin Price Forecast: BTC faces rejection from the 50-day EMA
Bitcoin is trading below $69,000 on Tuesday after being rejected by the 50-day Exponential Moving Average (EMA) at $70,341 the previous day. BTC holds in the lower half of a parallel channel, keeping the near-term bias mildly bearish despite the latest stabilization.
Price action remains below the 50-day, 100-day and 200-day EMAs, which continue to cap the upside and frame the broader downtrend. Momentum shows tentative improvement, with the Relative Strength Index (RSI) hovering just below the 50 line and the Moving Average Convergence Divergence (MACD) line turning positive above the signal line but still close to the zero mark, suggesting recovering but not dominant buying pressure.
Initial resistance emerges at the 50-day EMA at $70,341, which roughly coincides with the midpoint of the channel at $69,300 and and the channel top near $72,600. A daily close above that band would break the parallel channel structure and open the way toward $74,000.
On the downside, immediate support aligns with Sunday’s low near $66,600, followed by the channel floor around $65,900. A sustained drop through the lower boundary would resume the broader bearish sequence toward the mid-$64,000s.
(The technical analysis of this story was written with the help of an AI tool.)
Bitcoin, altcoins, stablecoins FAQs
Bitcoin is the largest cryptocurrency by market capitalization, a virtual currency designed to serve as money. This form of payment cannot be controlled by any one person, group, or entity, which eliminates the need for third-party participation during financial transactions.
Altcoins are any cryptocurrency apart from Bitcoin, but some also regard Ethereum as a non-altcoin because it is from these two cryptocurrencies that forking happens. If this is true, then Litecoin is the first altcoin, forked from the Bitcoin protocol and, therefore, an “improved” version of it.
Stablecoins are cryptocurrencies designed to have a stable price, with their value backed by a reserve of the asset it represents. To achieve this, the value of any one stablecoin is pegged to a commodity or financial instrument, such as the US Dollar (USD), with its supply regulated by an algorithm or demand. The main goal of stablecoins is to provide an on/off-ramp for investors willing to trade and invest in cryptocurrencies. Stablecoins also allow investors to store value since cryptocurrencies, in general, are subject to volatility.
Bitcoin dominance is the ratio of Bitcoin's market capitalization to the total market capitalization of all cryptocurrencies combined. It provides a clear picture of Bitcoin’s interest among investors. A high BTC dominance typically happens before and during a bull run, in which investors resort to investing in relatively stable and high market capitalization cryptocurrency like Bitcoin. A drop in BTC dominance usually means that investors are moving their capital and/or profits to altcoins in a quest for higher returns, which usually triggers an explosion of altcoin rallies.

Plus d’un million d’utilisateurs se tournent vers FXStreet pour des données de marché en temps réel, des outils de graphiques, des analyses d’experts et des actualités Forex. Leur calendrier économique complet et leurs webinaires éducatifs aident les traders à rester informés et à prendre des décisions éclairées. FXStreet s’appuie sur une équipe d’environ 60 professionnels répartis entre le siège de Barcelone et diverses régions du monde.
Lire la suite


