
Bitcoin Weekly Forecast: Ceasefire lifts prices, but for how long?
Par Manish Chhetri
Mis à jour: 10 Apr 2026


ARTICLES POPULAIRES

Bitcoin (BTC) is up by 4% so far this week, trading above $72,000 on Friday. This price rise followed the US-Iran ceasefire announcement earlier this week. Institutional demand also supports the Crypto King price as spot Exchange Traded Funds (ETFs) recorded positive flows through Thursday.
- Bitcoin is up over 4% so far this week, supported by the two-week ceasefire between the US and Iran.
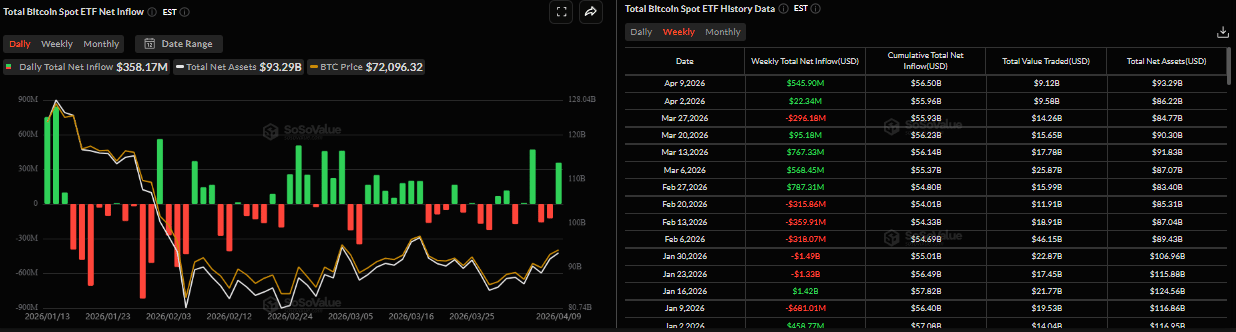
- US-listed spot Bitcoin ETF recorded inflows of $545.90 million through Thursday, pointing to the second week of positive flows.
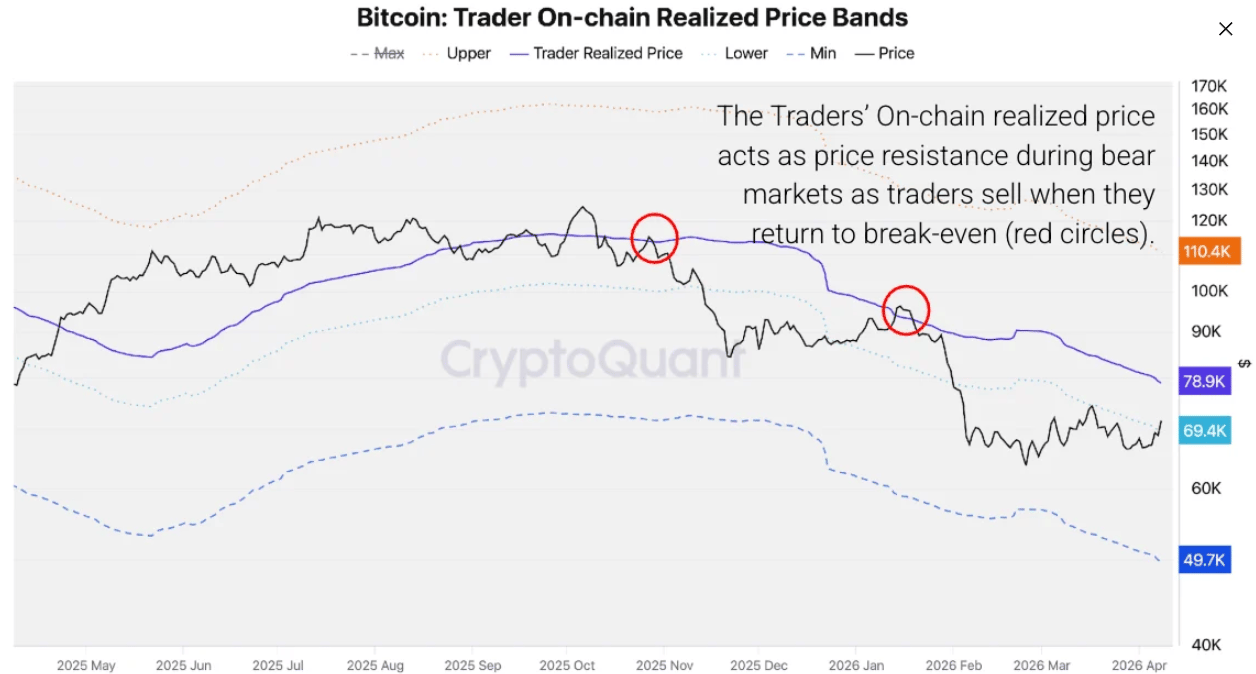
- BTC reclaims the Traders’ Lower Realized Price at $69,400, a level that had capped price action for weeks, signaling an improving market structure.
Bitcoin (BTC) is up by 4% so far this week, trading above $72,000 on Friday. This price rise followed the US-Iran ceasefire announcement earlier this week. Institutional demand also supports the Crypto King price as spot Exchange Traded Funds (ETFs) recorded positive flows through Thursday. Meanwhile, BTC closes above a key technical barrier that had capped price action for weeks, signaling an improving market structure and hinting at an upside move ahead.
US-Iran ceasefire boosts risk sentiment
Bitcoin started the week on a positive but cautious note, as news on Monday confirmed that Iran had received the US ceasefire proposal via Pakistan and was reviewing it.
Later, the news came in that the US and Iran brokered a two-week ceasefire and agreed to start negotiations on Friday, potentially paving the way for lasting peace in the Middle East, which boosted the risk appetite, with BTC rising over 4% on Tuesday.
This information came in ahead of the US President Donald Trump’s deadline, warning of potential strikes on Iran’s civilian infrastructure – including power plants and bridges – if the Strait of Hormuz is not reopened by Tuesday at 8:00 PM Eastern Time (00:00 GMT on Wednesday).
However, Bitcoin’s recovery stalled in the latter week amid heightened uncertainty over the US-Iran ceasefire. Donald Trump posted on his Truth Social account on Thursday, “all US ships, aircraft, and military personnel with additional ammunition, weaponry, and anything else that is appropriate and necessary for the lethal prosecution and destruction of an already substantially degraded enemy, will remain in place in, and around, Iran, until such time as the real agreement reached is fully complied with.”
Trump continued, “If for any reason it is not, which is highly unlikely, then the ‘Shootin’ Starts,’ bigger, and better, and stronger than anyone has ever seen before.”
The ceasefire announcement has boosted risk sentiment, with US equities and other risky assets such as Bitcoin remaining positive so far this week. But traders should still be cautious, as the ongoing uncertainty surrounding the US-Iran ceasefire continues to affect the market sentiment. Any negative developments could dampen risk appetite, while positive developments over the truce could support Bitcoin’s price.
Iran to demand Bitcoin toll payment for ships passing Hormuz
According to the Financial Times (FT), Iran will demand that shipping companies pay tolls in cryptocurrency for oil tankers passing through the Strait of Hormuz, as it seeks to retain control over passage through the key waterway during the two-week ceasefire.
The proposal would require tanker operators to submit cargo details in advance via email for approval by Iranian authorities, Hamid Hosseini, a spokesperson for Iran’s Oil, Gas and Petrochemical Products Exporters’ Union, told FT.
Approved vessels would then pay a transit fee of approximately $1 per barrel, with payments accepted in Bitcoin and other crypto, or in Chinese yuan. Empty vessels would be exempt from the charge.
As explained in the previous report, Iran relies on cryptocurrencies due to US sanctions, and Bitcoin has served as a tool for paying for imports and settling trade. Iran legalized crypto mining in 2019 and has played a role in its economy. The latest proposal by Iran to accept Bitcoin and other cryptocurrencies for transit fees in the Strait of Hormuz indicates crypto’s evolving role in global trade. If implemented, this could mark a key milestone in adoption, particularly for regions facing financial constraints. This development could boost Bitcoin demand in the near term, as 20% of global oil tankers pass through the Hormuz Strait.
Return of institutional and corporate demand
Institutional demand remained robust so far this week, supporting the BTC price. According to SoSoValue data, spot Bitcoin ETFs have recorded a net inflow of $545.90 million through Thursday. If this trend continues up to Friday, it would mark the second consecutive week of inflows. In case these inflows keep coming in and intensify, BTC could see a rally ahead.
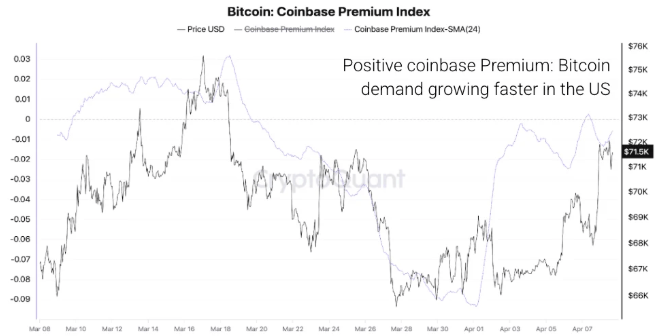
In addition, the Coinbase Premium Index turned positive for Bitcoin following the ceasefire announcement, indicating relatively higher demand from US investors. This suggests the broad-based US demand re-engagement.
“If the ceasefire holds and no escalatory news emerges over the next two weeks, the Coinbase premium could sustain positive territory, reinforcing the bullish price trajectory,” said CryptoQuant’s analyst.
On the corporate side, Strategy (MSTR) announced on X on Monday that it had purchased 4,871 BTC, bringing its total holding to 766,970 BTC. This highlights its continued aggressive accumulation strategy, despite the $14.46 billion unrealized loss on its Bitcoin holdings for Q1. Strategy’s average purchase price for all its holdings is $75,644, above current market prices.
Morgan Stanley Bitcoin Trust goes live
Morgan Stanley’s Bitcoin Trust (MSBT) began trading on the New York Stock Exchange (NYSE) on Wednesday, marking the first spot Bitcoin ETF launched by a major US bank.
Eric Balchunas, Senior ETF Analyst at Bloomberg, described the debut as a “BIG BOY LAUNCH” in a post on X, highlighting its significance for the crypto market.
He added that the Morgan Stanley Bitcoin ETF “arguably represents the biggest BTC launch since spot products began trading,” projecting around $5 billion in assets under management within the first year and roughly $30 million in day-one trading volume.
On-chain outlook suggests a possible rally toward $79,000
CryptoQuant’s weekly report noted that the Bitcoin price crossed above the Traders’ Lower Realized Price band, roughly $69,400, following the ceasefire news, as shown in the chart below.
“If Bitcoin holds above this level and no escalatory developments emerge from the US-Iran front, the next key target is the Traders’ Realized Price at approximately $79,000, a level historically associated with bear market resistance and a key hurdle for structural recovery,” noted the report.
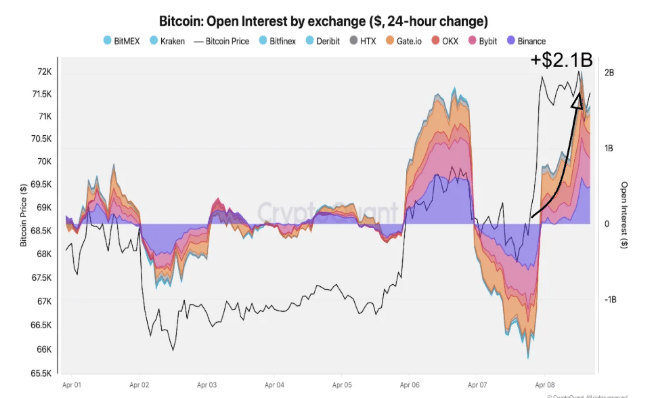
The analyst writing the report also explained that the Open Interest (OI) in BTC perpetual futures rose by $2.1 billion, following the US-Iran ceasefire announcement late on Tuesday, reaching levels not seen in nearly a month. This surge in OI reflects macro-event-driven positioning, with traders front-running an anticipated improvement in broader risk sentiment, ruling out short liquidations as the primary driver and confirming that traders are opening net new long positions.
Technical outlook: BTC holds above key support
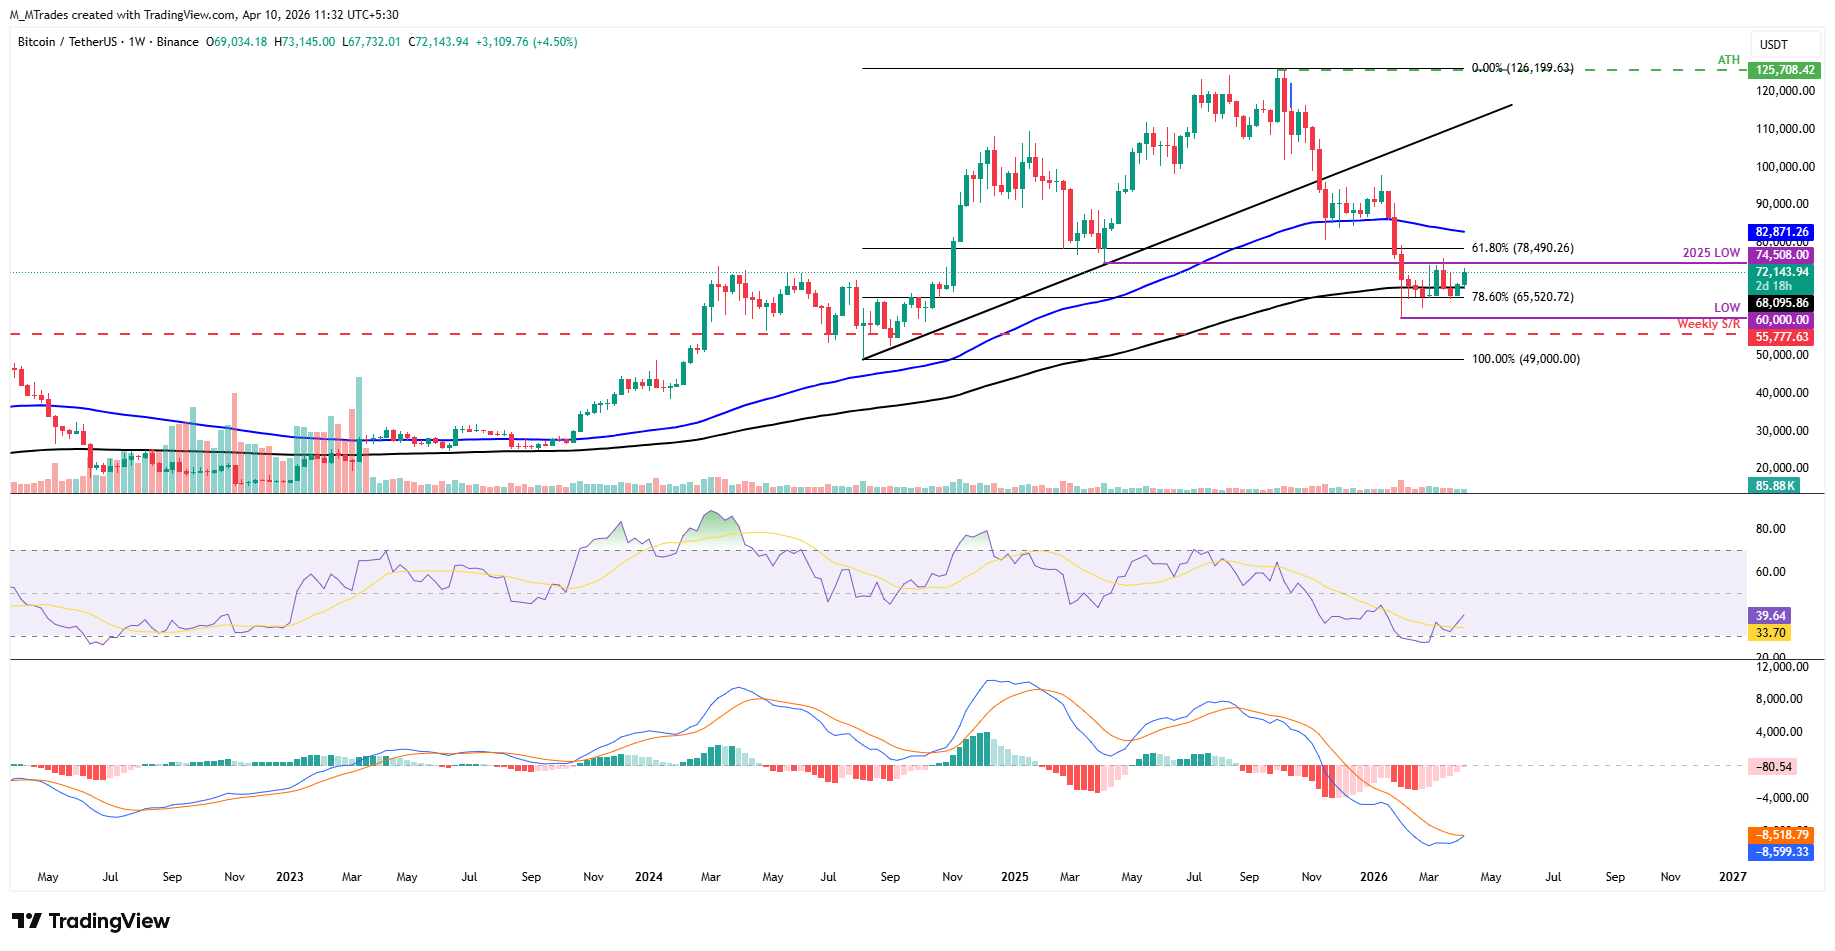
As seen on the weekly chart below, the largest cryptocurrency by market capitalization found support around the 78.60% Fibonacci retracement level at $65,520 (drawn from the August 2024 low of $49,000 to the October 2025 all-time high of $126,199), rose 4.58% and closed above the 200-day Exponential Moving Average (EMA) at $68,095 last week. As of this week, BTC found support around this broken 200-day EMA and is trading above $72,000 at the time of writing on Friday.
If BTC continues its upward move, it could extend the rally toward the 2025 yearly low of $74,508. A successful weekly close above this level could extend gains toward the 61.80% Fibonacci retracement level at $78,490 (which roughly aligns with the Traders’ Realized Price explained above).
The Relative Strength Index (RSI) reads 39 on the weekly chart, above the oversold territory, pointing upward toward the neutral level of 50, indicating fading bearish momentum. The Moving Average Convergence Divergence (MACD) indicator on the same chart shows the histogram remains negative but has been narrowing, hinting that bearish momentum is losing intensity rather than reversing outright.
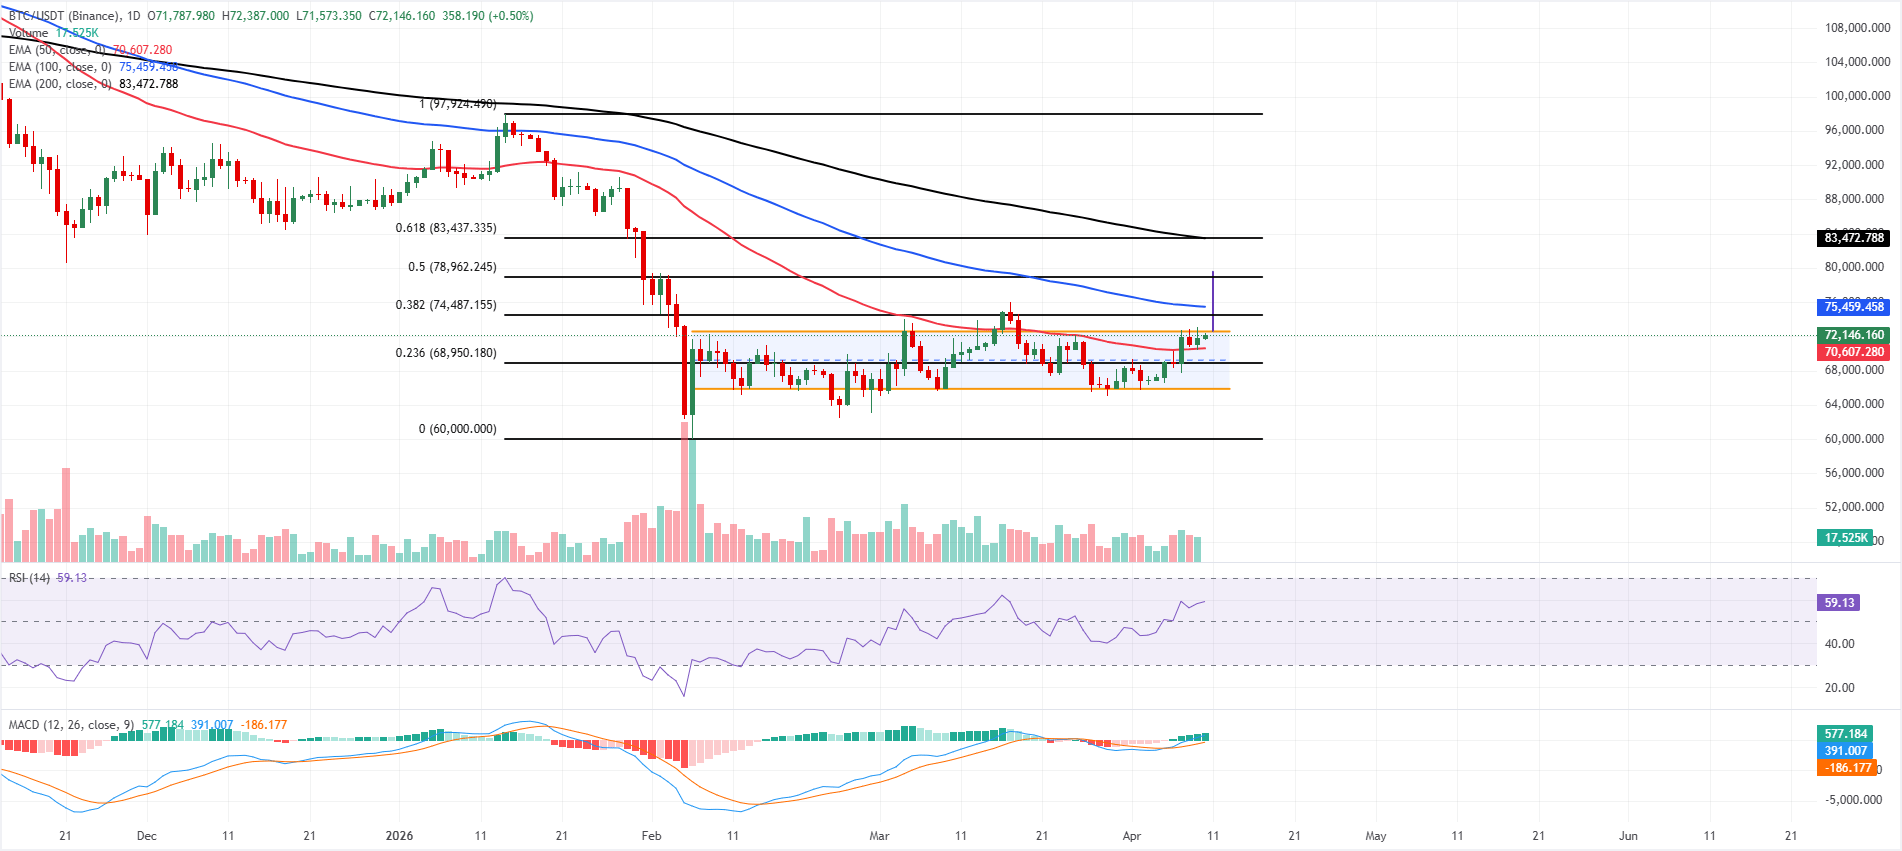
On the daily chart, Bitcoin nears the channel top at $72,600, where a breakout would signal a bullish move. BTC holds a capped bias as it remains below the 100-day and 200-day Exponential Moving Averages (EMAs) while respecting the 50-day EMA as nearby support. Momentum indicators lean supportive, with the RSI hovering near 59 and a positive rising MACD histogram on the same chart suggesting that bullish momentum is improving but not yet strong enough to decisively reverse the higher-timeframe downtrend.
On the downside, initial support is seen at the 50-day EMA around $70,607, where a sustained break would likely expose the lower boundary of the prevailing channel near $65,900 as the next key bearish target.
On the topside, a daily close above the channel ceiling at $72,600 would open the door for a recovery toward the 100-day EMA at $75,459, with the 200-day EMA up at $83,472 standing as a broader trend barrier that would need to be reclaimed to signal a more durable bullish extension.
(The technical analysis of this story was written with the help of an AI tool.)
Cryptocurrency metrics FAQs
The developer or creator of each cryptocurrency decides on the total number of tokens that can be minted or issued. Only a certain number of these assets can be minted by mining, staking or other mechanisms. This is defined by the algorithm of the underlying blockchain technology. On the other hand, circulating supply can also be decreased via actions such as burning tokens, or mistakenly sending assets to addresses of other incompatible blockchains.
Market capitalization is the result of multiplying the circulating supply of a certain asset by the asset’s current market value.
Trading volume refers to the total number of tokens for a specific asset that has been transacted or exchanged between buyers and sellers within set trading hours, for example, 24 hours. It is used to gauge market sentiment, this metric combines all volumes on centralized exchanges and decentralized exchanges. Increasing trading volume often denotes the demand for a certain asset as more people are buying and selling the cryptocurrency.
Funding rates are a concept designed to encourage traders to take positions and ensure perpetual contract prices match spot markets. It defines a mechanism by exchanges to ensure that future prices and index prices periodic payments regularly converge. When the funding rate is positive, the price of the perpetual contract is higher than the mark price. This means traders who are bullish and have opened long positions pay traders who are in short positions. On the other hand, a negative funding rate means perpetual prices are below the mark price, and hence traders with short positions pay traders who have opened long positions.

Plus d’un million d’utilisateurs se tournent vers FXStreet pour des données de marché en temps réel, des outils de graphiques, des analyses d’experts et des actualités Forex. Leur calendrier économique complet et leurs webinaires éducatifs aident les traders à rester informés et à prendre des décisions éclairées. FXStreet s’appuie sur une équipe d’environ 60 professionnels répartis entre le siège de Barcelone et diverses régions du monde.
Lire la suite


