
Cardano Price Forecast: ADA dips below $0.28 as bears eye October 2023 lows
Par Manish Chhetri
Date de publication: 2 Feb 2026 | Date de modification: 2 Feb 2026


ARTICLES POPULAIRES

Cardano (ADA) price trades in red, slipping below $0.28 at the time of writing on Monday, following a correction of more than 15% in the previous week. The broader crypto market remains under pressure, with Bitcoin (BTC) slipping below $75,000 on Monday.
- Cardano's price extends its correction on Monday, following a 15% loss the previous week.
- Santiment data indicate that ADA whales are offloading tokens, increasing the selling pressure.
- The technical outlook suggests a deeper correction ahead, with bears targeting a level not seen since October 20, 2023.
Cardano (ADA) price trades in red, slipping below $0.28 at the time of writing on Monday, following a correction of more than 15% in the previous week. The broader crypto market remains under pressure, with Bitcoin (BTC) slipping below $75,000 on Monday. On-chain data shows ADA whales are offloading tokens, while on the technical side the outlook is bearish, with Cardano close to a price level not seen since October 21, 2023.
Whales are offloading ADA tokens, increasing selling pressure
Santiment’s Supply Distribution data supports a bearish outlook for Cardano, as the number of large-wallet holders (whales) is reducing exposure to the token.
The metric indicates that whales holding between 100,000 and 1 million (red line), 1 million and 10 million (yellow line), and 10 million and 100 million (blue line) ADA tokens have shed 160 million tokens since Thursday.
 [10-1770015488036-1770015488038.59.42, 02 Feb, 2026].png)
Cardano Price Forecast: ADA bears aiming for $0.25 mark
Cardano price corrected by more than 15% over the previous week, retesting the October 10 low of $0.27 on Saturday. As of Monday, ADA is trading red at around $0.28.
If ADA continues its downward trend, it could extend the decline toward the October 21, 2023, low of $0.24.
The Relative Strength Index (RSI) on the daily chart stands near 27, indicating strong bearish momentum and oversold conditions. The Moving Average Convergence Divergence (MACD) indicator showed a bearish crossover on January 18, which remains intact and thus further supporting the negative outlook.
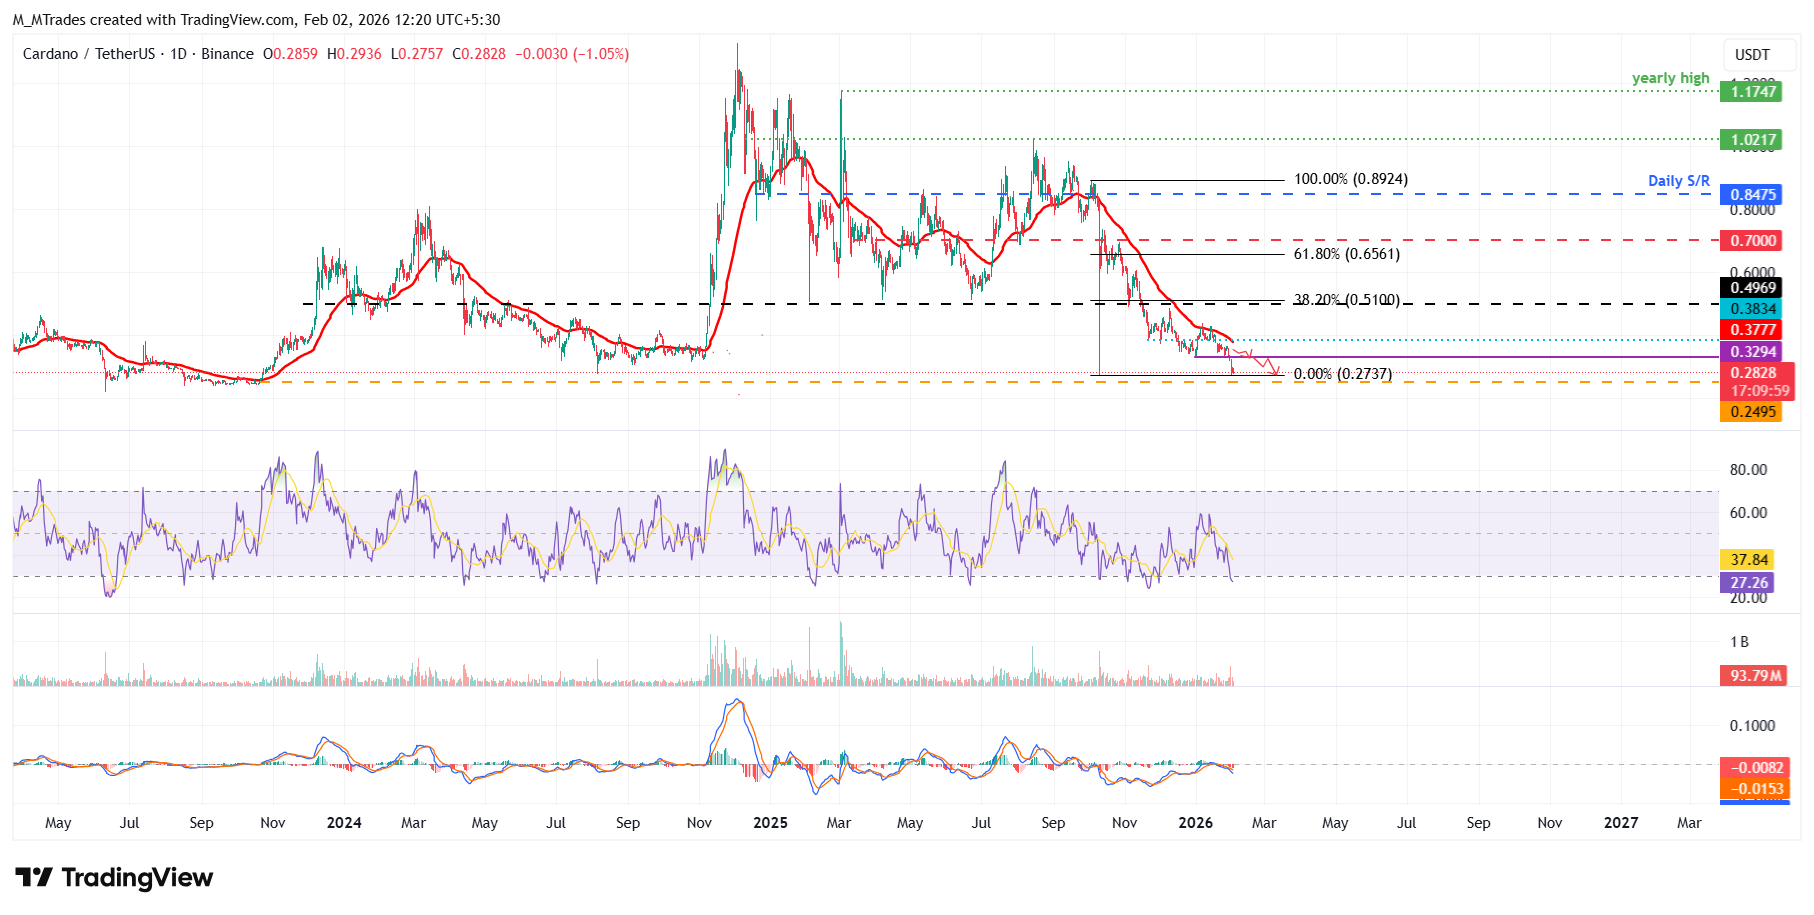
If ADA recovers, the first significant resistance emerges at $0.32, which aligns with daily resistance.

Plus d’un million d’utilisateurs se tournent vers FXStreet pour des données de marché en temps réel, des outils de graphiques, des analyses d’experts et des actualités Forex. Leur calendrier économique complet et leurs webinaires éducatifs aident les traders à rester informés et à prendre des décisions éclairées. FXStreet s’appuie sur une équipe d’environ 60 professionnels répartis entre le siège de Barcelone et diverses régions du monde.
Lire la suite


