
Cardano Price Forecast: ADA vulnerable to deeper losses amid SecondFi exploit
Par Vishal Dixit
Mis à jour: 24 Jun 2026


ARTICLES POPULAIRES

Cardano (ADA) price hovers below $0.1500 at press time on Wednesday, extending a refreshed bearish impulse move of over 20% in the last nine days.
- Cardano hovers below $0.1500 on Wednesday, following a 4% decline the previous day.
- Cardano ecosystem project SecondFi was the victim of an exploit targeting its wallet-generation software, resulting in losses of about 16 million ADA.
- A surge in Open Interest amid declining funding rate and volume implies a bearish buildup in ADA derivatives.
Cardano (ADA) price hovers below $0.1500 at press time on Wednesday, extending a refreshed bearish impulse move of over 20% in the last nine days. The exploitation of the Cardano ecosystem’s SecondFi wallet-generation software, resulting in a loss of about 16 million ADA, weighs on retail strength. From a technical standpoint, ADA risks an extended bearish impulse move amid waning recovery momentum.
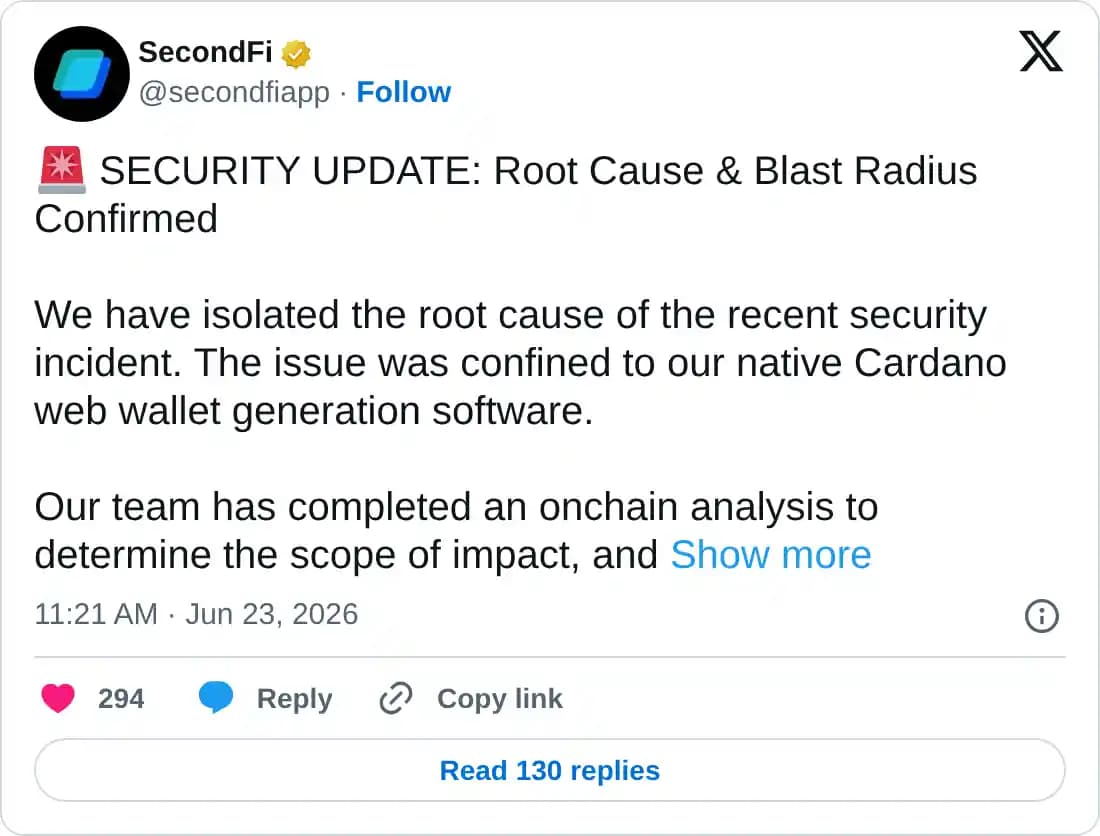
SecondFi exploit fuels bearish bets on Cardano
SecondFi, a Cardano ecosystem project, revealed a security incident involving Cardano’s native web wallet generation software. Following a root cause and blast radius analysis, SecondFi has rolled out a patch for all unaffected wallets. The official data revealed four distinct draining events, resulting in a loss of approximately 16 million ADA across 374 addresses.
Notably, emergency rescue measures were triggered to secure the available 129 million ADA.
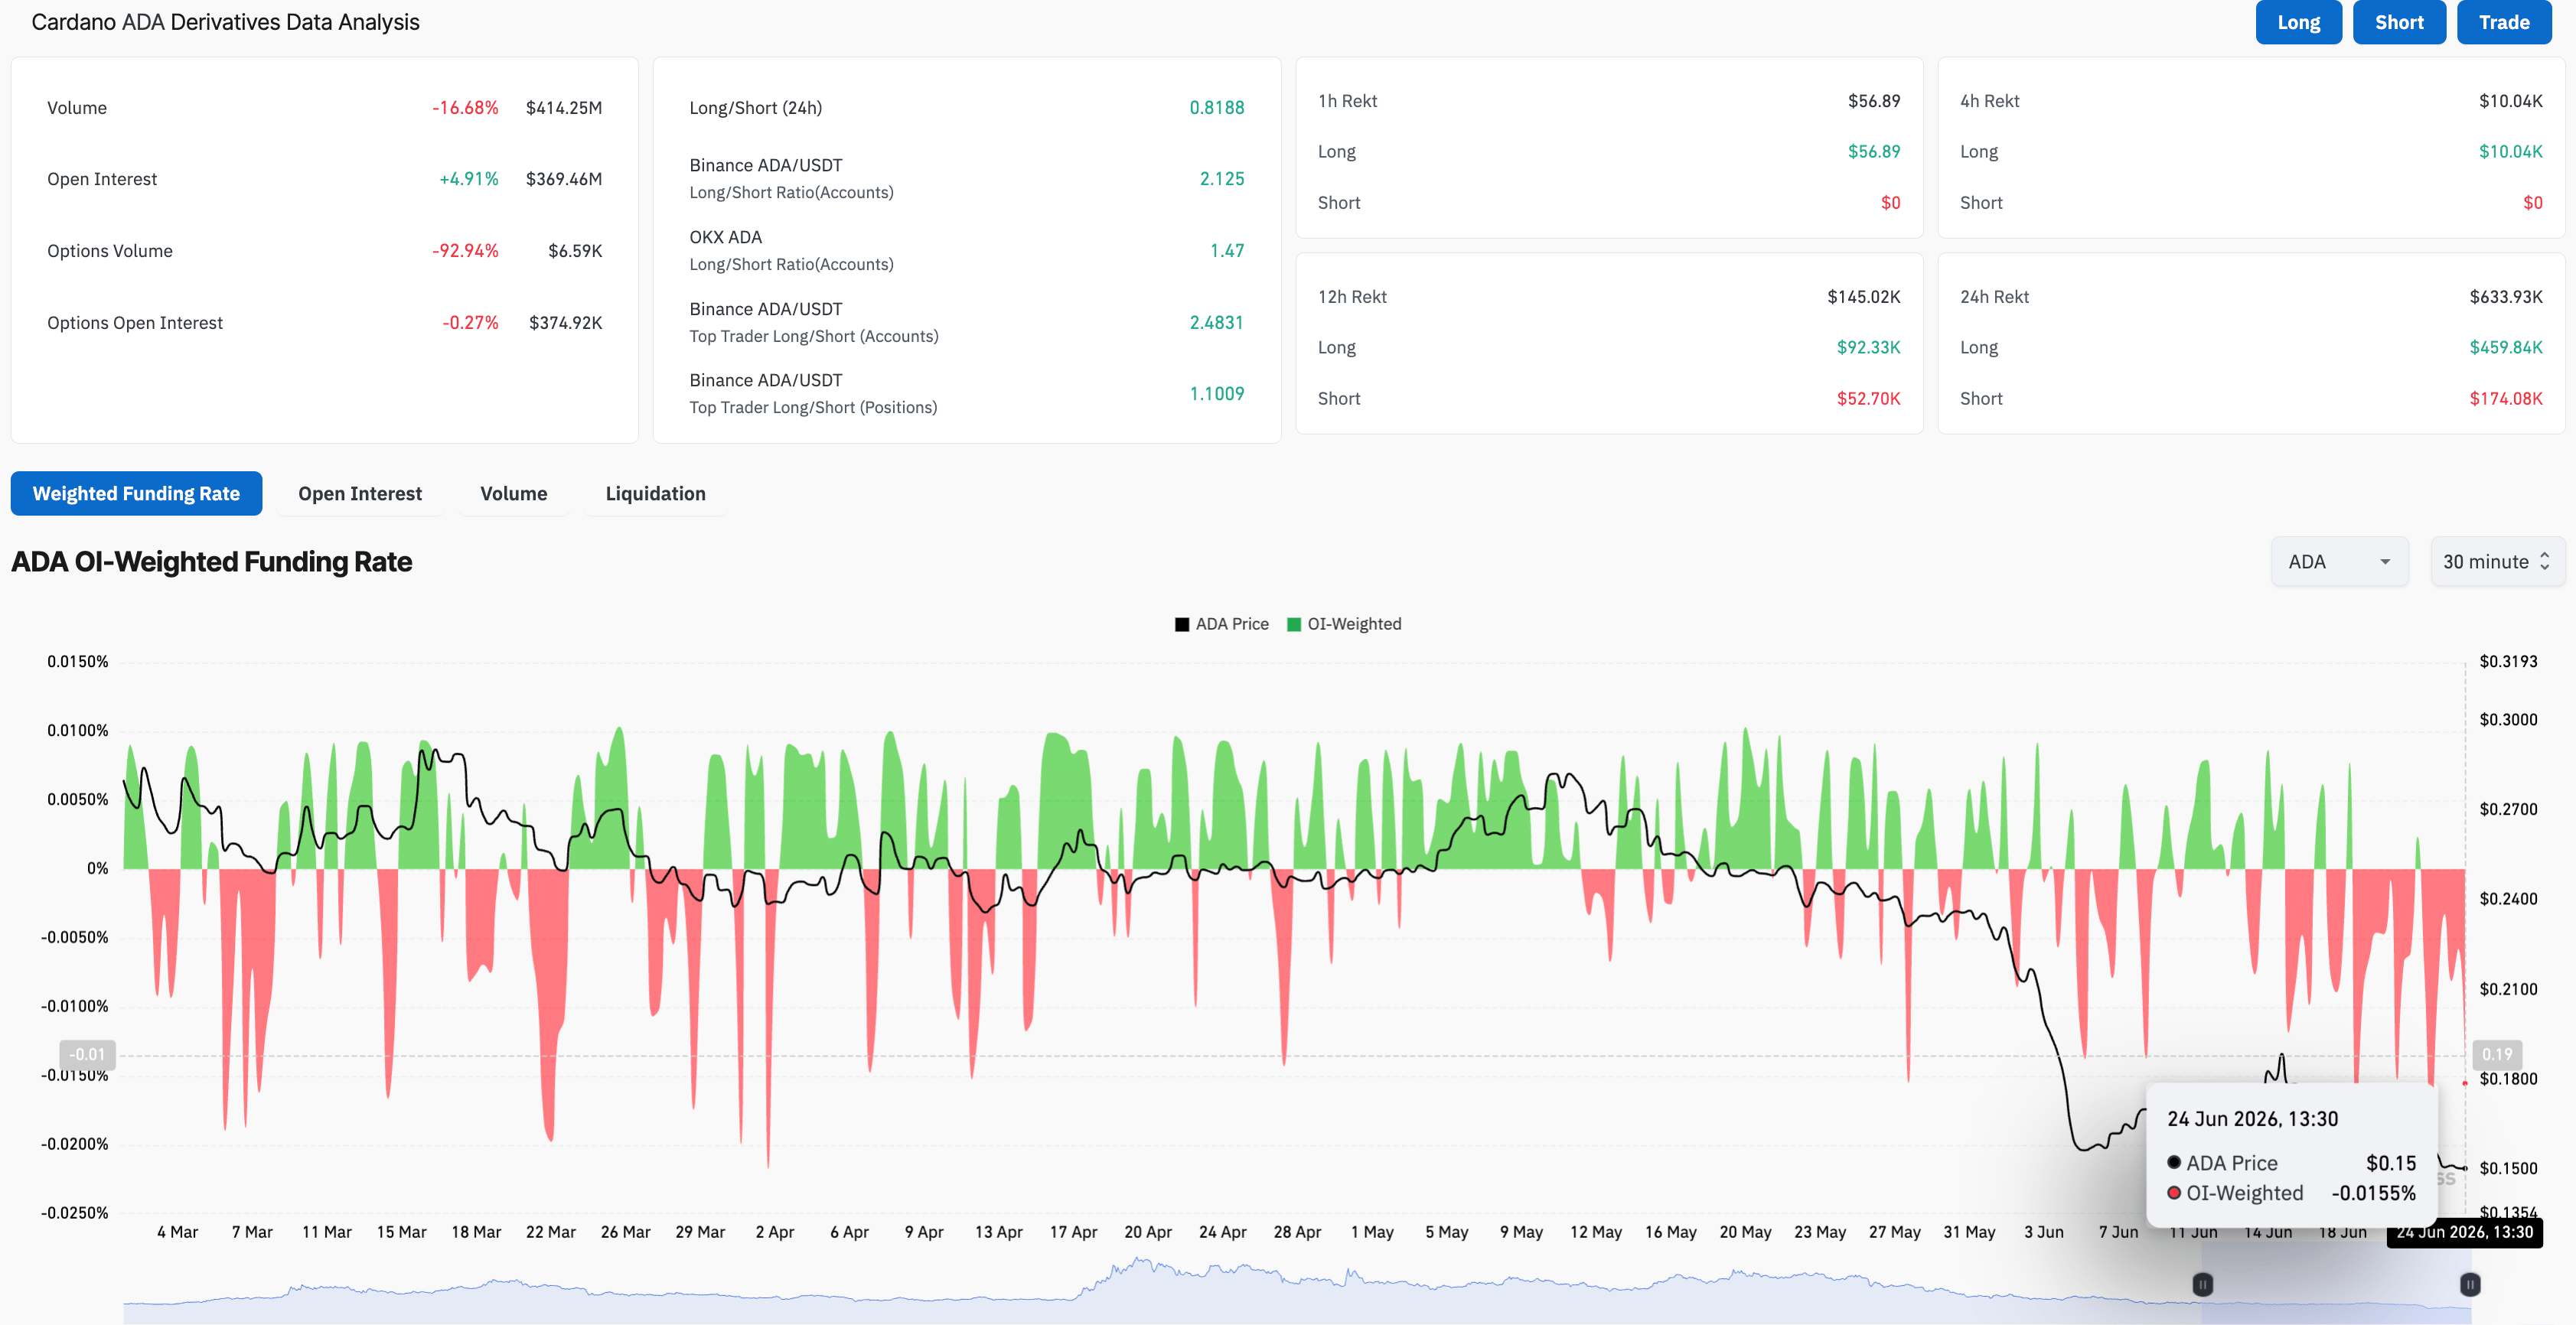
Although the situation is gradually returning to normal, retail sentiment remains broadly bearish toward Cardano. CoinGlass data shows the ADA futures Open Interest (OI) is up roughly 5% to $369.46 million over the last 24 hours, suggesting a positional buildup. However, the volume is down 16% to $414.25 million over the same period, while the funding rate is negative at -0.0155%. This indicates that trading activity has eased while the remaining buyers opt to hold short positions at a premium, anticipating deeper losses in the spot market.
Cardano extends its bearish impulse move
Cardano maintains a clear bearish bias, with price remaining well below the 50-day and 200-day Exponential Moving Averages (EMAs) at $0.2003 and $0.3063, respectively. From a technical perspective, ADA extends a downward trend after testing the midline of an inverse Fair Value Gap (FVG) between $0.2001 and $0.1798. The throwback breaks below the June 6 low at $0.1486, trading at levels last seen since December 2020.
That said, momentum indicators reaffirm the broader bearish bias, with the Moving Average Convergence Divergence (MACD) testing its signal line for a bearish crossover as the positive histograms contract. At the same time, the Relative Strength Index (RSI) around 27 slips back into the oversold territory, implying that immediate downside could slow but not yet suggesting a sustainable reversal.
On the downside, the next notable support aligns with the $0.1281 level last tested on December 23, followed by the prior horizontal floor near $0.1000. Any test near this psychological threshold is likely to attract bargain-hunting interest, although the prevailing trend still favors selling rallies while price trades below the key daily EMAs.
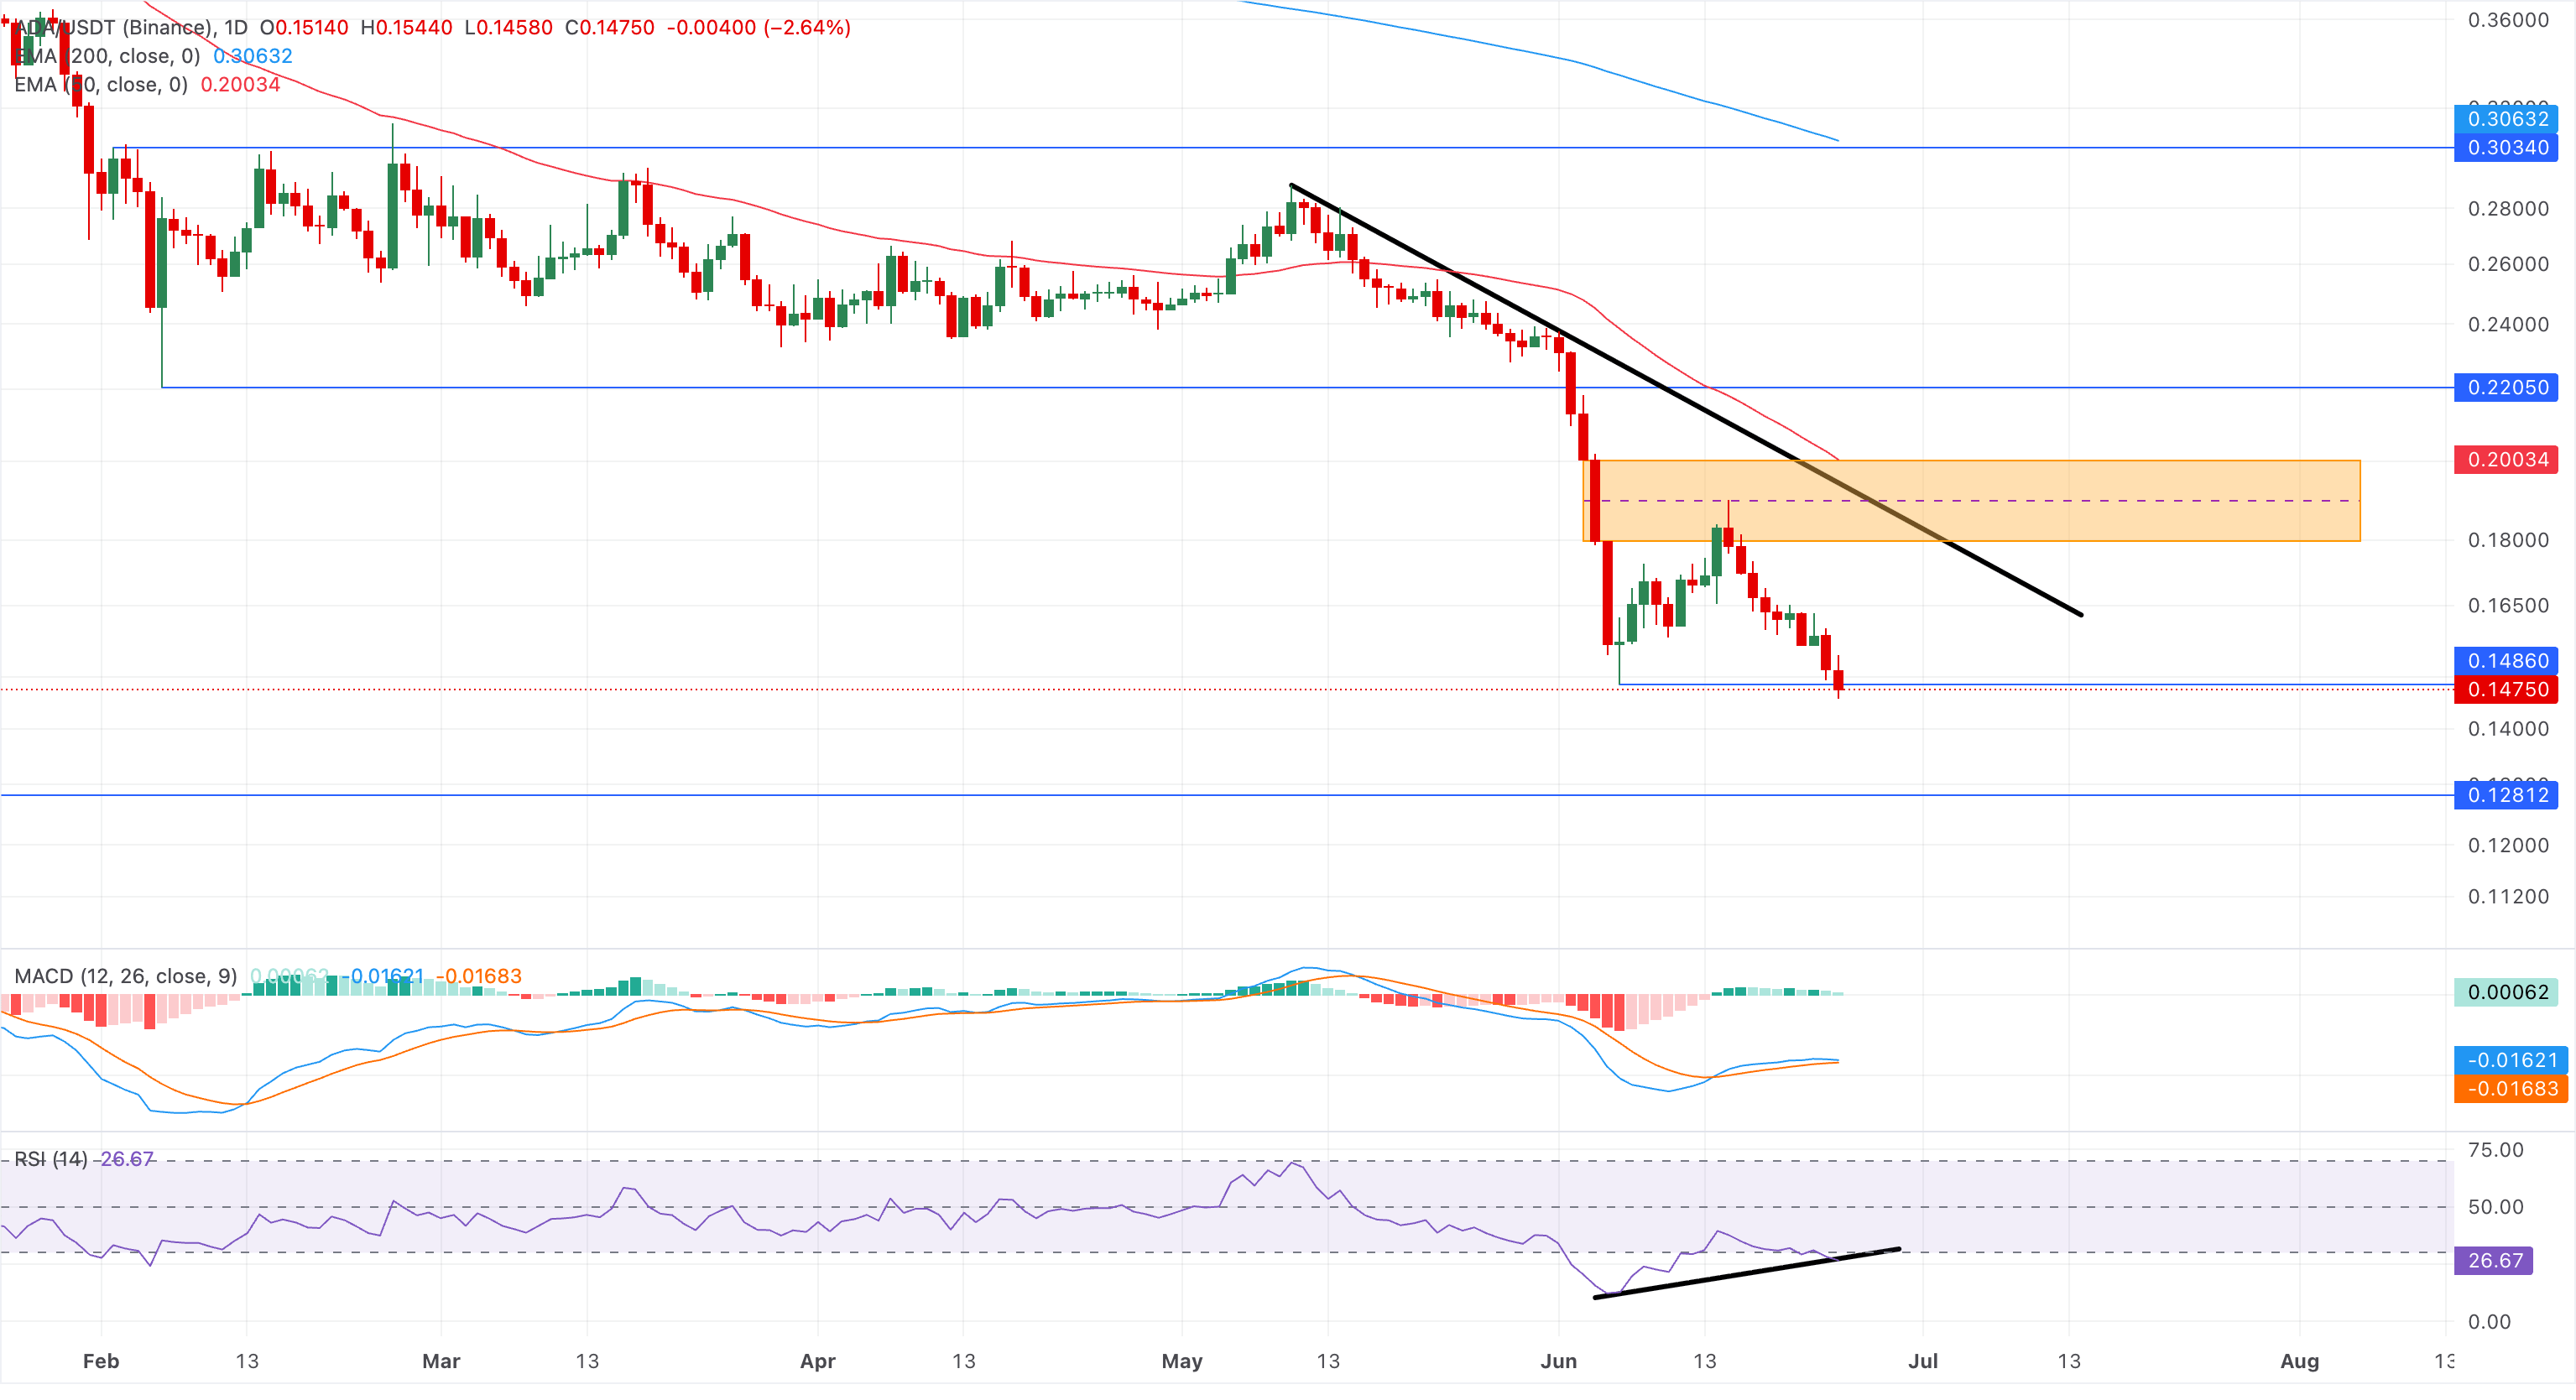
On the topside, initial resistance is seen at the descending trendline break level at roughly $0.1850, between the FVG ranging from $0.2001 to $0.1798, forming a dense cap that bulls would need to reclaim to ease selling pressure.
(The technical analysis of this story was written with the help of an AI tool.)

Plus d’un million d’utilisateurs se tournent vers FXStreet pour des données de marché en temps réel, des outils de graphiques, des analyses d’experts et des actualités Forex. Leur calendrier économique complet et leurs webinaires éducatifs aident les traders à rester informés et à prendre des décisions éclairées. FXStreet s’appuie sur une équipe d’environ 60 professionnels répartis entre le siège de Barcelone et diverses régions du monde.
Lire la suite


