
Cardano Price Forecast: US–Iran tensions and bearish bets cap ADA
Par Manish Chhetri
Mis à jour: 20 Apr 2026


ARTICLES POPULAIRES

Cardano (ADA) price trades at around $0.245 on Monday after a mild recovery of 2.67% in the previous week. However, the risk sentiment was dampened over the weekend as renewed tensions between the US and Iran in the Strait of Hormuz weighed on broader markets.
- Cardano keeps a capped tone on Monday after posting a modest 2.67% gain last week.
- Renewed tensions between the US and Iran in the Strait of Hormuz over the weekend dampened risk sentiment.
- Derivatives metrics paint a bearish picture as ADA short bets are rising alongside negative funding rates.
Cardano (ADA) price trades at around $0.245 on Monday after a mild recovery of 2.67% in the previous week. However, the risk sentiment was dampened over the weekend as renewed tensions between the US and Iran in the Strait of Hormuz weighed on broader markets. Moreover, weakening derivatives metrics for ADA support a bearish outlook, keeping the recovery capped.
Tension over the Strait of Hormuz dampens risk sentiment
The broader market started the week on a cautious note as reports suggest that Iran says it has attacked US military ships with drones in retaliation for the US striking and seizing an Iranian cargo vessel in the Strait of Hormuz.
On Sunday, Iran denied it would participate in new peace talks with the US, hours after US President Donald Trump said US negotiators would head to Pakistan on Monday for a second round of peace talks with Iran.
These renewed tensions in the Middle East have dampened risk sentiment, with West Texas Intermediate (WTI), the US crude oil benchmark, trading above $86 during Asian trading hours, up nearly 4% on Monday. Cardano and other cryptocurrencies saw a slight pullback on Sunday, with ADA maintaining a capped tone heading into Monday.
Derivatives data shows a bearish bias
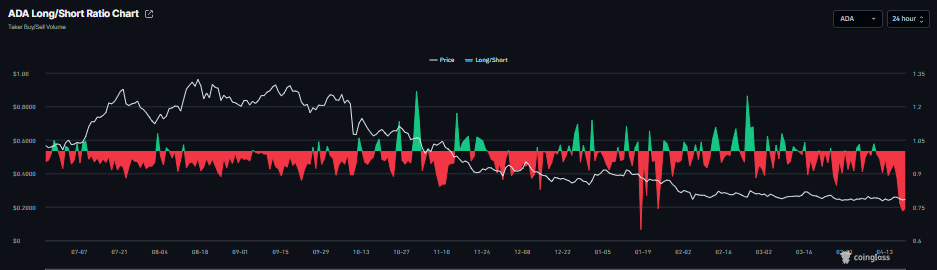
Cardano’s long-to-short ratio reads 0.74 on Monday, nearing the lowest level over a month. A ratio below 1 indicates bearish sentiment in the market, as traders are betting the asset’s price will fall.
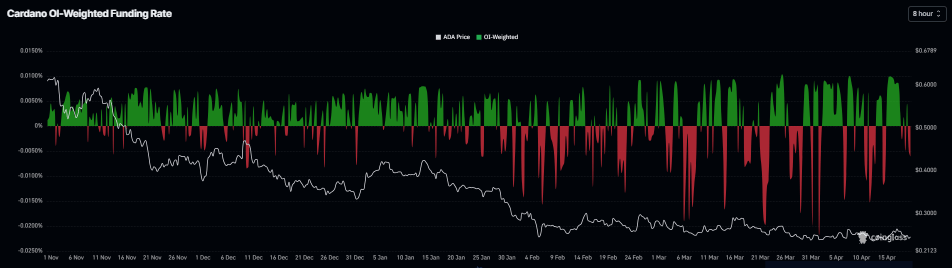
In addition, funding rates data also supports a bearish thesis. CoinGlass’ OI-Weighted Funding Rate data for Cardano flipped negative on Sunday and reads -0.0061% on Monday, indicating that shorts are paying the longs and projecting a bearish outlook.
Cardano Price Forecast: ADA momentum indicators show fading bullish strength
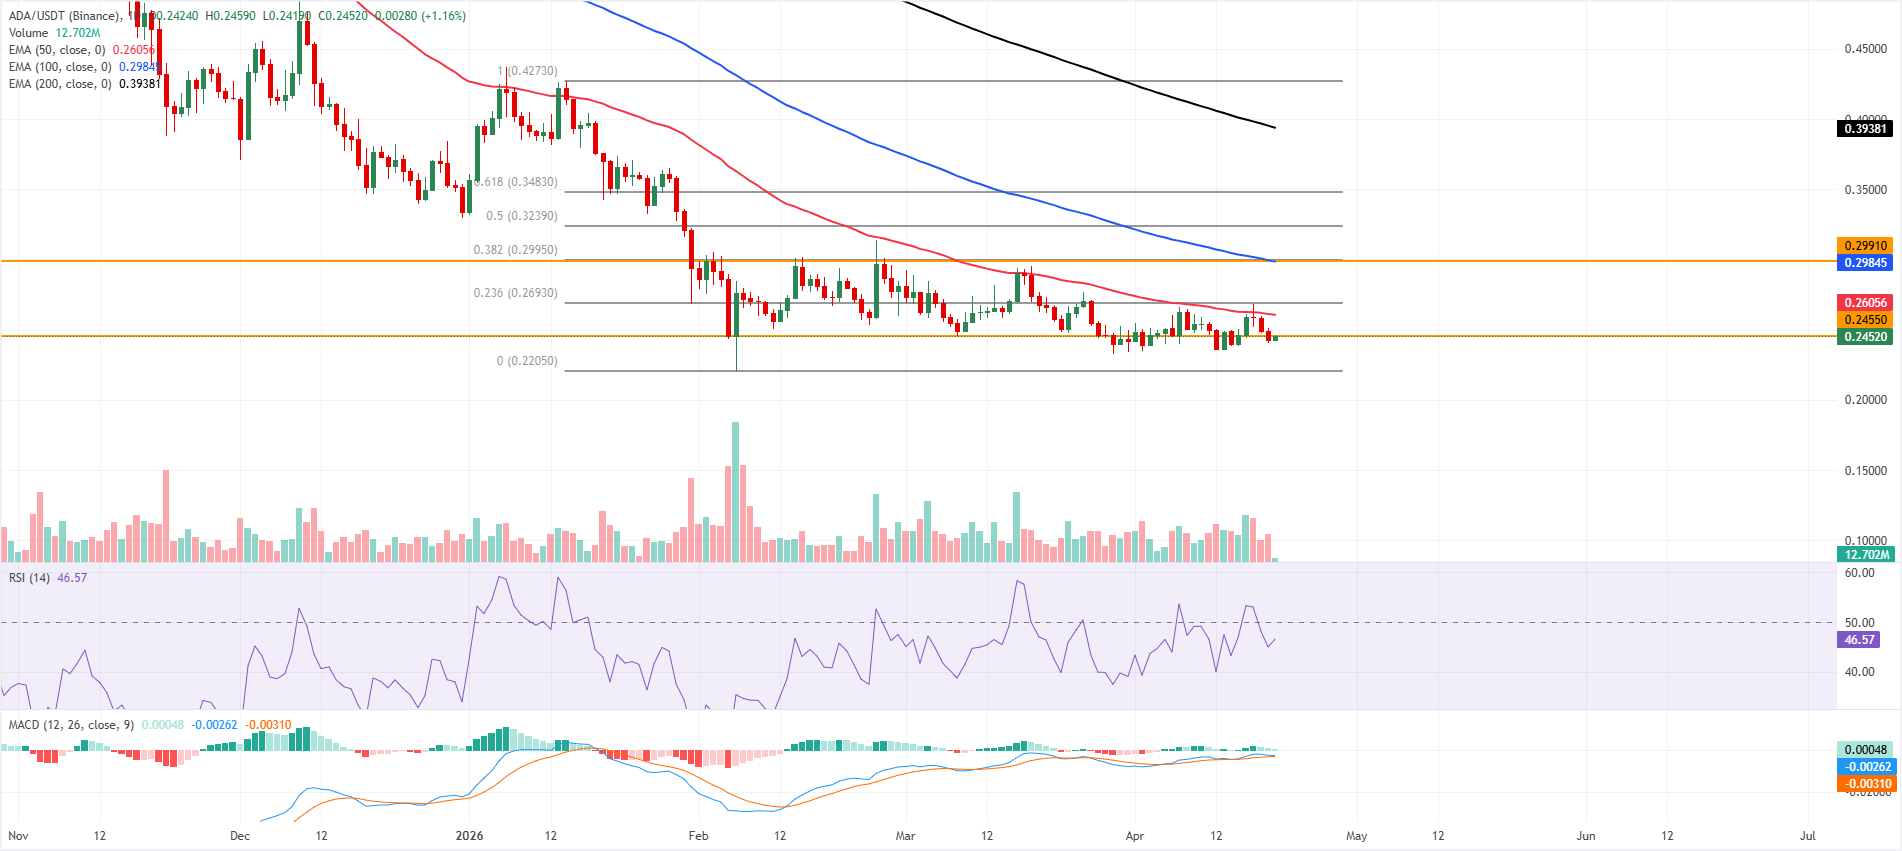
Cardano price is trading at $0.245, maintaining a capped tone as it holds below the 50-day, 100-day, and 200-day Exponential Moving Averages (EMAs) at $0.260, $0.298, and $0.393, respectively. The immediate focus is the nearby horizontal barrier at $0.245, with the Relative Strength Index (RSI) on the daily chart hovering near 46, while the Moving Average Convergence Divergence (MACD) remains marginally positive, hinting at only modest buying interest against a still dominant overhead structure.
On the topside, initial resistance is defined by that $0.245 horizontal level, followed by the 50-day EMA at $0.260 and the 23.6% Fibonacci retracement at $0.269. A more convincing recovery would confront a dense cluster around $0.298–$0.299, where the 100-day EMA, a horizontal barrier at $0.299 and the 38.2% retracement converge, before the broader bearish structure resumes toward higher Fibonacci levels and the 200-day EMA.
On the downside, the main structural support sits at the Fibonacci anchor near $0.220, with a daily close below that floor likely opening the way to a deeper corrective phase.
(The technical analysis of this story was written with the help of an AI tool.)

Plus d’un million d’utilisateurs se tournent vers FXStreet pour des données de marché en temps réel, des outils de graphiques, des analyses d’experts et des actualités Forex. Leur calendrier économique complet et leurs webinaires éducatifs aident les traders à rester informés et à prendre des décisions éclairées. FXStreet s’appuie sur une équipe d’environ 60 professionnels répartis entre le siège de Barcelone et diverses régions du monde.
Lire la suite


