
Cosmos Hub Price Forecast: ATOM extends gains as bullish derivatives data supports upside, BTC surges to $77,500
Par Manish Chhetri
Mis à jour: 22 Apr 2026


ARTICLES POPULAIRES

Cosmos Hub (ATOM) price extends its gains, trading above $1.89 on Wednesday, rallying nearly 8% so far this week as Bitcoin’s (BTC) surge toward $77,500 supports broader crypto strength.
- Cosmos Hub price extends its rally on Wednesday, gaining nearly 8% so far this week.
- Derivatives data points to a bullish outlook, with rising open interest and positive funding rates among ATOM traders.
- The technical outlook remains constructive, as momentum indicators remain bullish, while Bitcoin’s surge toward $77,500 adds further support to the broader market outlook.
Cosmos Hub (ATOM) price extends its gains, trading above $1.89 on Wednesday, rallying nearly 8% so far this week as Bitcoin’s (BTC) surge toward $77,500 supports broader crypto strength. Improving derivatives metrics and constructive technical outlook suggesting further upside potential for ATOM in the near term.
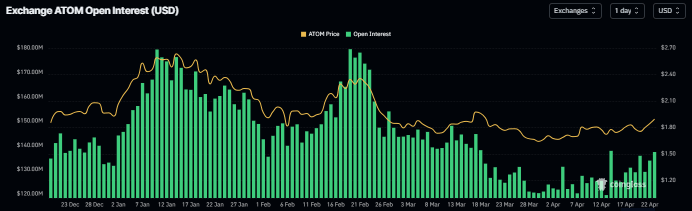
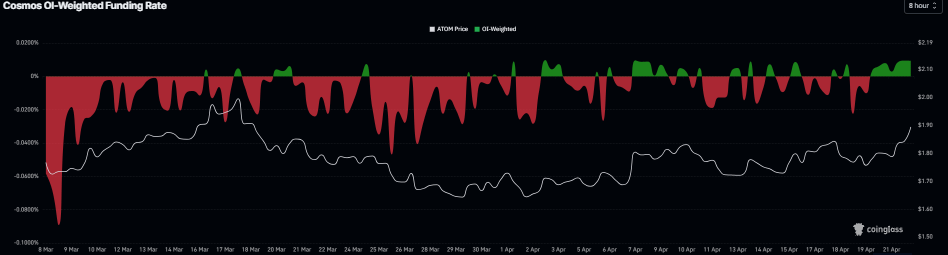
Derivatives data suggests a bullish bias
CoinGlass Open Interest (OI) for ATOM surges to $137.18 million on Wednesday, up from $125 million on April 15 and has been rising steadily since then. An increasing OI indicates new or additional money entering the market and new buying, which could fuel a rally in the ATOM price.
In addition, the funding rates also show a bullish bias. ATOM’s funding rates flipped positive on Monday and rose to 0.0093% on Wednesday, indicating that the longs are paying the shorts. Historically, when rates have turned positive and risen, the Cosmos Hub price has surged sharply.
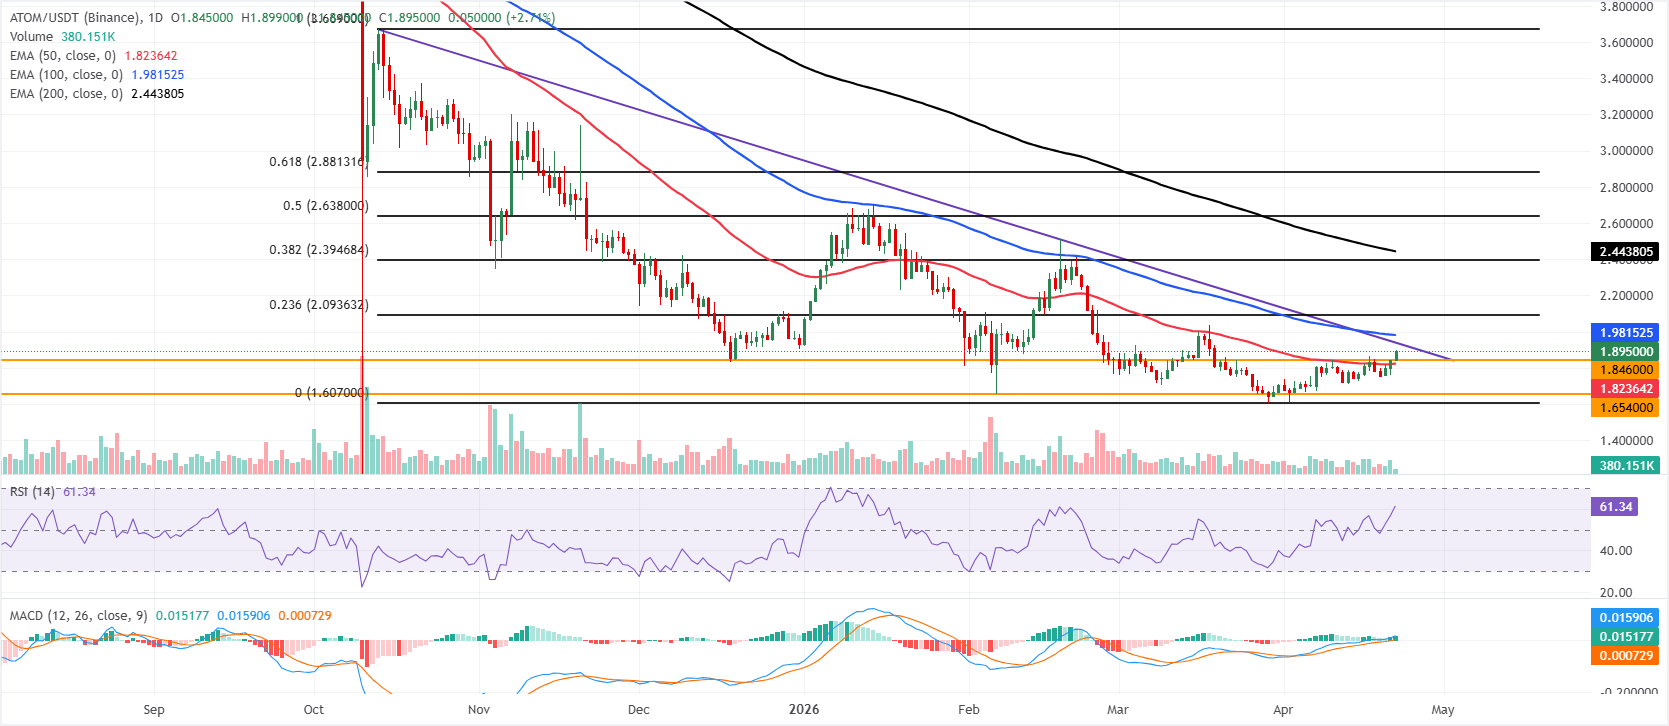
Cosmos Hub Price Forecast: ATOM near the descending trendline
ATOM is trading above $1.89 on Wednesday, maintaining a broadly capped tone as it holds above the 50-day Exponential Moving Average (EMA) at $1.82 but remains well below the 100- and 200-day EMAs at $1.98 and $2.44. ATOM is attempting to build a base after reclaiming nearby dynamic support, while the long-standing downward-sloping trendline, around $1.93, continues to define the immediate topside cap.
A rising Relative Strength Index (RSI) on the daily chart near 61 and a positive, expanding Moving Average Convergence Divergence (MACD) histogram hint that upside momentum is improving, yet these signals only soften, rather than reverse, the prevailing medium-term bearish backdrop set by the higher EMAs.
On the topside, initial resistance is clustered at the descending trendline break area near $1.93, followed by the 23.6% Fibonacci retracement of the $3.66–$1.60 decline at $2.09. Beyond that, the 38.2% retracement at $2.39 aligns with the 200-day EMA at $2.44 to form a more formidable barrier before the 50% retracement at $2.63.
On the downside, immediate support is seen at the horizontal level around $1.84, ahead of the 50-day EMA at $1.82; a break below these levels would expose the next floors at $1.65 and the cycle low area near $1.60, where bearish pressure could begin to exhaust.
(The technical analysis of this story was written with the help of an AI tool.)

Plus d’un million d’utilisateurs se tournent vers FXStreet pour des données de marché en temps réel, des outils de graphiques, des analyses d’experts et des actualités Forex. Leur calendrier économique complet et leurs webinaires éducatifs aident les traders à rester informés et à prendre des décisions éclairées. FXStreet s’appuie sur une équipe d’environ 60 professionnels répartis entre le siège de Barcelone et diverses régions du monde.
Lire la suite


