

Crypto Market Overview: Bitcoin regains strength – Zcash eyes record high, Pump.fun rebounds
- Bitcoin edges below $65,000 on Wednesday, as the 50-day EMA around $65,146 capped the previous day’s 4% rebound.
- Zcash trades above $550 on Wednesday following a 14% jump the previous day.
- Pump.fun is up roughly 7%, extending its recovery for the fourth consecutive day.
The broader cryptocurrency market shows near-term recovery signals with a weaker-than-expected US Consumer Price Index (CPI) report for June, easing inflation risks. Bitcoin (BTC) price hovers above $64,000 on Wednesday, testing the breakout of its 50-day Exponential Moving Average (EMA) at $65,146, which capped its previous day’s 4% rebound.
Among top altcoins, Zcash (ZEC) and Pump.fun (PUMP) are leading the gains over the last 24 hours, emerging as top performers while the broader market risk-off sentiment eases.
Bitcoin tests 50-day EMA breakout rally amid easing inflation risks
The US CPI data for June fell to 3.5%, below expectations of 3.8%, marking its largest monthly drop since May 2020. As a result, the odds of the Federal Reserve (Fed) hiking rates at the next meeting on July 29 dropped to 8%, prompting the quick recovery in the crypto market.
Bitcoin edges below $65,000 on Wednesday as the 50-day EMA at $65,146 capped the 4% gains from the previous day. Still, BTC maintains a recovery tone in the near term, testing a breakout above its 50-day EMA at $65,146, while the overhead 200-day EMA at $75,222 reflects a broader-term bearish trend.
A potential daily close above $65,146 would be needed to ease downside pressure before the more significant barrier at the $70,000 round figure, followed by the 200-day EMA near $75,222.
Momentum shows some stabilization on the daily chart, with the Relative Strength Index (RSI) hovering around 54 with further room to the upside, while the Moving Average Convergence Divergence (MACD) rises with its signal line.
On the downside, the key structural floor is the horizontal support zone at $60,000, where a deeper pullback could seek demand if sellers extend control from current levels.
Zcash and Pump.fun gain bullish momentum
Zcash trades above $550 on Wednesday, extending its advance above the 50-day EMA at $471 and the 200-day EMA at $389, which together reinforce a bullish near-term bias. The privacy coin also holds comfortably above the 78.6% Fibonacci retracement at $520, underscoring a well-supported structure.
Momentum aligns with this constructive backdrop, as the RSI at 62 is in positive territory without yet reaching overbought extremes, while the MACD stays firmly positive with its signal line, hinting at persistent buying pressure.
On the topside, immediate resistance emerges at the previous all-time high of $690, followed by the 127.2% Fibonacci extension level at $987.
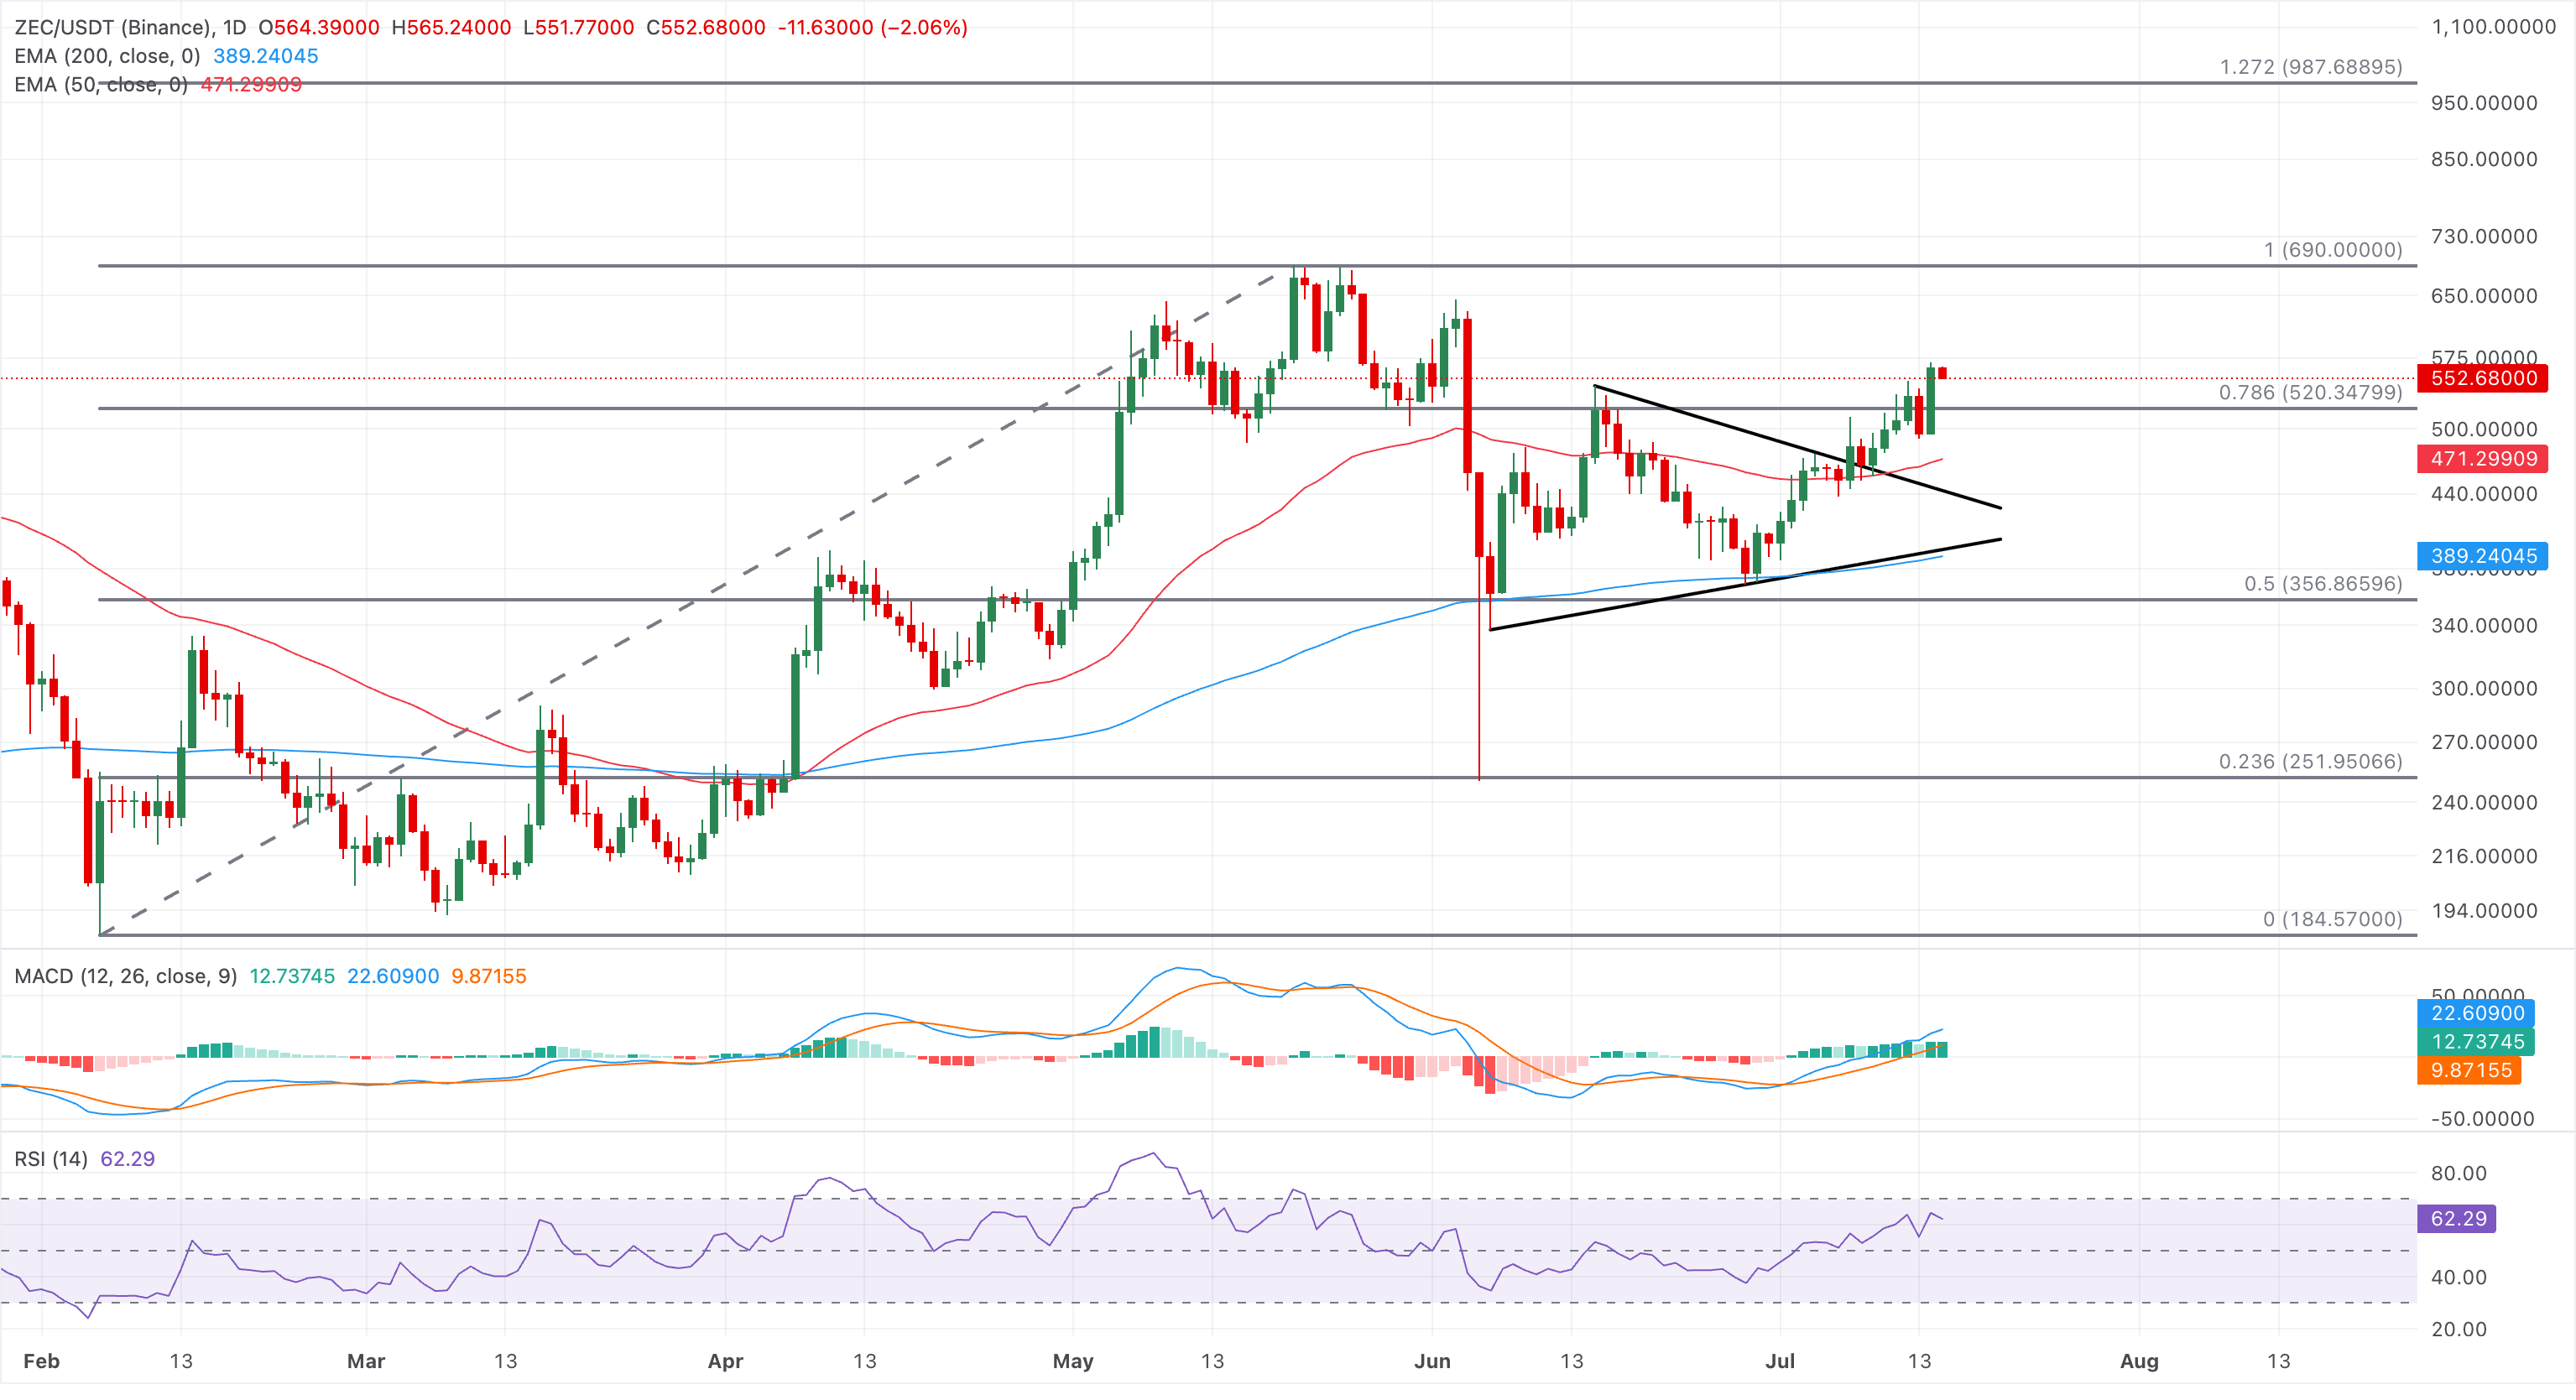
On the downside, initial support is seen at the 78.6% retracement at $520, followed by the 50-day EMA at $471.
Pump.fun shows a short-term recovery, challenging its capped tone, with gains of around 7% above its 50-day EMA at $0.001547 at press time on Wednesday. Still, PUMP token's broader structure remains capped below a descending resistance trendline near $0.001725 and its 200-day EMA at $0.001919.
Price is testing the 50% retracement near $0.001610, measured from $0.002251 to $0.001151, and a decisive close could target the 200-day EMA at $0.001919, near the 78.6% Fibonacci retracement at $0.001950.
The RSI at 57 remains in constructive territory, signaling renewed buying pressure, while an uptick in the MACD above its signal line suggests a lagging recovery, hinting at modest bullish momentum that has yet to challenge the broader downtrend.
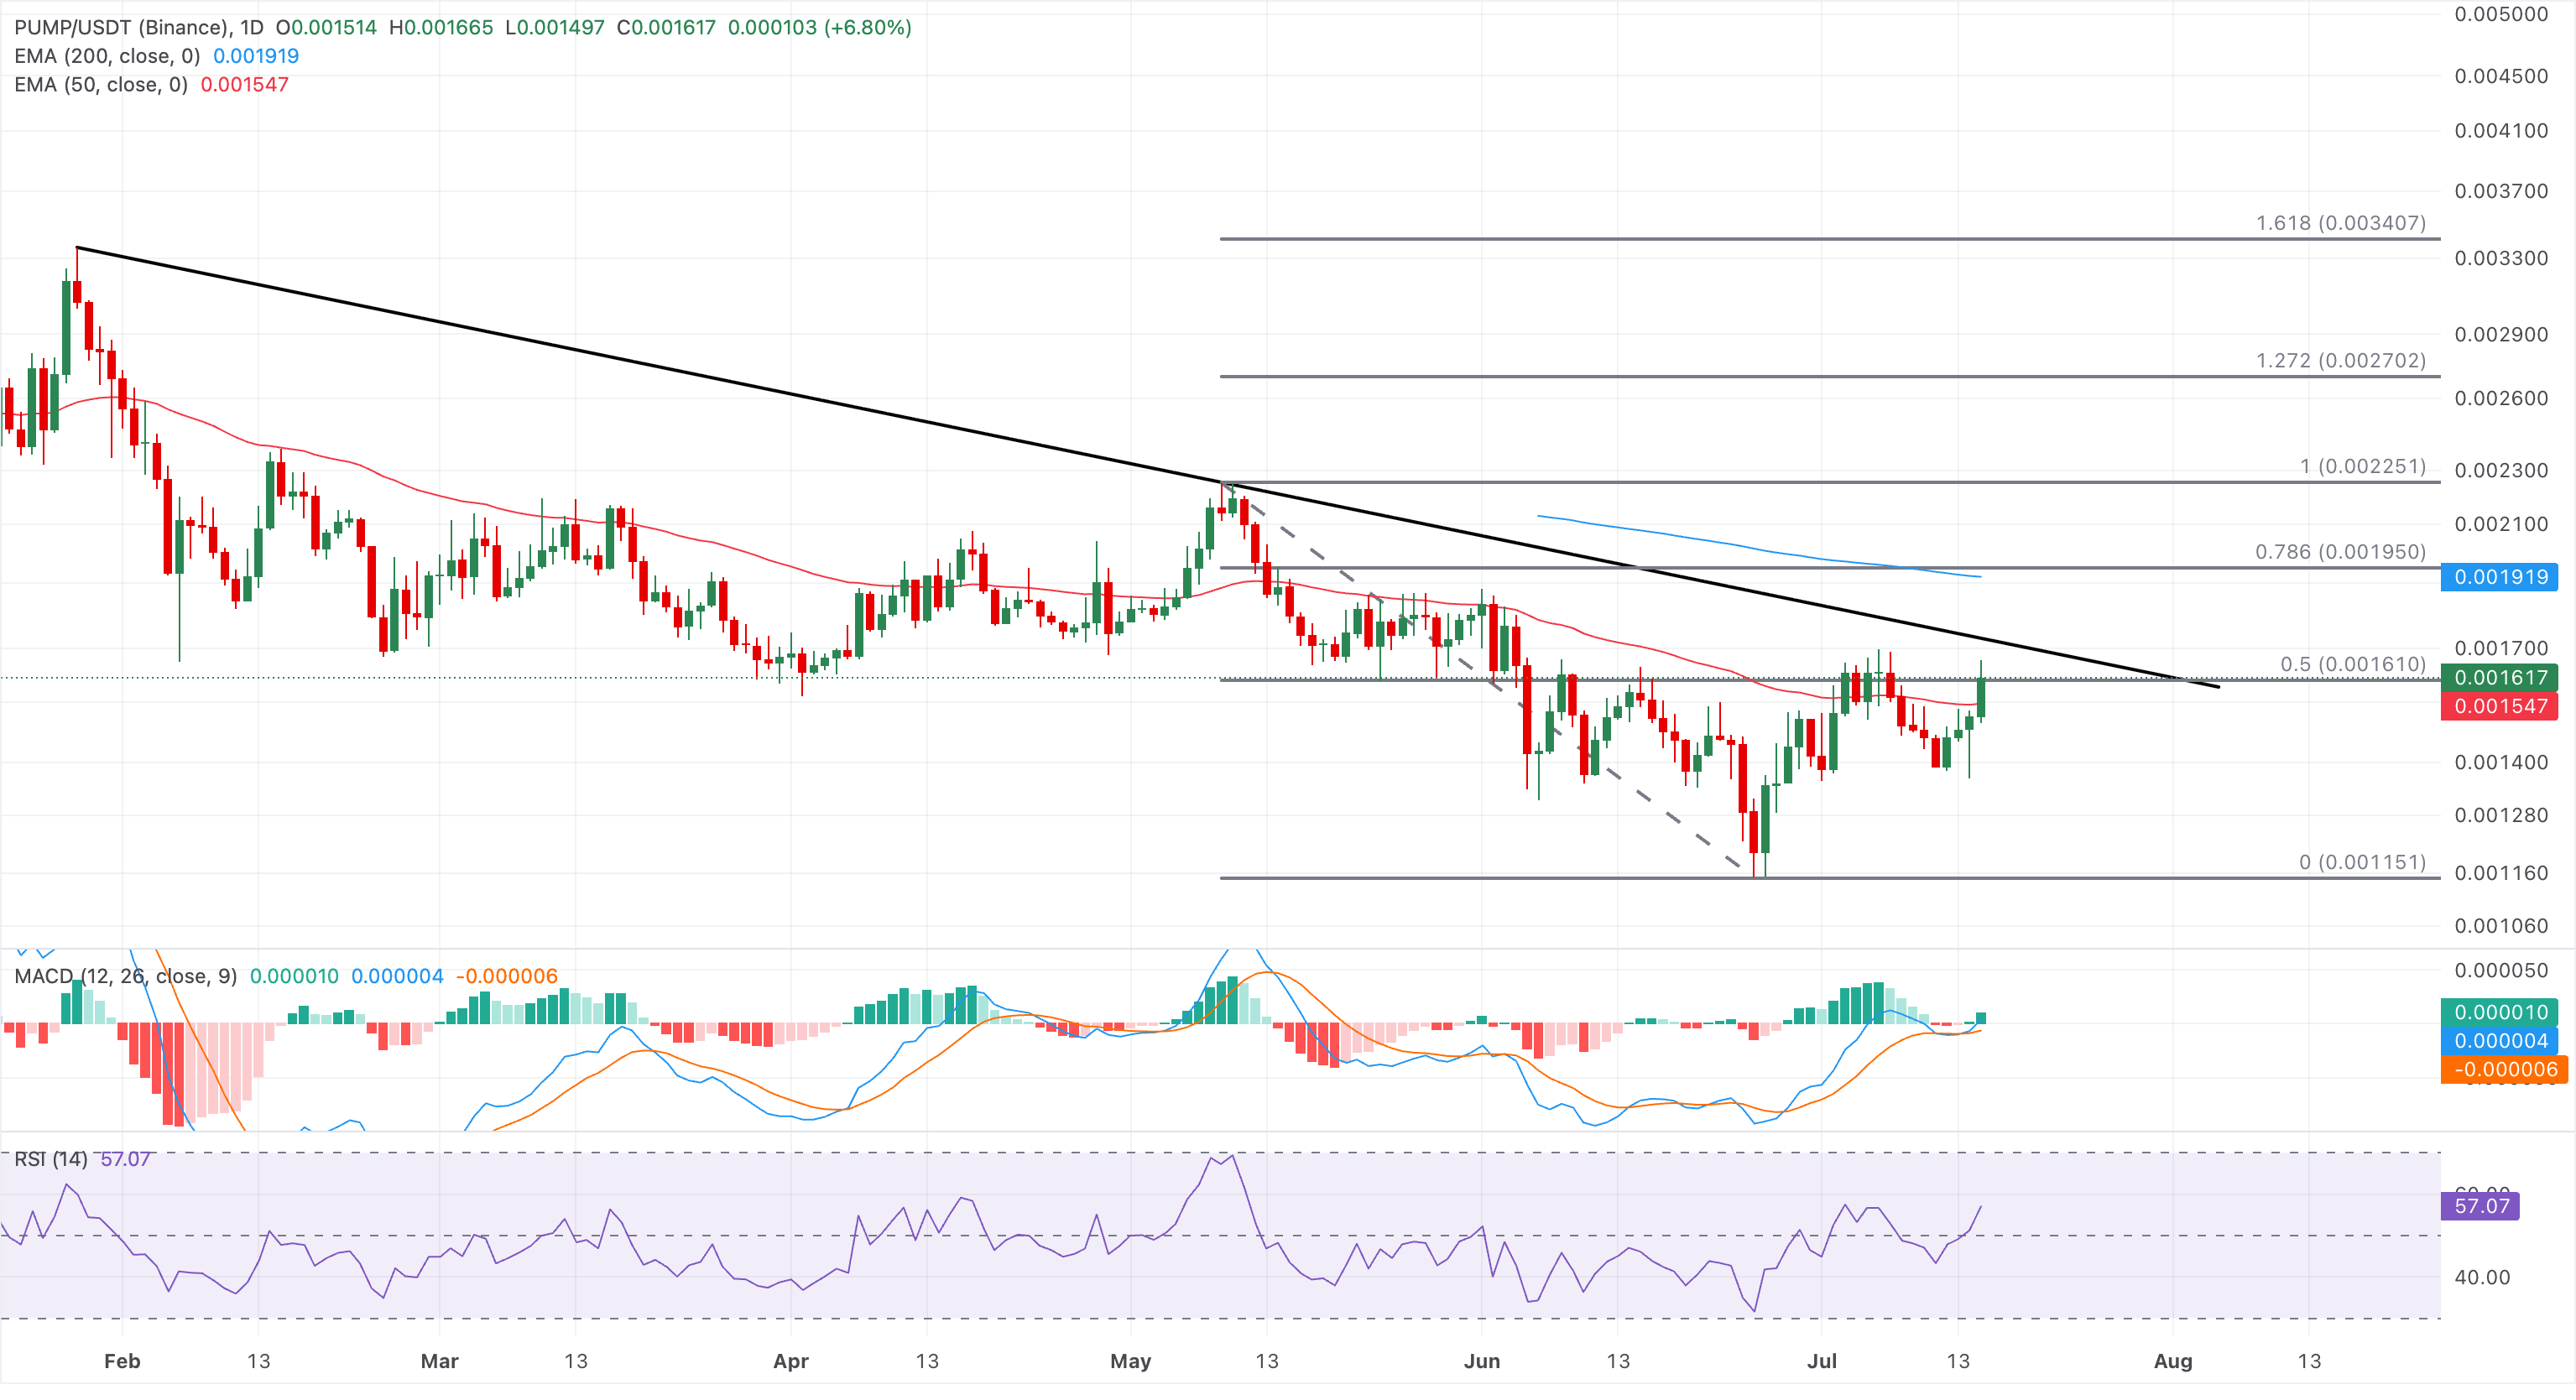
Looking down, immediate support is provided by the 50-day EMA at $0.001547, with further protection at the recent swing low zone anchored around $0.001151.
(The technical analysis of this story was written with the help of an AI tool. Know more.)














