
Crypto Overview: Bitcoin weighs BOJ hikes interest rate to 1%, Uniswap and LayerZero sustain
Par Vishal Dixit
Mis à jour: 16 Jun 2026


ARTICLES POPULAIRES

Bitcoin (BTC) is holding above $65,000 at press time on Tuesday as the Bank of Japan (BOJ) raises its interest rate to 1%, shifting focus away from the US-Iran peace agreement.
- Bitcoin edges below $65,000 on Tuesday, after three consecutive days of recovery.
- Broader market attention shifts from the US-Iran peace agreement to the Bank of Japan's rate-hike decision.
- Uniswap and LayerZero edges remain capped below key resistance levels, risking their recovery streaks.
Bitcoin (BTC) is holding above $65,000 at press time on Tuesday as the Bank of Japan (BOJ) raises its interest rate to 1%, shifting focus away from the US-Iran peace agreement.
Uniswap (UNI) and LayerZero (ZRO) edge lower on Tuesday but outpace the broader market over the last 24 hours as the retail sentiment recovers. The Fear and Greed Index, which stands at 25, up from 14 last week, indicates an easing of investor fear.
On the derivatives side, $488 million of total liquidation over the last 24 hours is led by $365 million of short liquidations, reflecting a largely bearish positional wipeout as spot prices rise.
Bitcoin risks losign $65,0000 amid the Bank of Japan’s rate hike
BOJ has increased the interest rate to 1%, the highest level since 1995. The rate hike could further impact the Yen carry trades into Bitcoin, as the previous increase to 0.75% from 0.50% in December coincided with a 25% decline in BTC across January and February.
Bitcoin maintains a mild bullish bias in the near-term following its rebound from $60,000 last week. Still, the price remains well below the 50-, 100-, and 200-day Exponential Moving Averages (EMAs), reflecting a broader downside trend.
The loss of the previously rising trendline, now overhead around $72,753, reinforces the idea that the market has broken its prior uptrend. That said, the Moving Average Convergence Divergence (MACD) has turned positive, hinting at an ongoing corrective bounce, while the Relative Strength Index (RSI) near 44 remains below the midline, suggesting that recovery attempts are still occurring within a broader corrective phase.
On the downside, the key level to watch is the horizontal floor at $65,000, where a daily close below it would open the path toward the $60,000 psychological support.
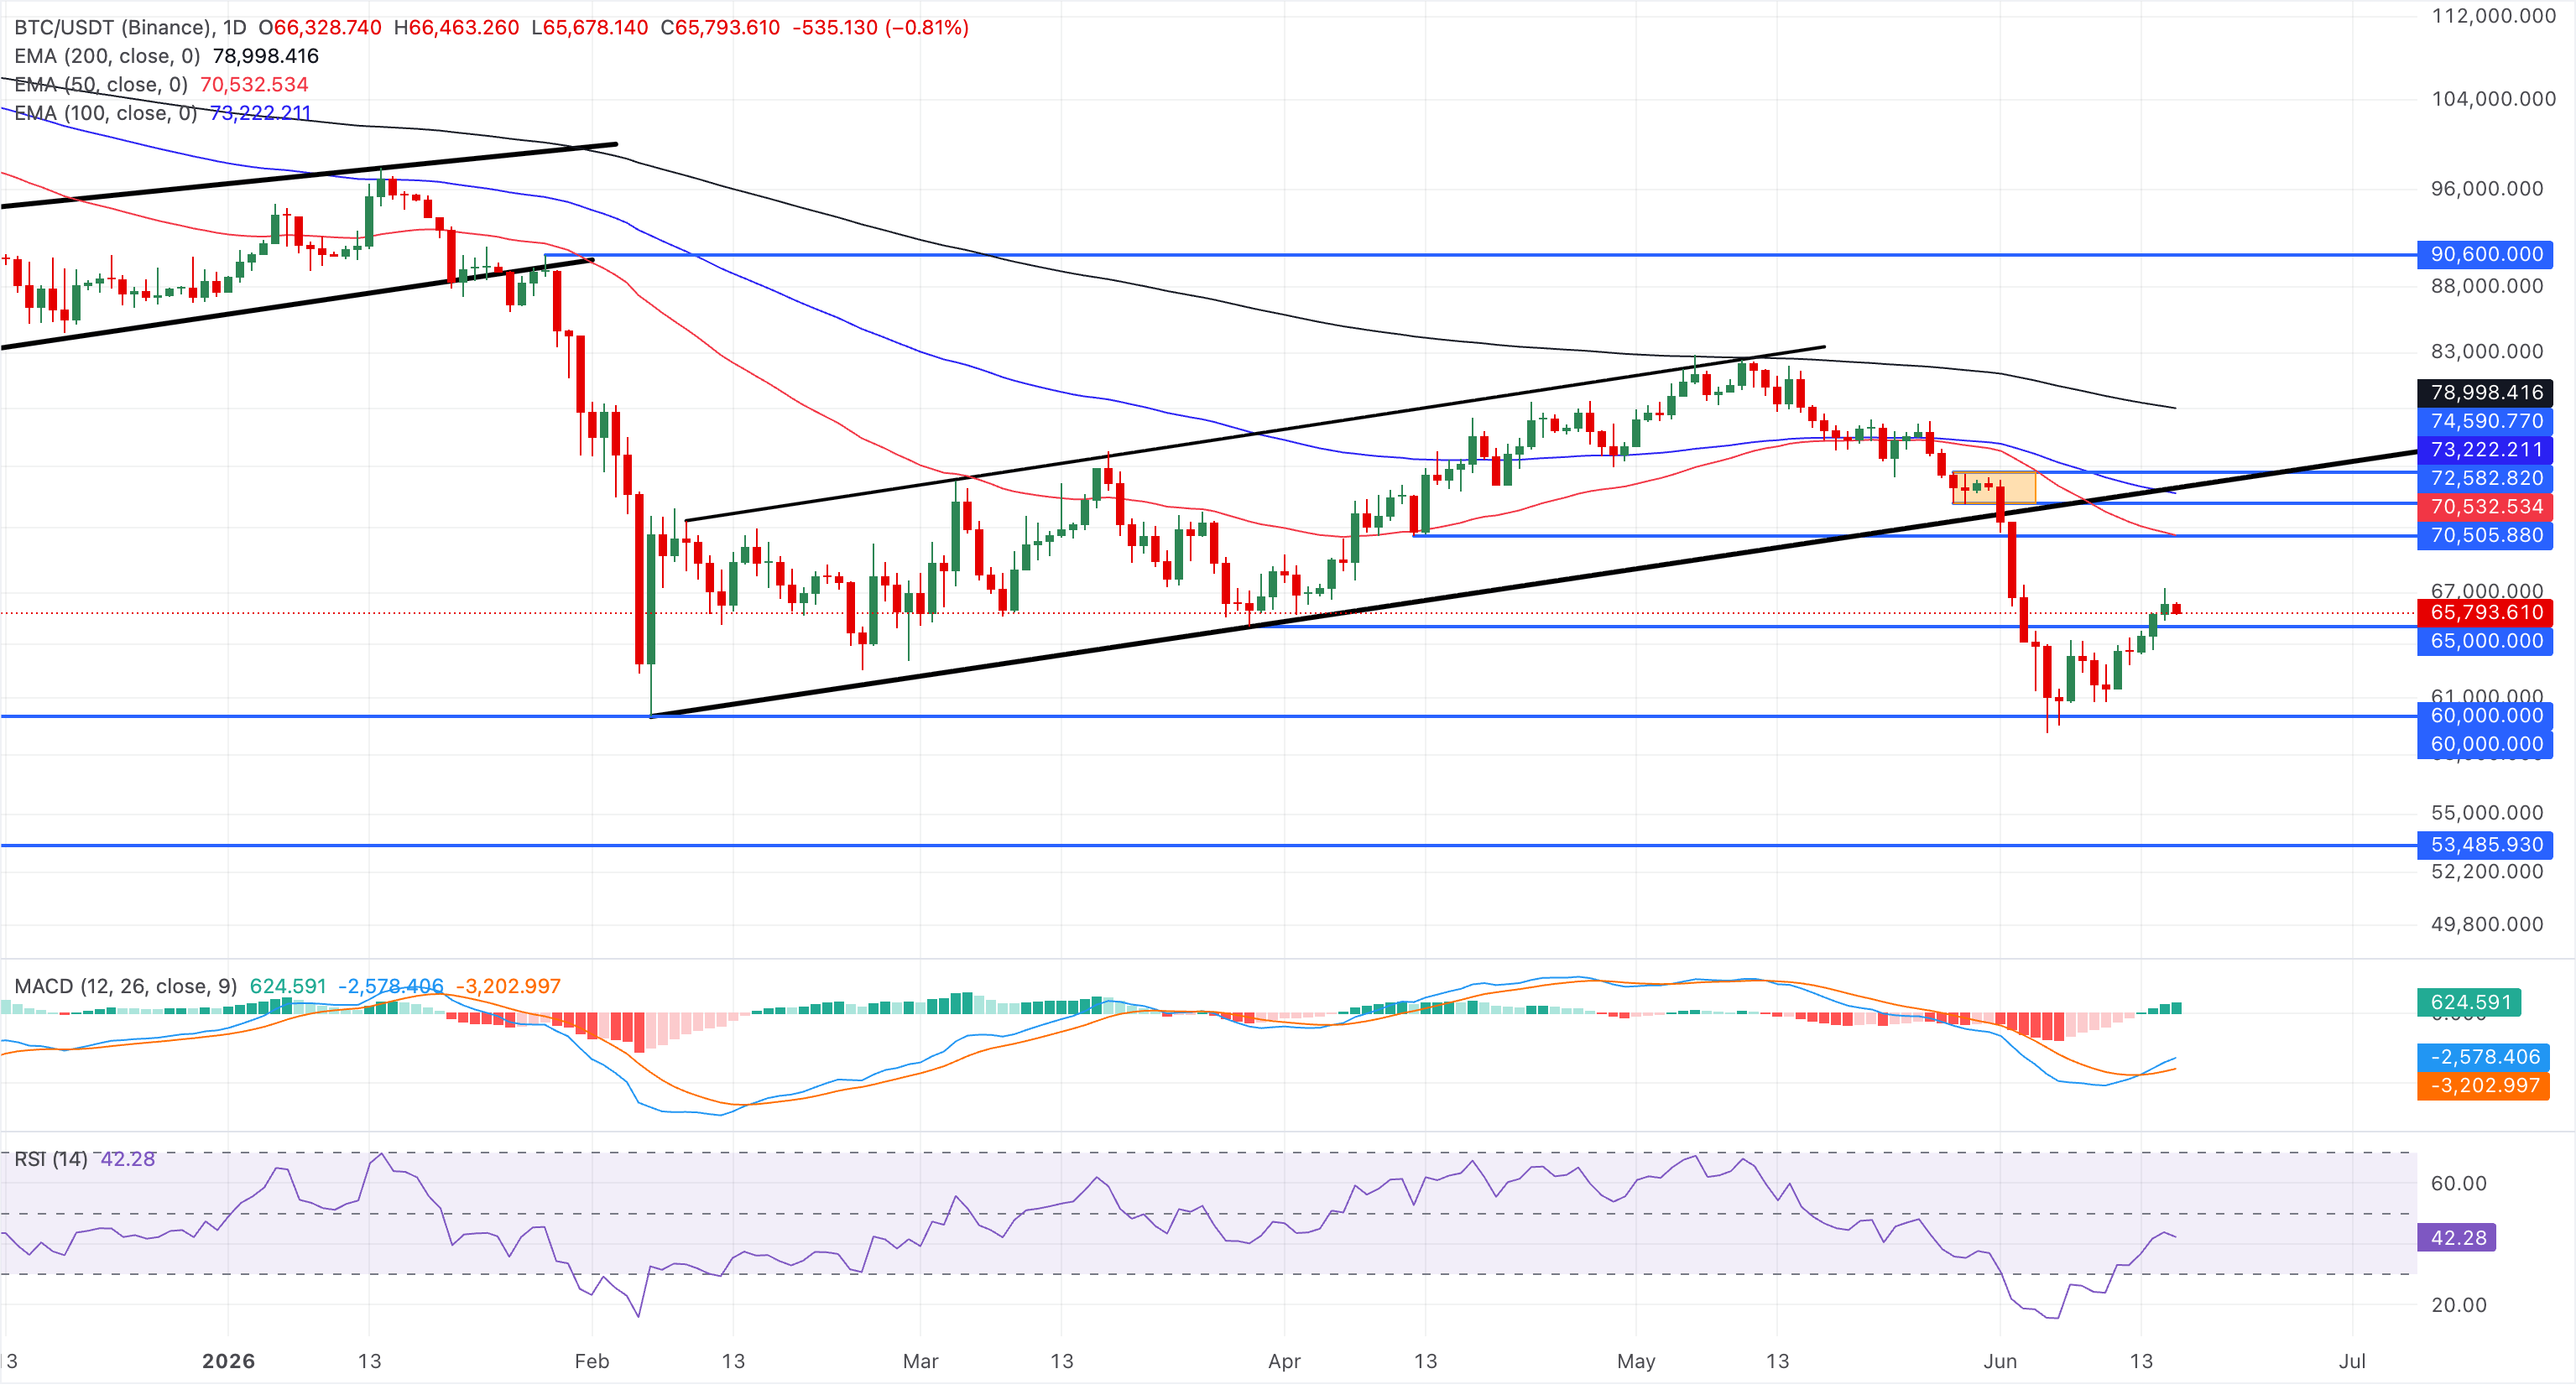
On the topside, initial resistance is seen at the 50-day EMA near $70,532, with the broken ascending trendline around $72,753 coming next and the 100-day EMA clustered just above at $73,222.
Uniswap and LayerZero risk losing their rebound gains
Uniswap edges lower on Tuesday as its 50-day EMA at $3.02 caps the intraday recovery following 10% gains the previous day. From a technical perspective, a bearish close to the day would break the streak of six-day recovery, risking a throwback to the $2.31 support floor from June 6.
The MACD histogram has turned positive, with the MACD line crossing above its signal line, while the RSI at around 54 hints at mildly improving momentum.
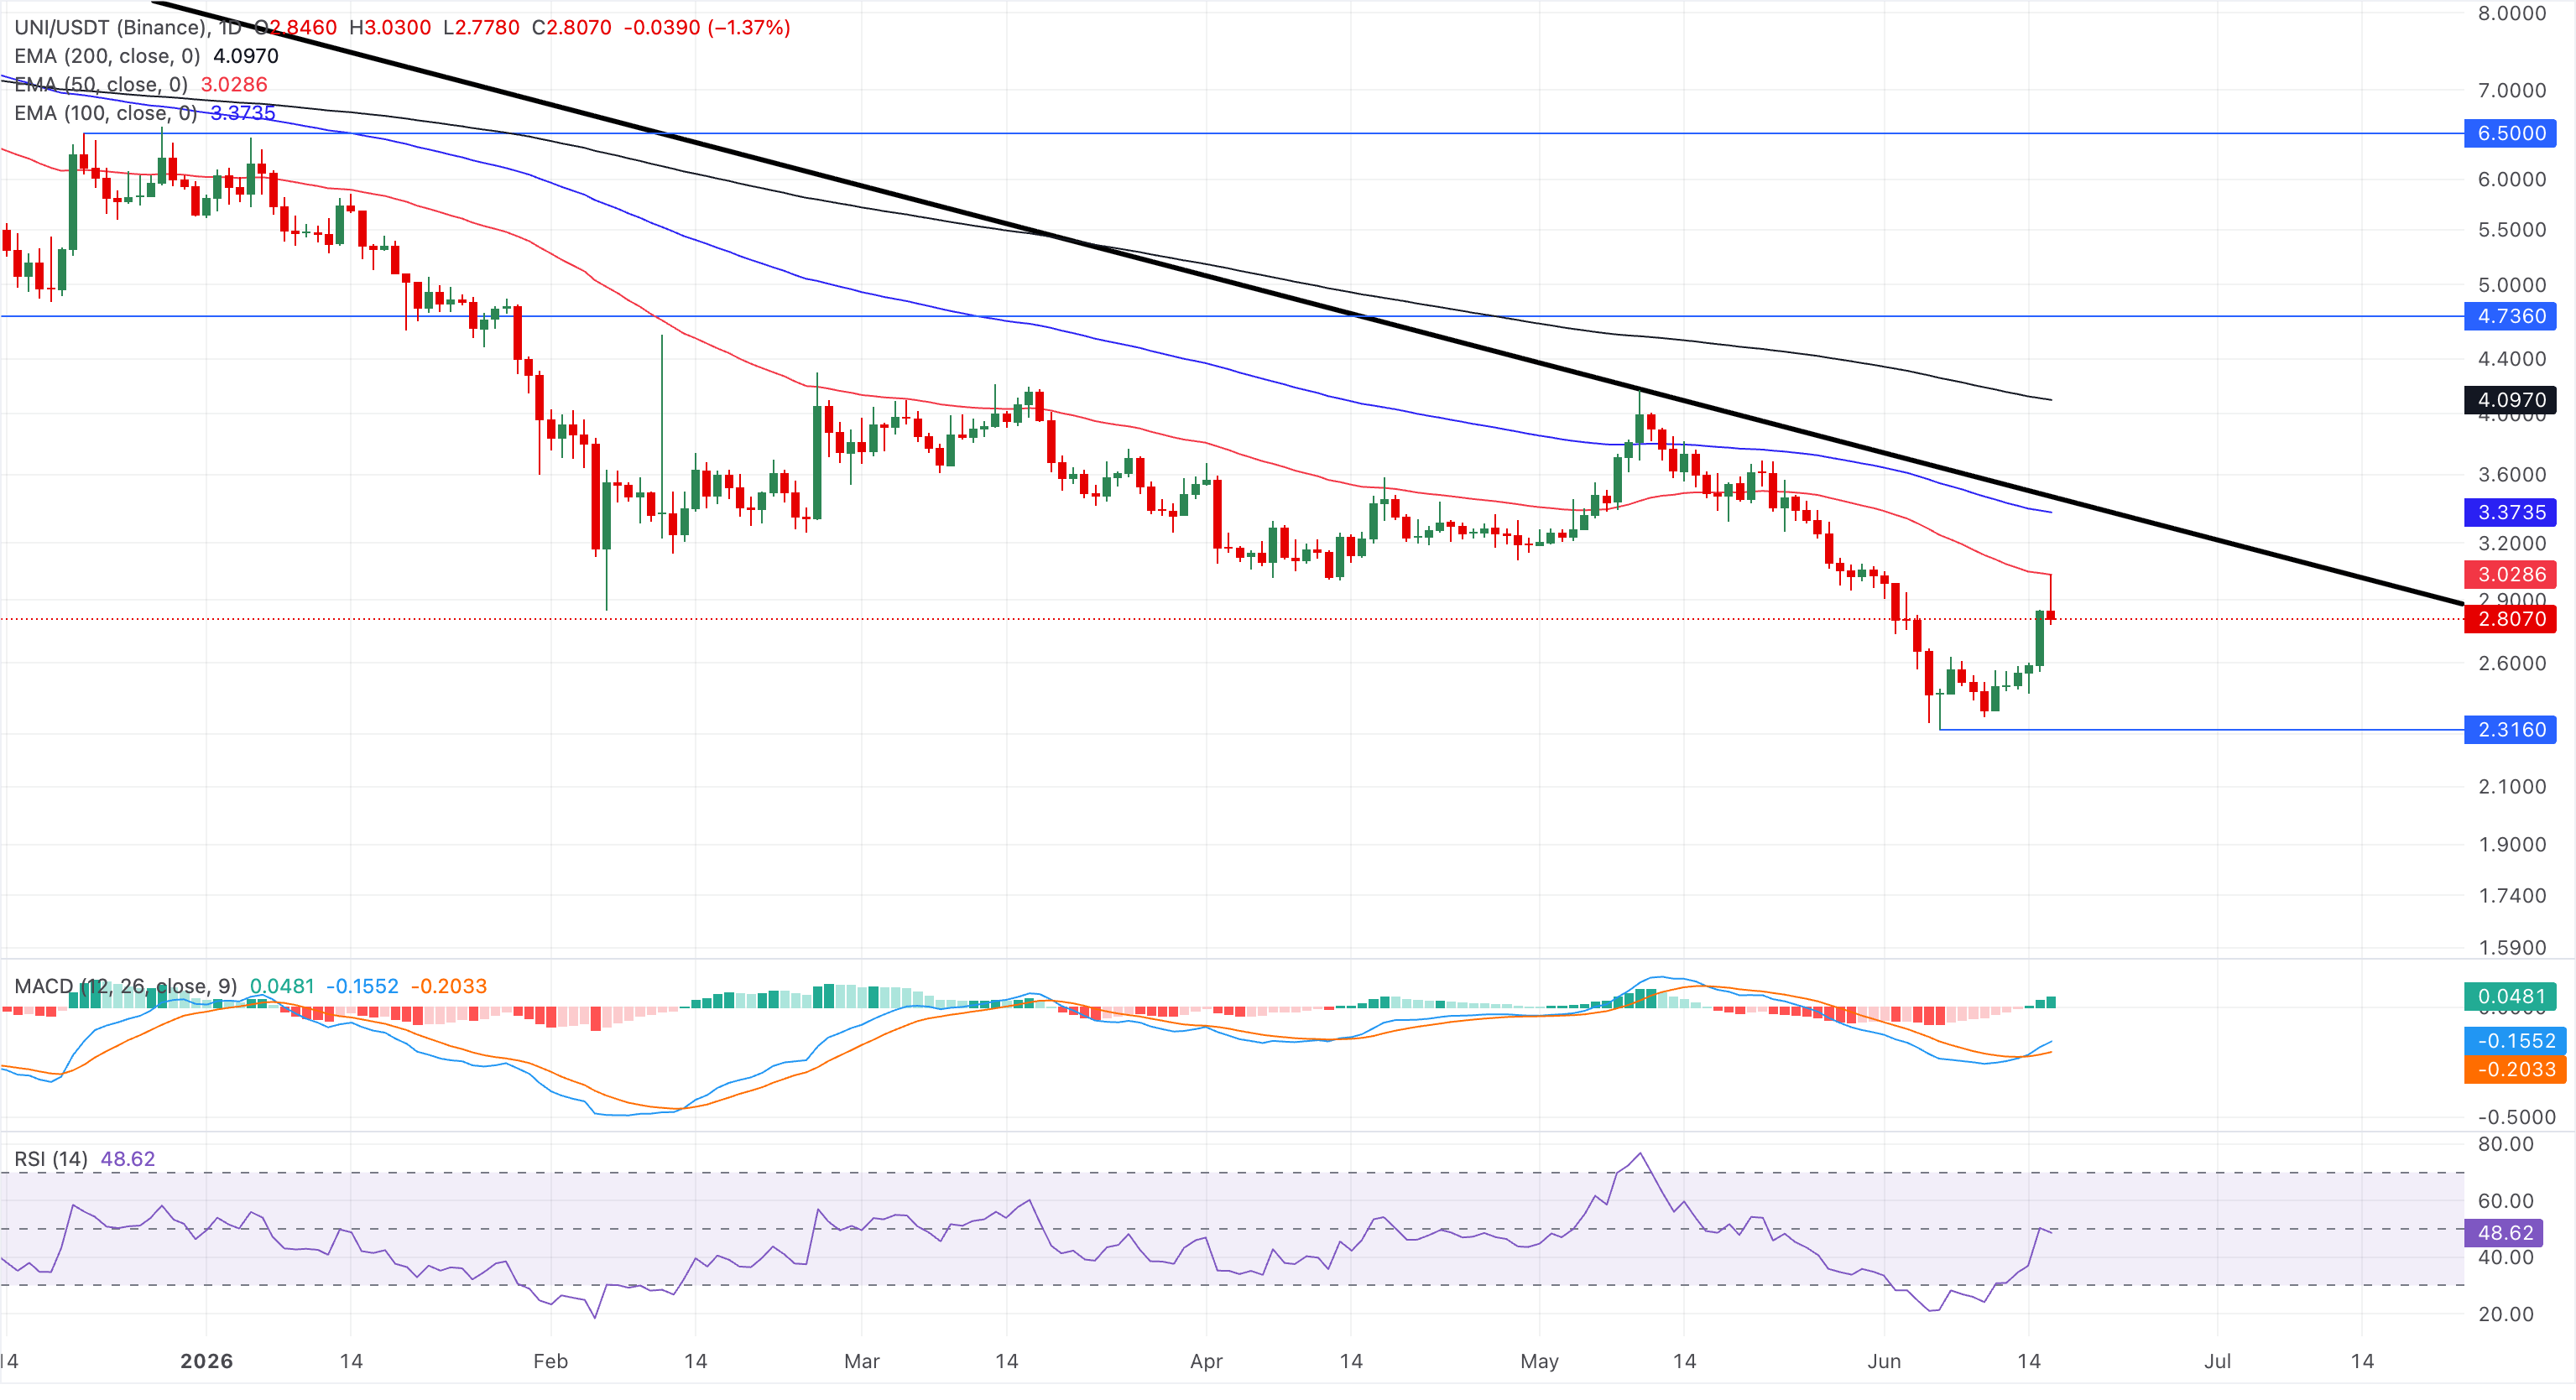
Initial resistance is located at the 50-day EMA near $3.03, with a break opening the way toward the 100-day EMA at roughly $3.37. Beyond that, the next notable barriers align at the former downward resistance trend-line break area around $3.96 and the 200-day EMA near $4.09, where sellers would likely reassert control if the recovery extends.
LayerZero trades above $1.00 at press time on Tuesday, holding in a broadly bearish configuration as price remains below the clustered EMAs, with the 50-day EMA at $1.2296, the 100-day EMA at $1.4176, and the 200-day EMA at $1.5901 acting as overhead supply.
A downward resistance trend line, whose break level comes in near $1.2209, further reinforces the topside cap, even as momentum has improved. The MACD has crossed above the signal line with a positive, expanding histogram, while the RSI at 50 hovers near the midline, suggesting a modest recovery attempt within a still-dominant downtrend.
Looking up, initial resistance is at the break of the downward trendline around $1.2209, followed closely by the 50-day EMA at $1.2296, forming a nearby supply zone that bulls would need to clear to extend the rebound.
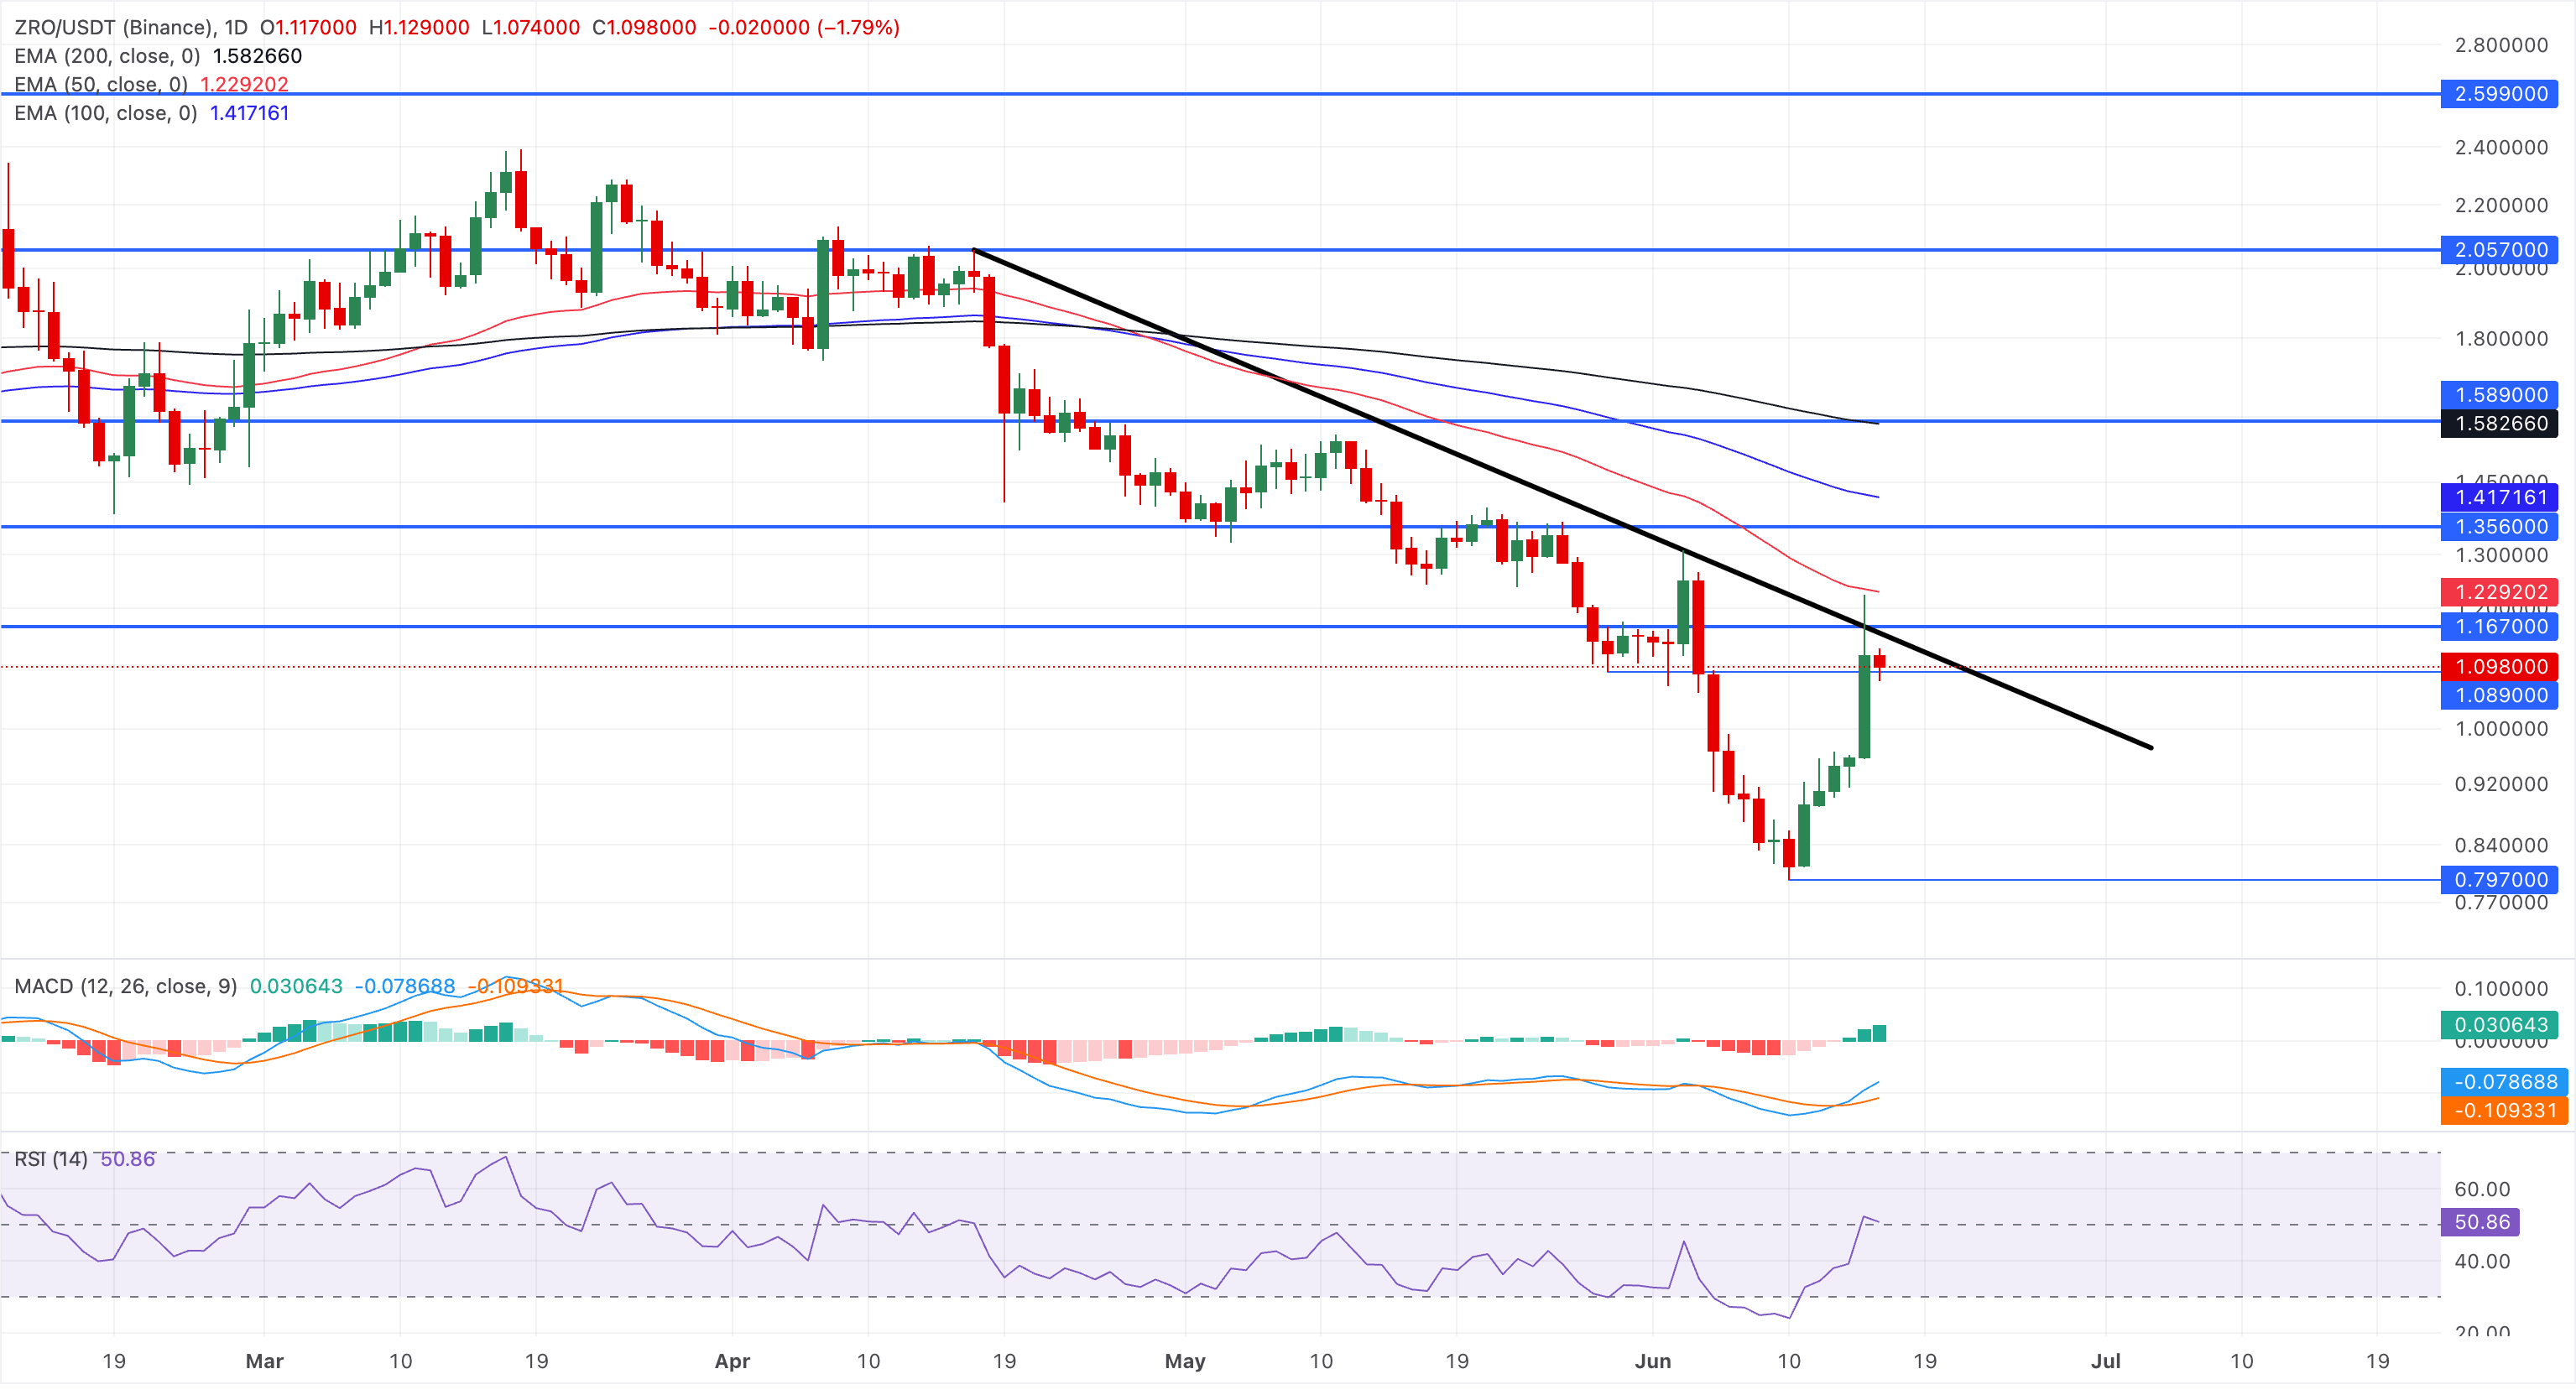
A slip below the $1.00 psychological level could erase the six-day recovery in ZRO, testing Wednesday's low of $0.7970.
(The technical analysis of this story was written with the help of an AI tool.)

Plus d’un million d’utilisateurs se tournent vers FXStreet pour des données de marché en temps réel, des outils de graphiques, des analyses d’experts et des actualités Forex. Leur calendrier économique complet et leurs webinaires éducatifs aident les traders à rester informés et à prendre des décisions éclairées. FXStreet s’appuie sur une équipe d’environ 60 professionnels répartis entre le siège de Barcelone et diverses régions du monde.
Lire la suite


