
Crypto Overview: Fed decision triggers $500 million in liquidations – Terra Classic, Dogecoin lead gains
Par Vishal Dixit
Mis à jour: 30 Apr 2026


ARTICLES POPULAIRES

Bitcoin (BTC) stalls above $76,000 at press time on Thursday as the US Federal Reserve keeps the interest rates steady. Still, the short-term volatility surge triggered over $500 million in liquidations within 24 hours.
- Bitcoin hovers above $76,000 on Thursday, holding steady after the Federal Reserve kept the interest rates unchanged.
- Total market liquidations cross $500 million in 24 hours, reflecting increased volatility after the Fed’s decision.
- Terra Classic and Dogecoin are leading the broader gains over the last 24 hours.
Bitcoin (BTC) stalls above $76,000 at press time on Thursday as the US Federal Reserve keeps the interest rates steady. Still, the short-term volatility surge triggered over $500 million in liquidations within 24 hours. Meanwhile, Terra Classic (LUNC) and Dogecoin (DOGE) maintain bullish momentum and are the top gainers over the last 24 hours.
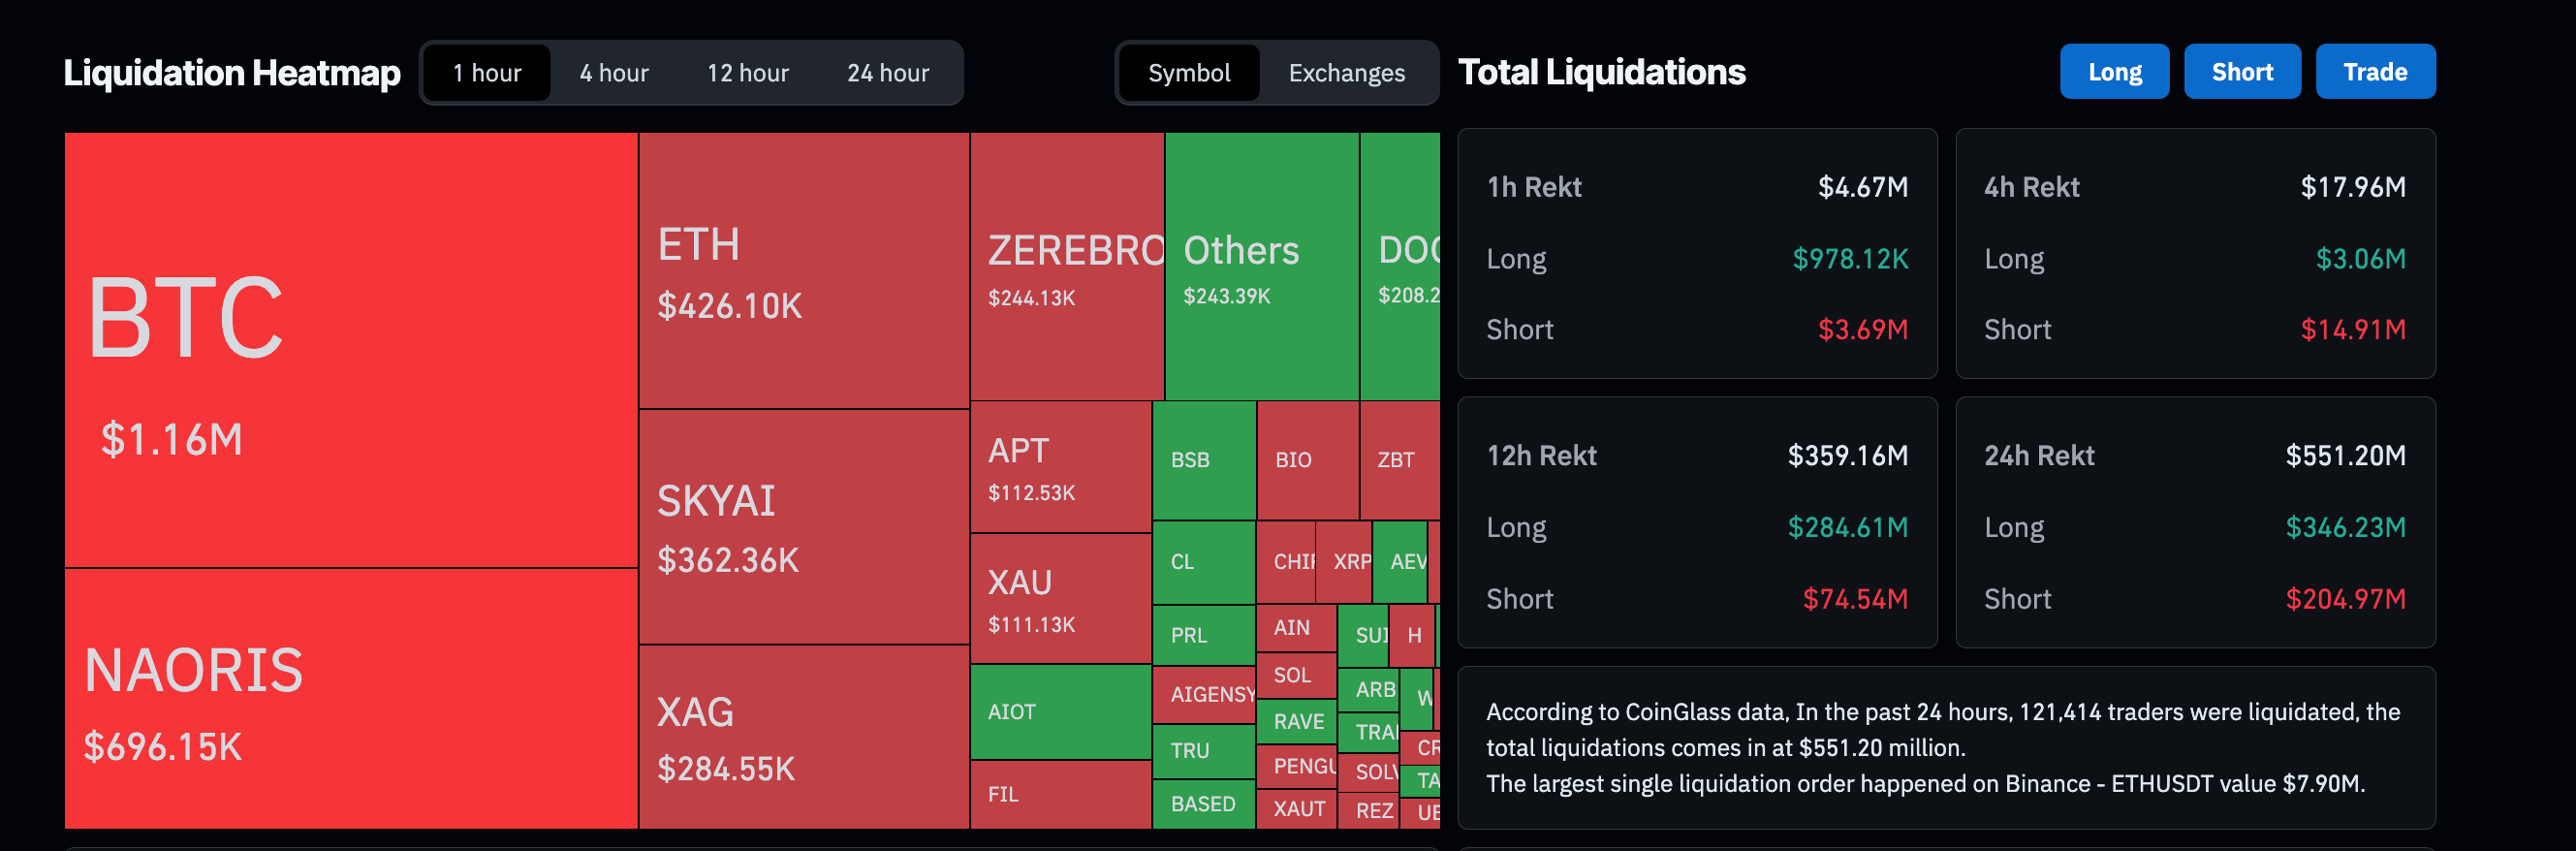
US Fed decision triggers over $500 million in liquidations
The US Federal Reserve decided to keep the interest rates steady between 3.50% and 3.75% amid inflation fears linked to the ongoing US-Iran conflict. The decision wiped out previous days’ gains, leading to a bearish close in Bitcoin on Wednesday and triggering broader market volatility.
CoinGlass data shows that total liquidations reached $551 million over the last 24 hours, led by $346 million in long liquidations, signaling a bearish trend.
Bitcoin stalls around $76,000 as bullish bias wanes
Bitcoin maintains a constructive bullish bias at $76,000, holding comfortably above the 50-day Exponential Moving Average (EMA) at $73,668. Still, BTC trades well beneath the longer-term 200-day EMA at $82,287, which looms as a major topside obstacle.
The Relative Strength Index (RSI) at 55 indicates moderate bullish momentum without overbought conditions, while a negative Moving Average Convergence Divergence (MACD) below the signal line suggests that upside momentum wanes despite price resilience.
On the topside, the April 22 high at $79,472, close to the overhead trendline near $80,000, serves as the next significant resistance level, and a daily close above this barrier would be needed to reinforce the broader bullish narrative and open the way toward the 200-day EMA at $82,287.
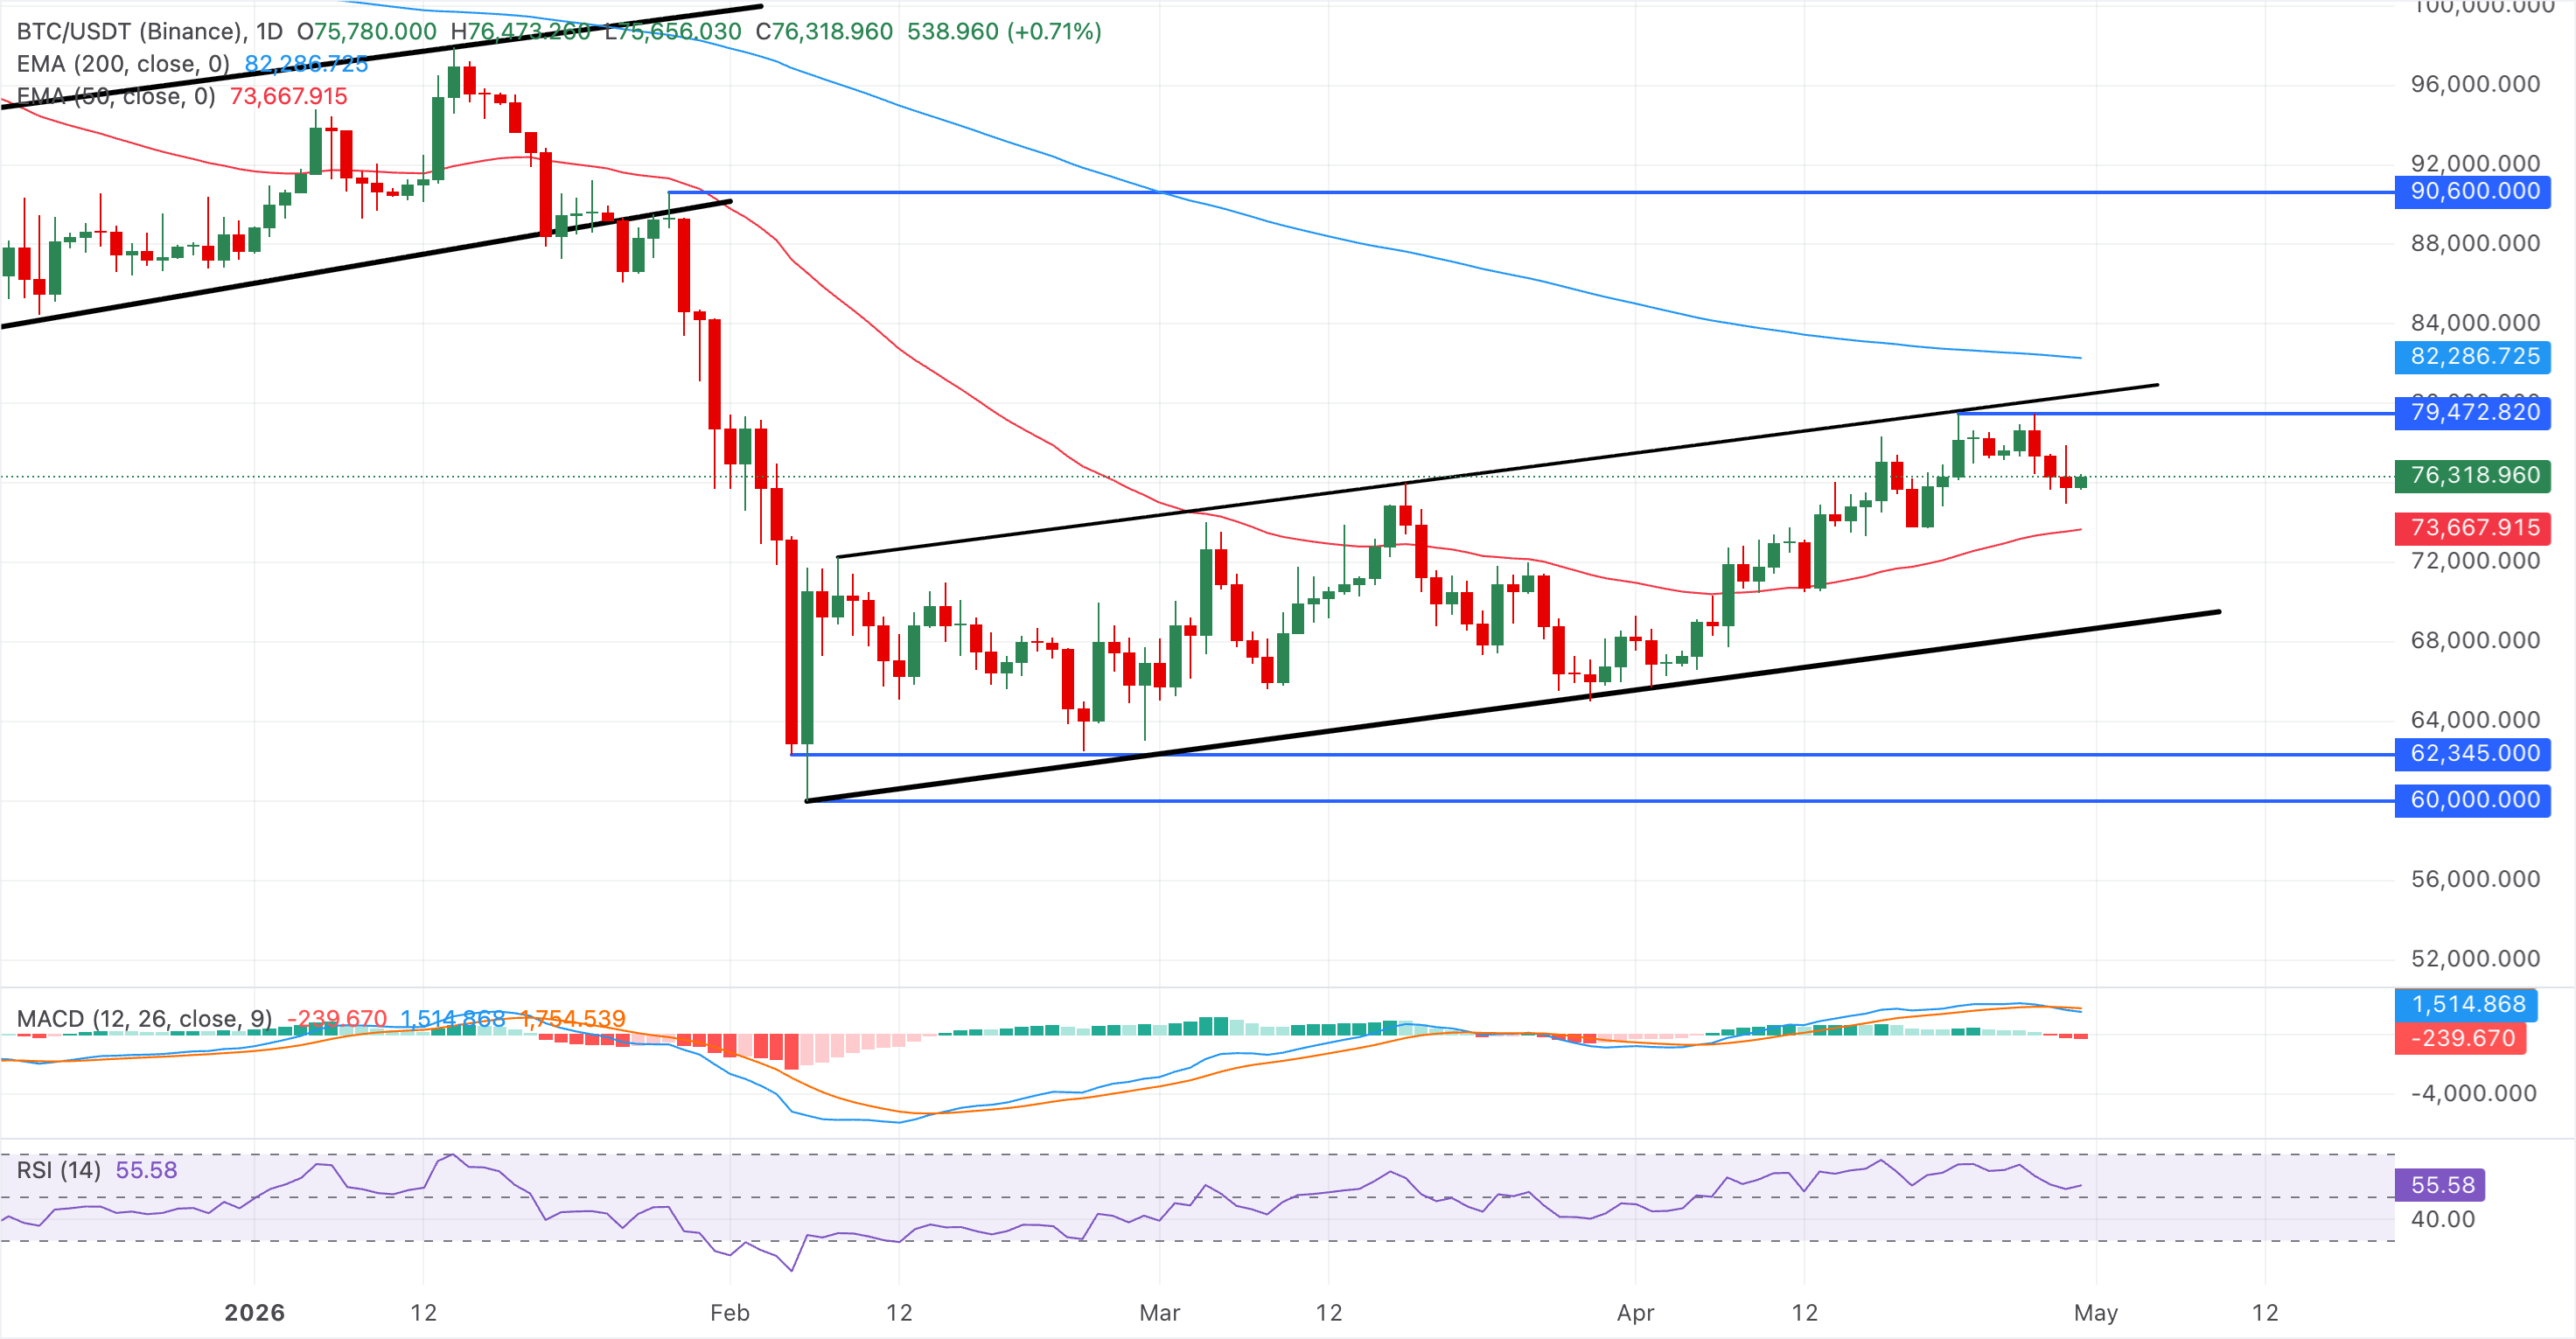
On the downside, immediate support is seen at the 50-day EMA at $73,668, with the rising support trendline near $70,000 providing a deeper structural floor if a sharper correction unfolds.
Terra Classic and Dogecoin hint at further upside
Terra Classic shows steady, nonlinear growth, reflecting an emerging bullish undertone despite the extremely tight price range. At the time of writing, LUNC tests the 78.6% Fibonacci retracement level at $0.0000700, measured over the downswing from $0.000081 to $0.000030.
The RSI at 77 suggests overbought conditions that could slow immediate upside even as underlying momentum remains constructive, while the MACD hovers around the signal line, reinforcing a nascent rather than fully established uptrend.
A decisive close above $0.000070 would open the way to the $0.000081 swing high.
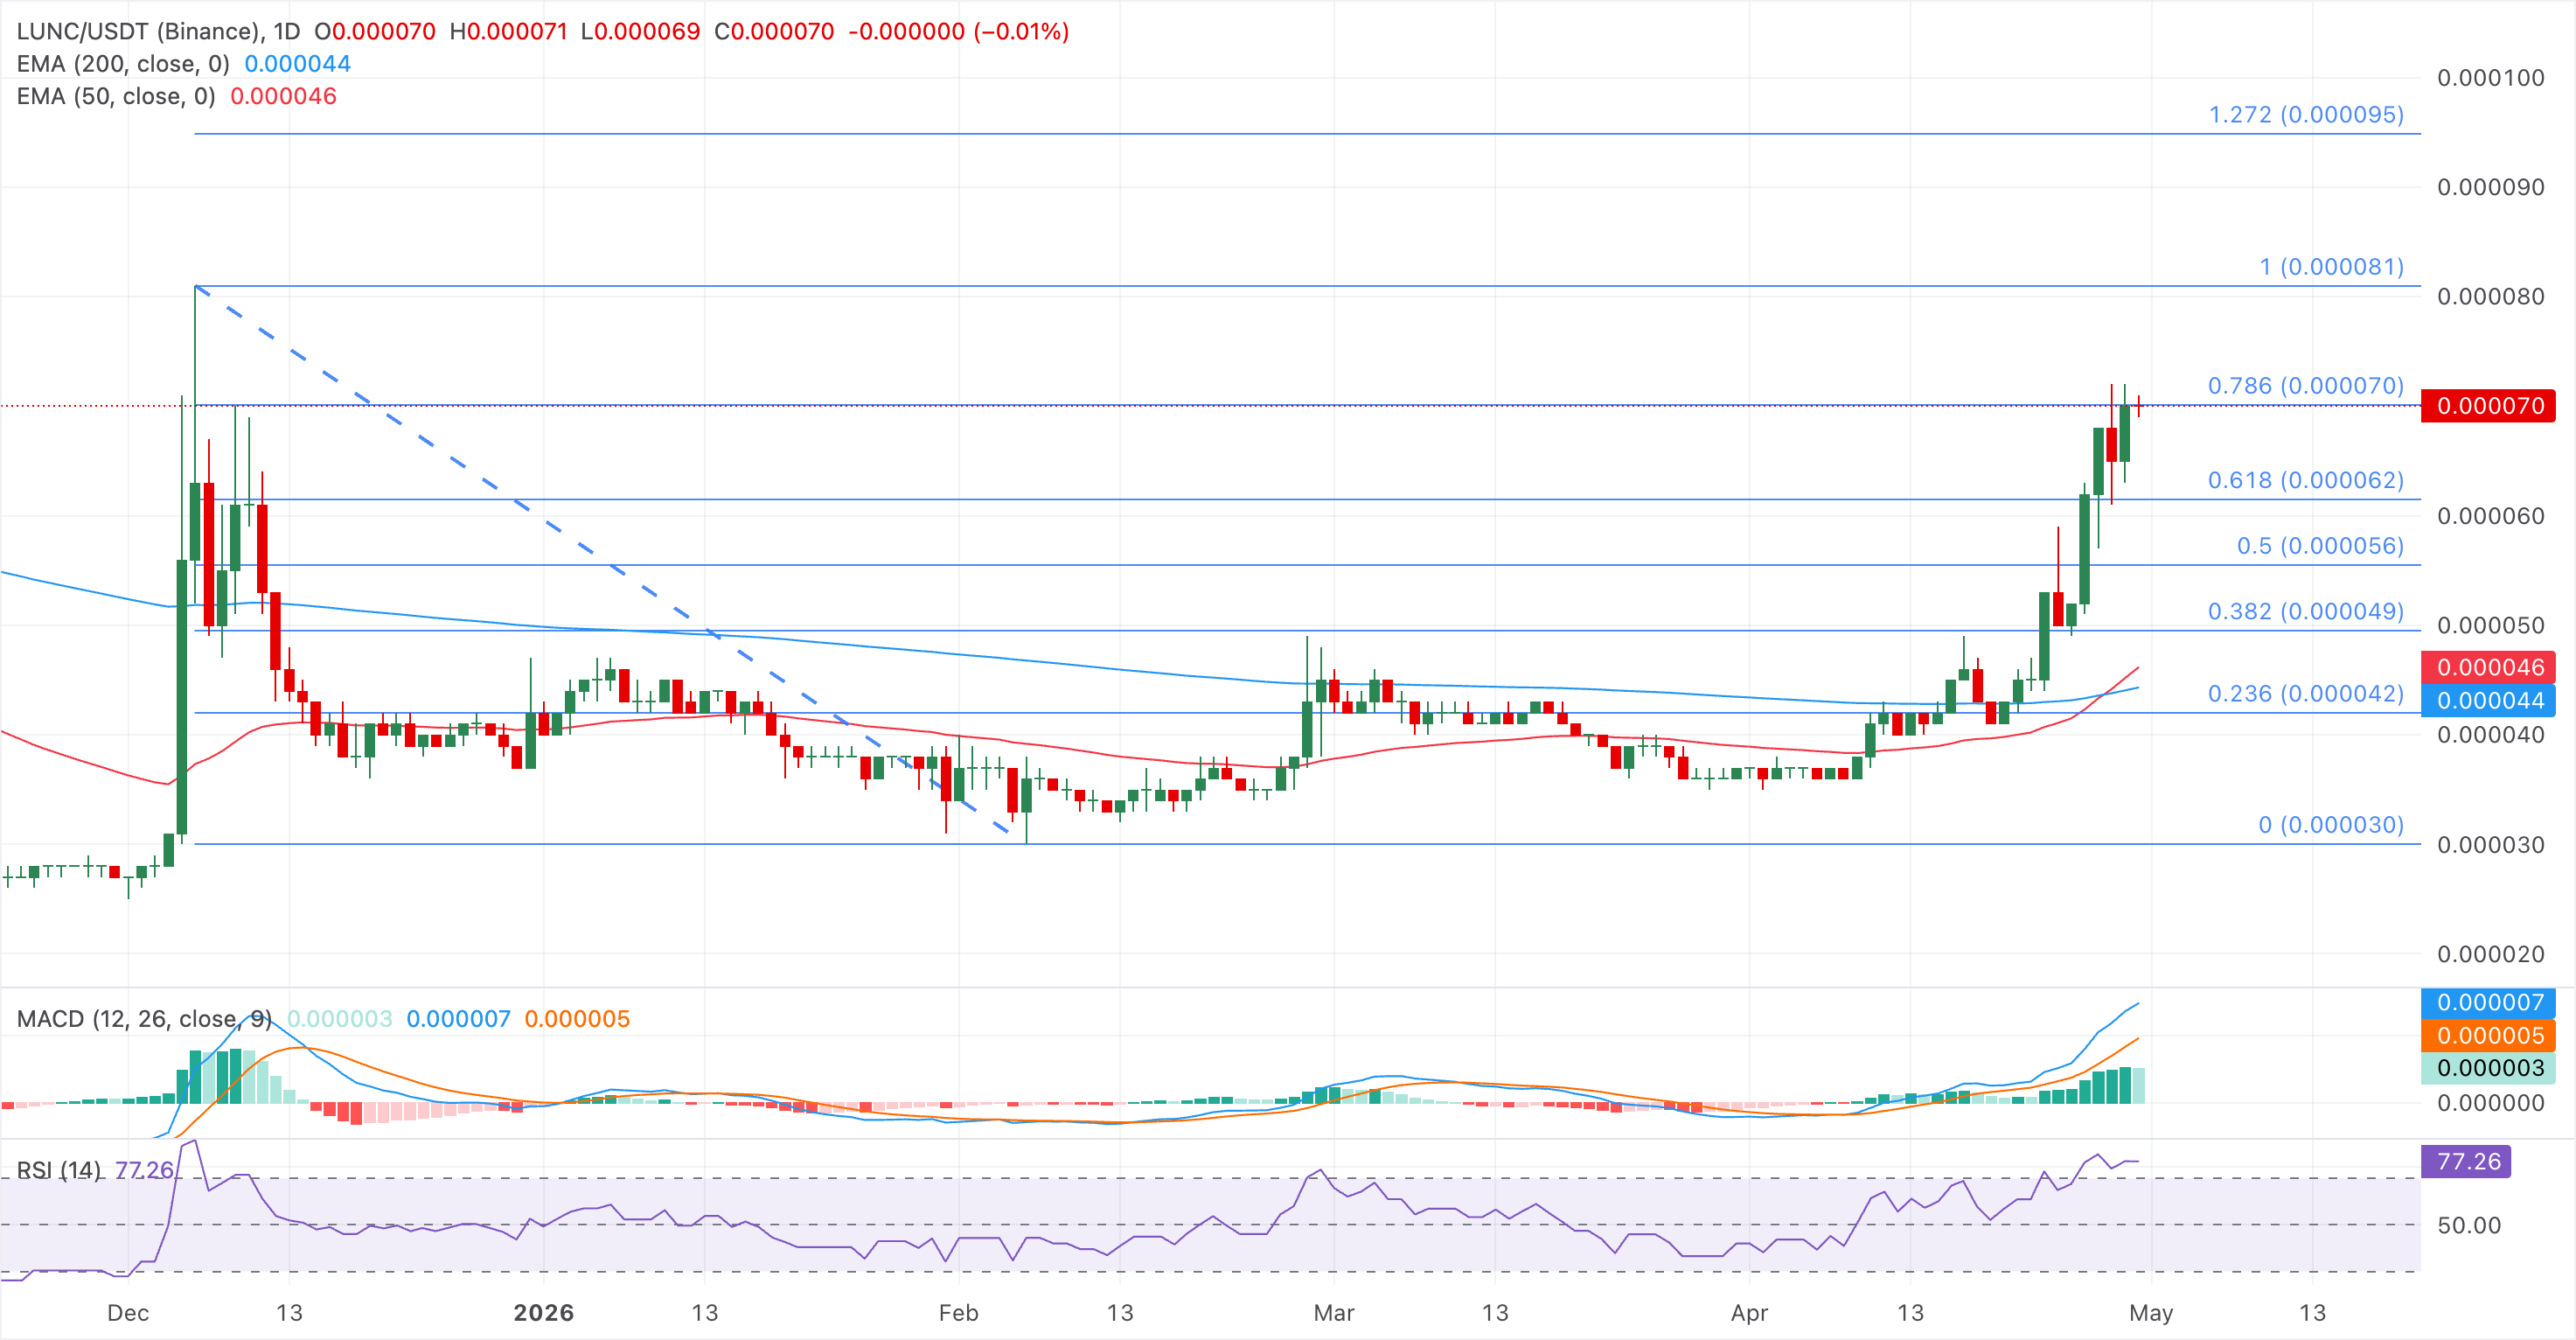
On the downside, the 61.8% and 50% Fibonacci retracement levels at $0.000062 and $0.000056, respectively, serve as support levels.
On the other hand, Dogecoin hovers above the $0.10 psychological level, maintaining a bullish near-term bias. The meme coin tests the ground above its 100-day EMA at $0.1049, tilting the 50-day EMA at $0.0970 upside.
Momentum stays constructive, with the MACD line in positive territory and the RSI at 71 hovering in the overbought territory, suggesting persistent upside pressure even as the rally becomes stretched.
On the topside, the 200-day EMA at around $0.1255 is the next significant resistance that bulls would need to clear to extend the advance.
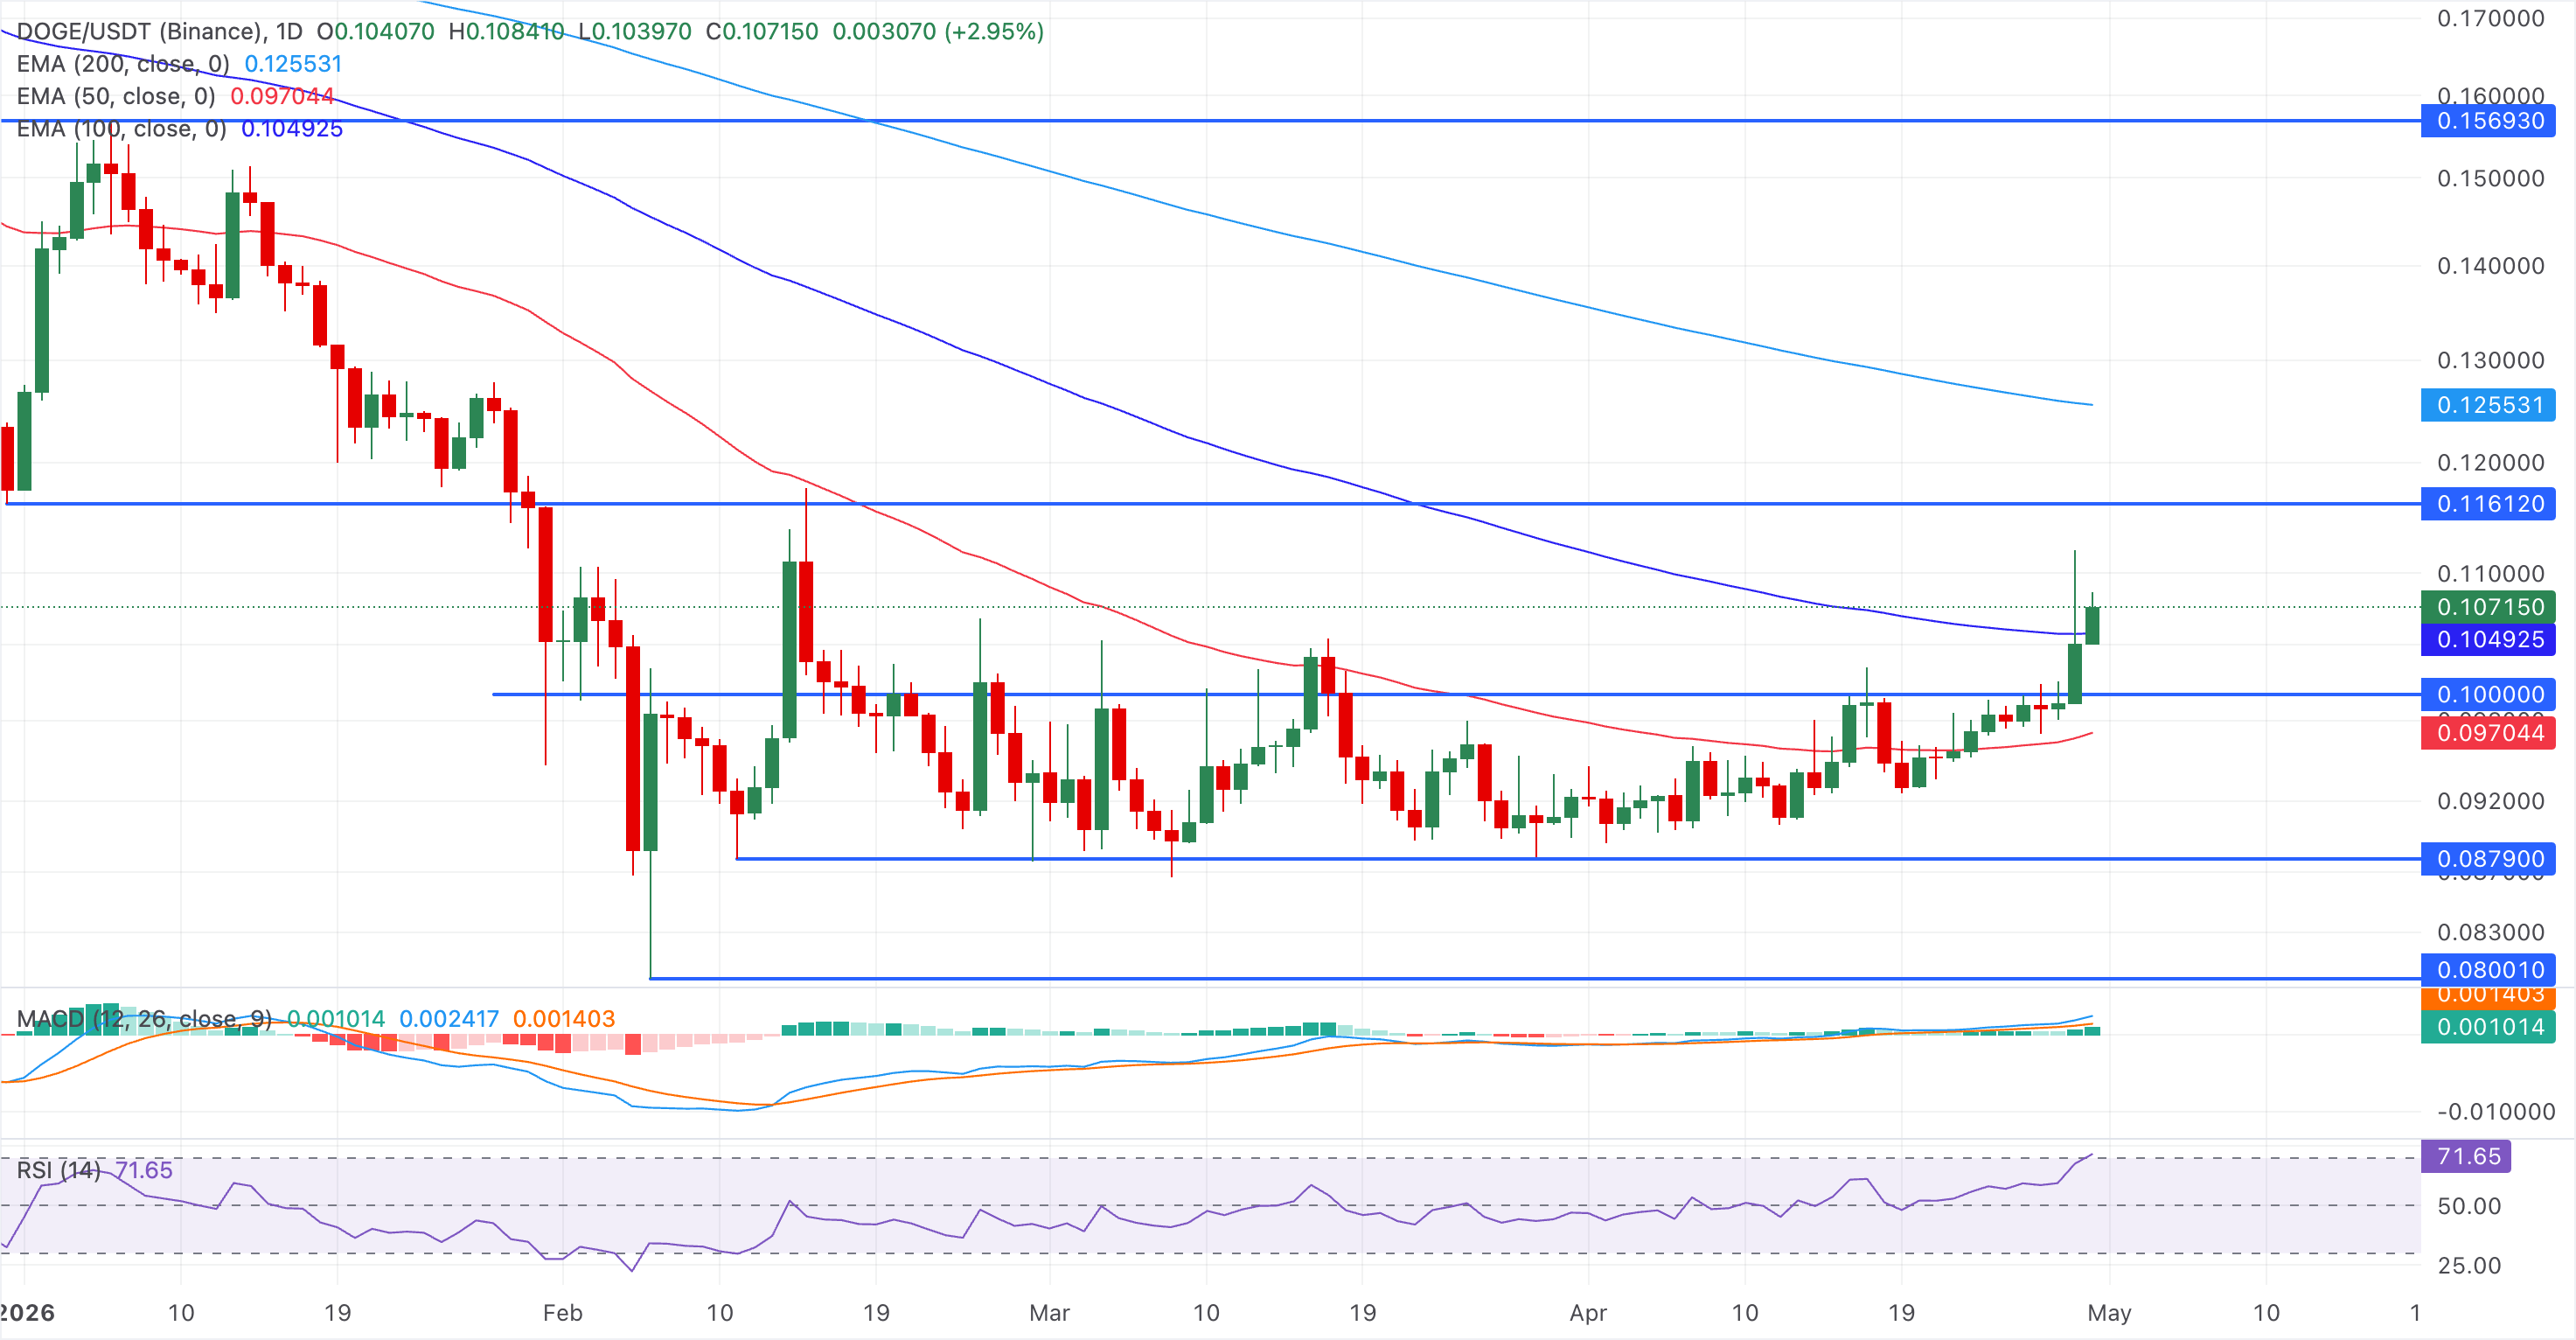
On the downside, initial support lies at the 100-day EMA near $0.1049, with a deeper cushion provided by the 50-day EMA near $0.0970, where a pullback could still leave the broader bullish structure intact while easing overbought conditions.
(The technical analysis of this story was written with the help of an AI tool.)

Plus d’un million d’utilisateurs se tournent vers FXStreet pour des données de marché en temps réel, des outils de graphiques, des analyses d’experts et des actualités Forex. Leur calendrier économique complet et leurs webinaires éducatifs aident les traders à rester informés et à prendre des décisions éclairées. FXStreet s’appuie sur une équipe d’environ 60 professionnels répartis entre le siège de Barcelone et diverses régions du monde.
Lire la suite


