
Crypto Overview: Markets hold as US-Iran mull truce draw out – Chiliz and Morpho extend gains
Par Vishal Dixit
Mis à jour: 16 Apr 2026


ARTICLES POPULAIRES

The broader cryptocurrency market holds steady with Bitcoin (BTC) and Ethereum (ETH) above $74,000 and $2,350, respectively, at press time on Thursday, while Ripple (XRP) holds at $1.40.
- Bitcoin holds above $74,000 so far on Thursday, while Ethereum and XRP trade around $2,350 and $1.40.
- Reports suggest the US and Iran are mulling an extension of the truce to facilitate negotiations.
- Chiliz and Morpho extend gains over the last 24 hours.
The broader cryptocurrency market holds steady with Bitcoin (BTC) and Ethereum (ETH) above $74,000 and $2,350, respectively, at press time on Thursday, while Ripple (XRP) holds at $1.40. Sentiment recovers amid a Bloomberg report suggesting that US and Iranian officials are considering extending the two-week truce for better negotiations. Meanwhile, Chiliz (CHZ) and Morpho (MORPHO) are extending gains over the last 24 hours.
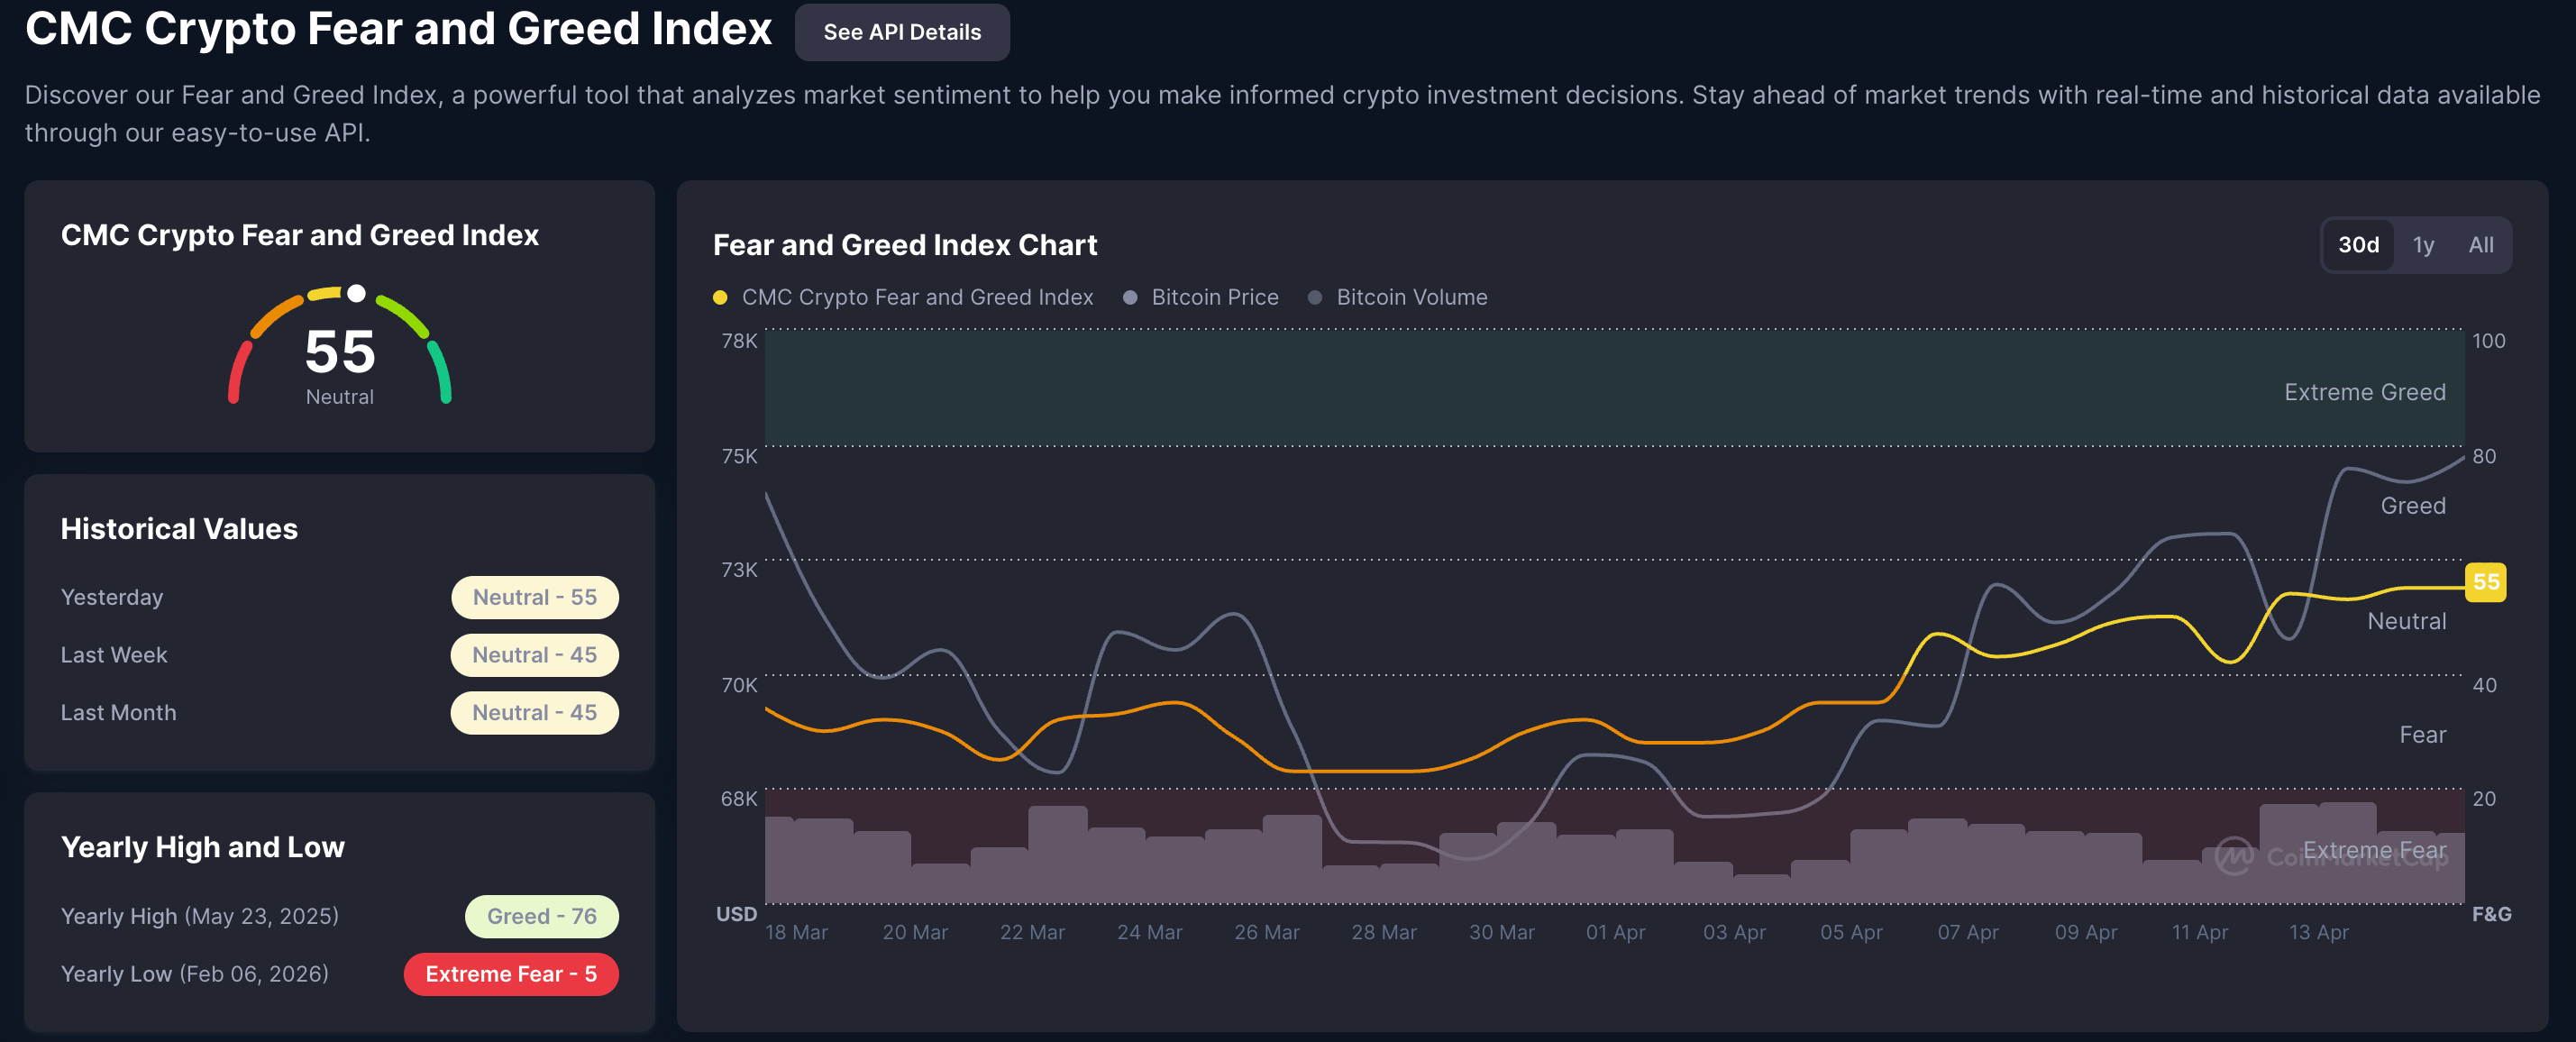
Crypto market sentiment holds steady
The risk-off sentiment across the cryptocurrency market is waning as the US-Iran truce talks continue. CoinMarketCap data shows the Fear and Greed Index is at 55 on Thursday, flashing a neutral stance and approaching 60, which would signal renewed greed among investors.
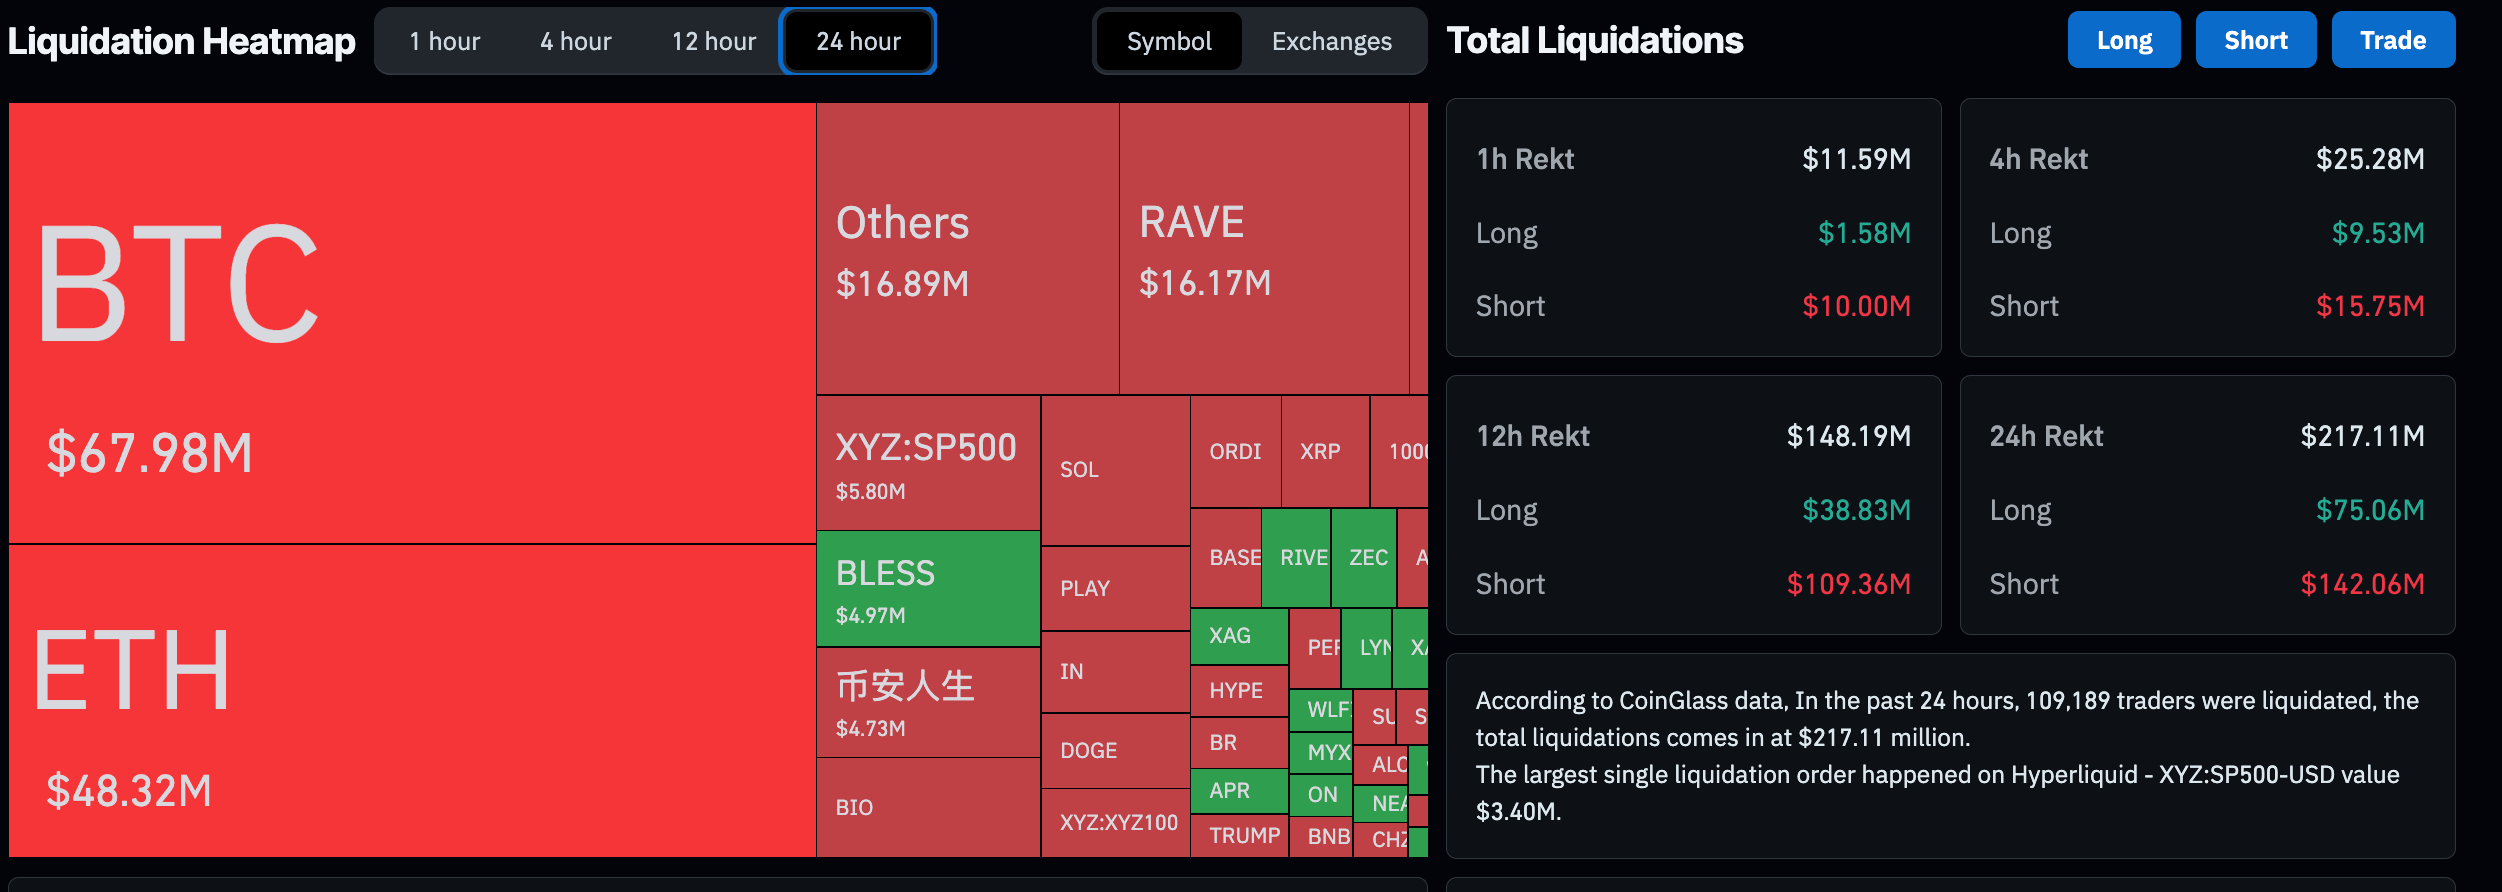
On the other hand, the leverage market shows $217 million in liquidations over the last 24 hours, led by $142 million in short liquidations, reflecting a largely bearish wipeout.
Technical outlook: Will Chiliz and Morpho hold momentum?
Chiliz holds a constructive bullish bias as price has reclaimed the 50-, 100-, and 200-day Exponential Moving Averages (EMAs) clustered just under $0.0390. This recovery above the EMA stack suggests underlying demand is rebuilding after the recent pullback.
The Relative Strength Index (RSI) at 59 remains in positive territory, yet it has not yet signaled overbought conditions. The Moving Average Convergence Divergence (MACD) has resurfaced above its signal line, hinting that upside momentum is re-emerging.
On the topside, initial resistance is located at the 50% retracement at $0.04462, and a daily close above it would open the way toward the 78.6% retracement at $0.05501.
On the downside, immediate support is provided by the 200-day EMA at $0.03932, and the nearby 100-day EMA at $0.03915.
Morpho trades above $1.8000 at press time on Thursday. The token holds comfortably above both the 50-day EMA and 100-day EMA at $1.6650 and $1.5653, respectively, keeping the near-term structure bullish as these averages now underpin the advance.
Momentum aligns with this constructive tone, with the Relative Strength Index hovering near 61 and Moving Average Convergence Divergence (MACD) in positive territory, hinting that buying pressure remains in control while price sustains above these trend supports.
The immediate resistance for MORPHO aligns with the R1 Pivot Point at $1.9393, guarding the upside to the R2 Pivot Point at $2.3396.
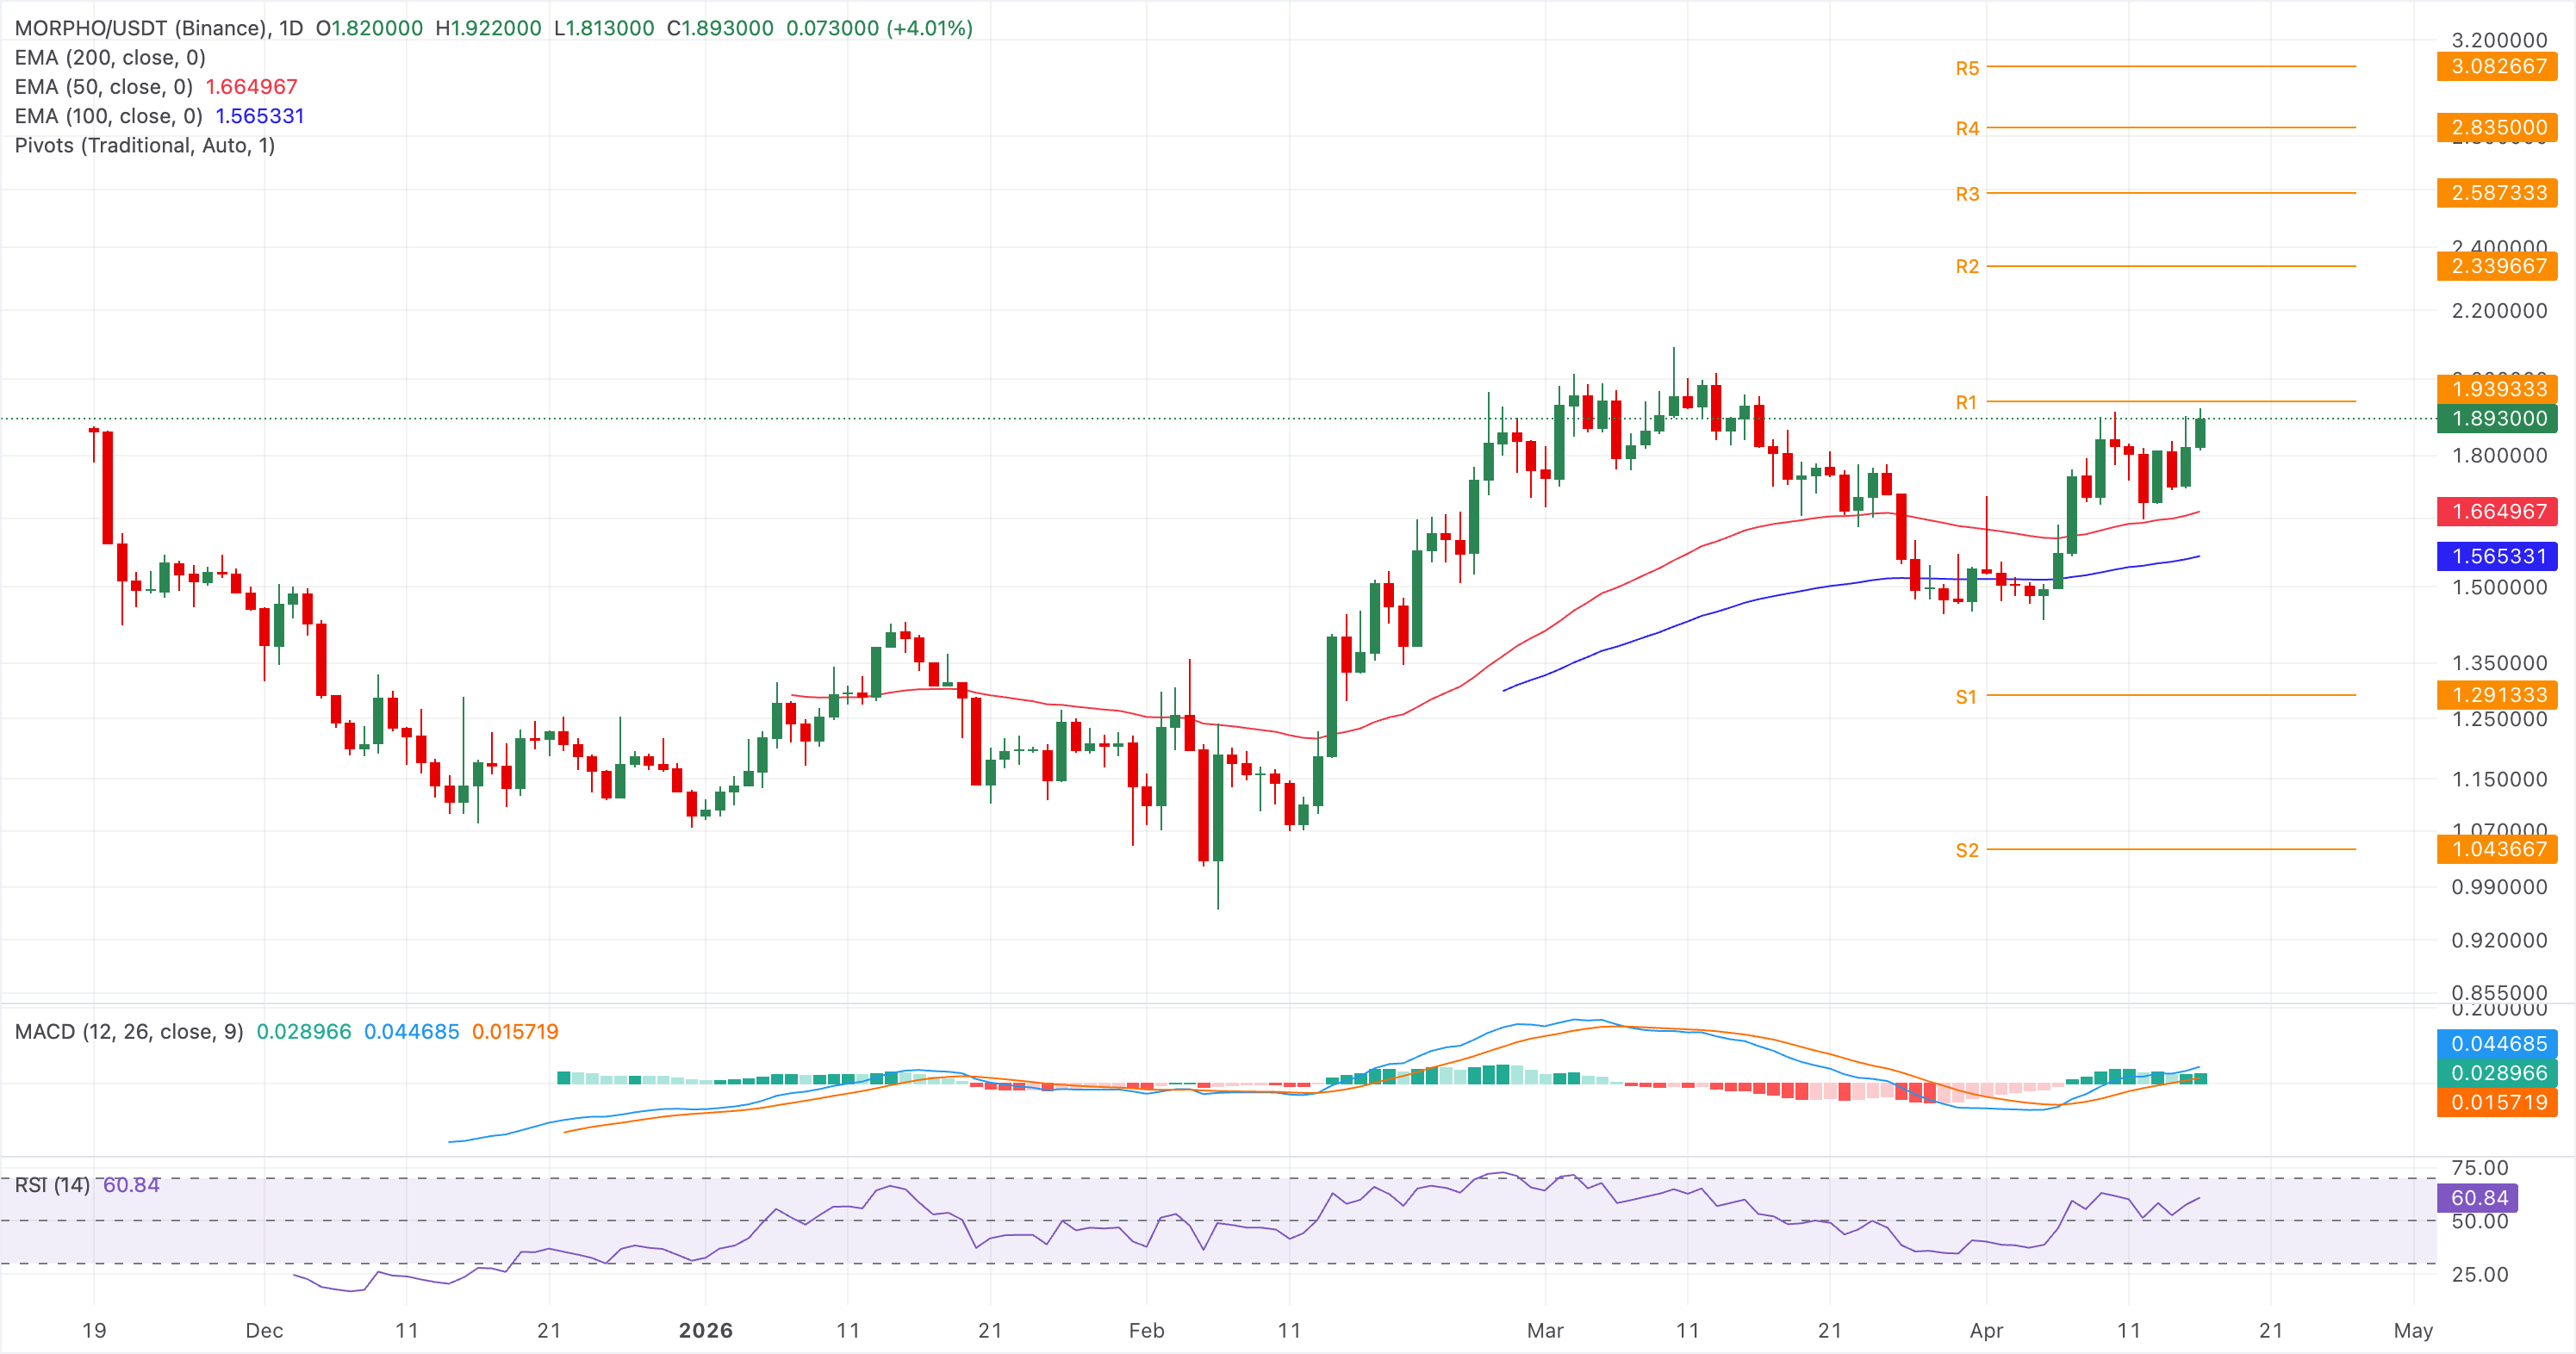
On the downside, initial technical support is located at the 50-day EMA around $1.6650, where a pullback could encounter early dip-buying interest. A deeper retracement would look to the 100-day EMA at $1.5653 as the next significant floor, whose loss would materially weaken the current bullish bias and expose the pair to a broader corrective phase.
(The technical analysis of this story was written with the help of an AI tool.)

Plus d’un million d’utilisateurs se tournent vers FXStreet pour des données de marché en temps réel, des outils de graphiques, des analyses d’experts et des actualités Forex. Leur calendrier économique complet et leurs webinaires éducatifs aident les traders à rester informés et à prendre des décisions éclairées. FXStreet s’appuie sur une équipe d’environ 60 professionnels répartis entre le siège de Barcelone et diverses régions du monde.
Lire la suite


