
Crypto Overview: Short squeeze crosses $300 million as Zcash and Toncoin lead altcoin rally
Par Vishal Dixit
Mis à jour: 6 May 2026


ARTICLES POPULAIRES

Bitcoin (BTC) extending gains above $81,000 at press time on Wednesday fuels a broader market recovery. Bullish sentiment is gaining strength as the excessive short-side liquidations cross $300 million over the last 24 hours.
- Bitcoin hovers above $81,000 on Wednesday, fueling a broader market recovery.
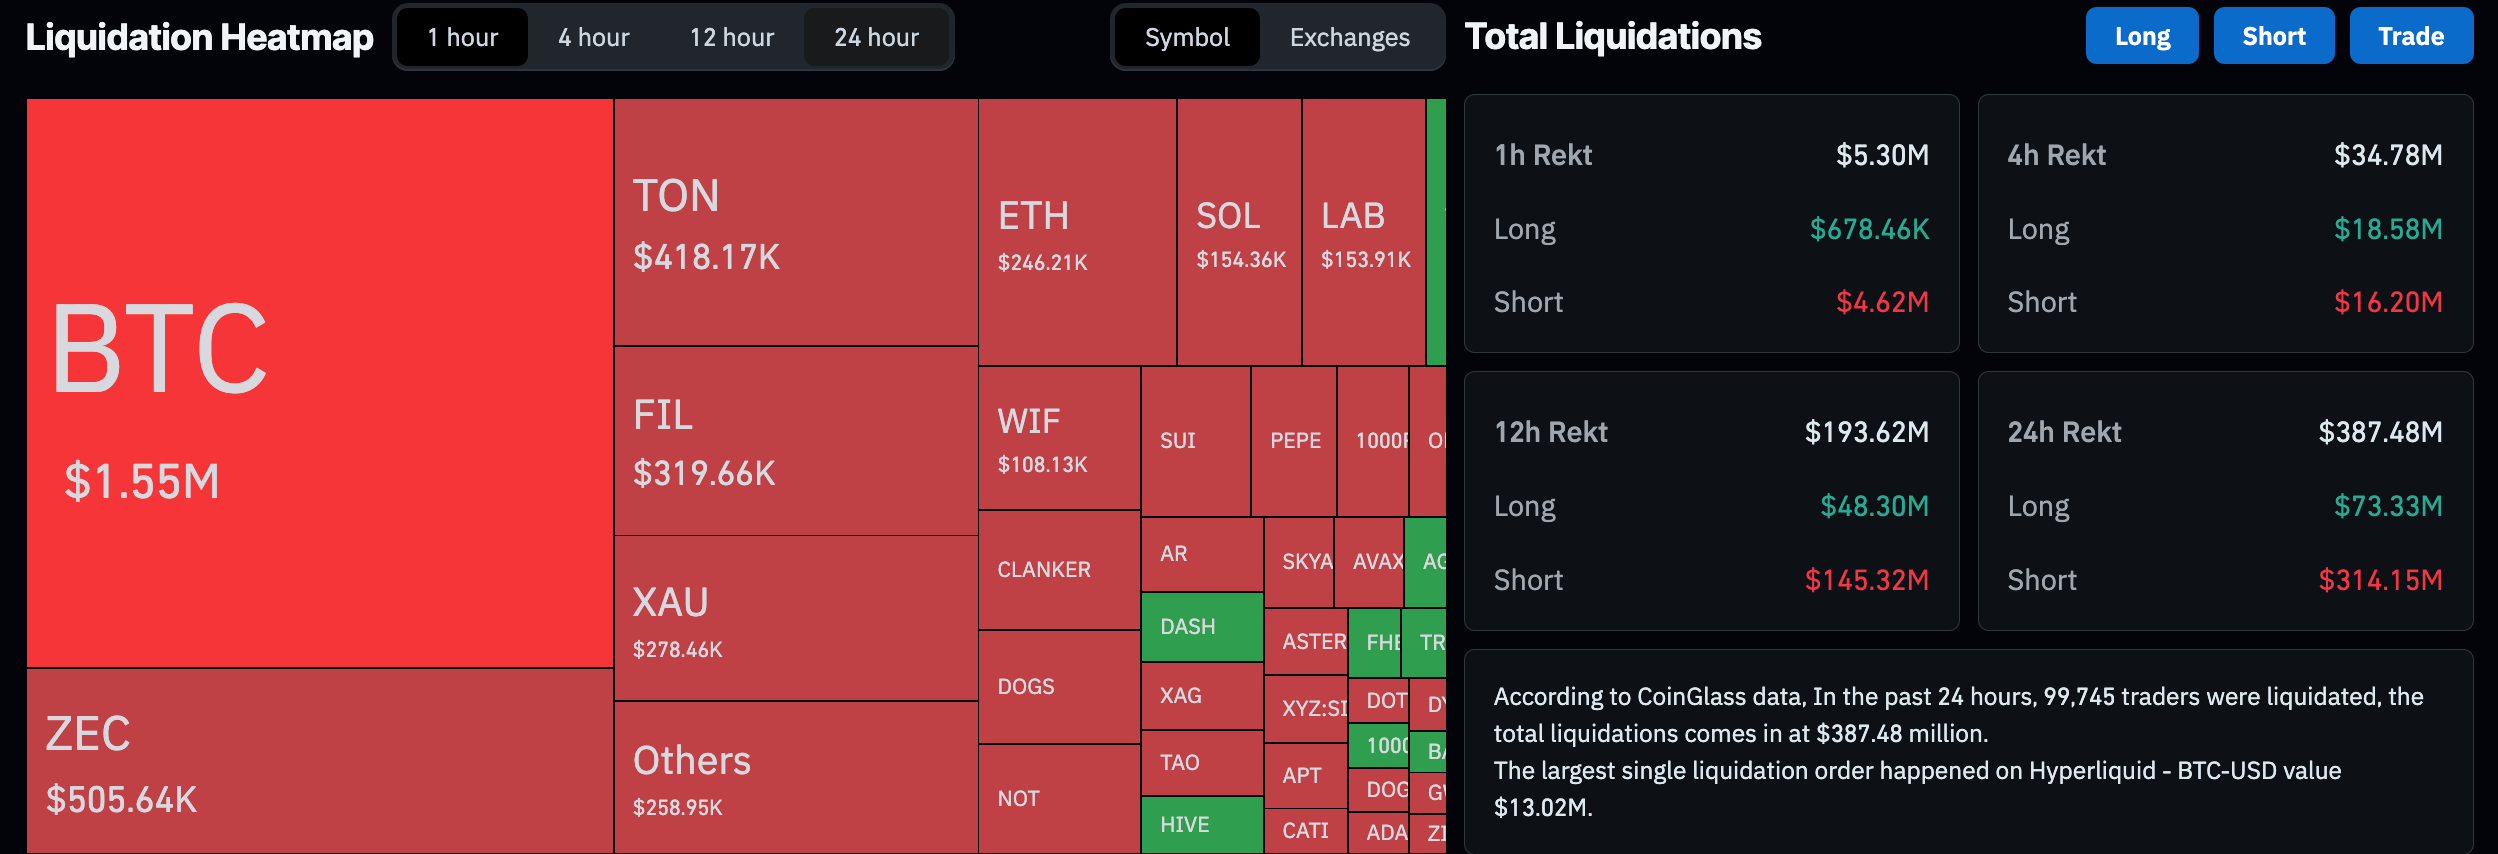
- Total liquidations cross $350 million in 24 hours, driven by a short squeeze.
- Zcash, Toncoin, and Terra Classic lead gains over the last 24 hours, outperforming other cryptocurrencies.
Bitcoin (BTC) extending gains above $81,000 at press time on Wednesday fuels a broader market recovery. Bullish sentiment is gaining strength as the excessive short-side liquidations cross $300 million over the last 24 hours.
Outperforming the broader market, Zcash (ZEC), Toncoin (TON) and Terra Classic (LUNC) post double-digit gains over the last 24 hours.
Risk appetite grows amid broader market short squeeze
Bitcoin’s steady recovery amid the US-Iran tensions fuels recovery across altcoins. Crypto Fear and Greed Index rises to 50 on Wednesday as risk-off sentiment wanes.
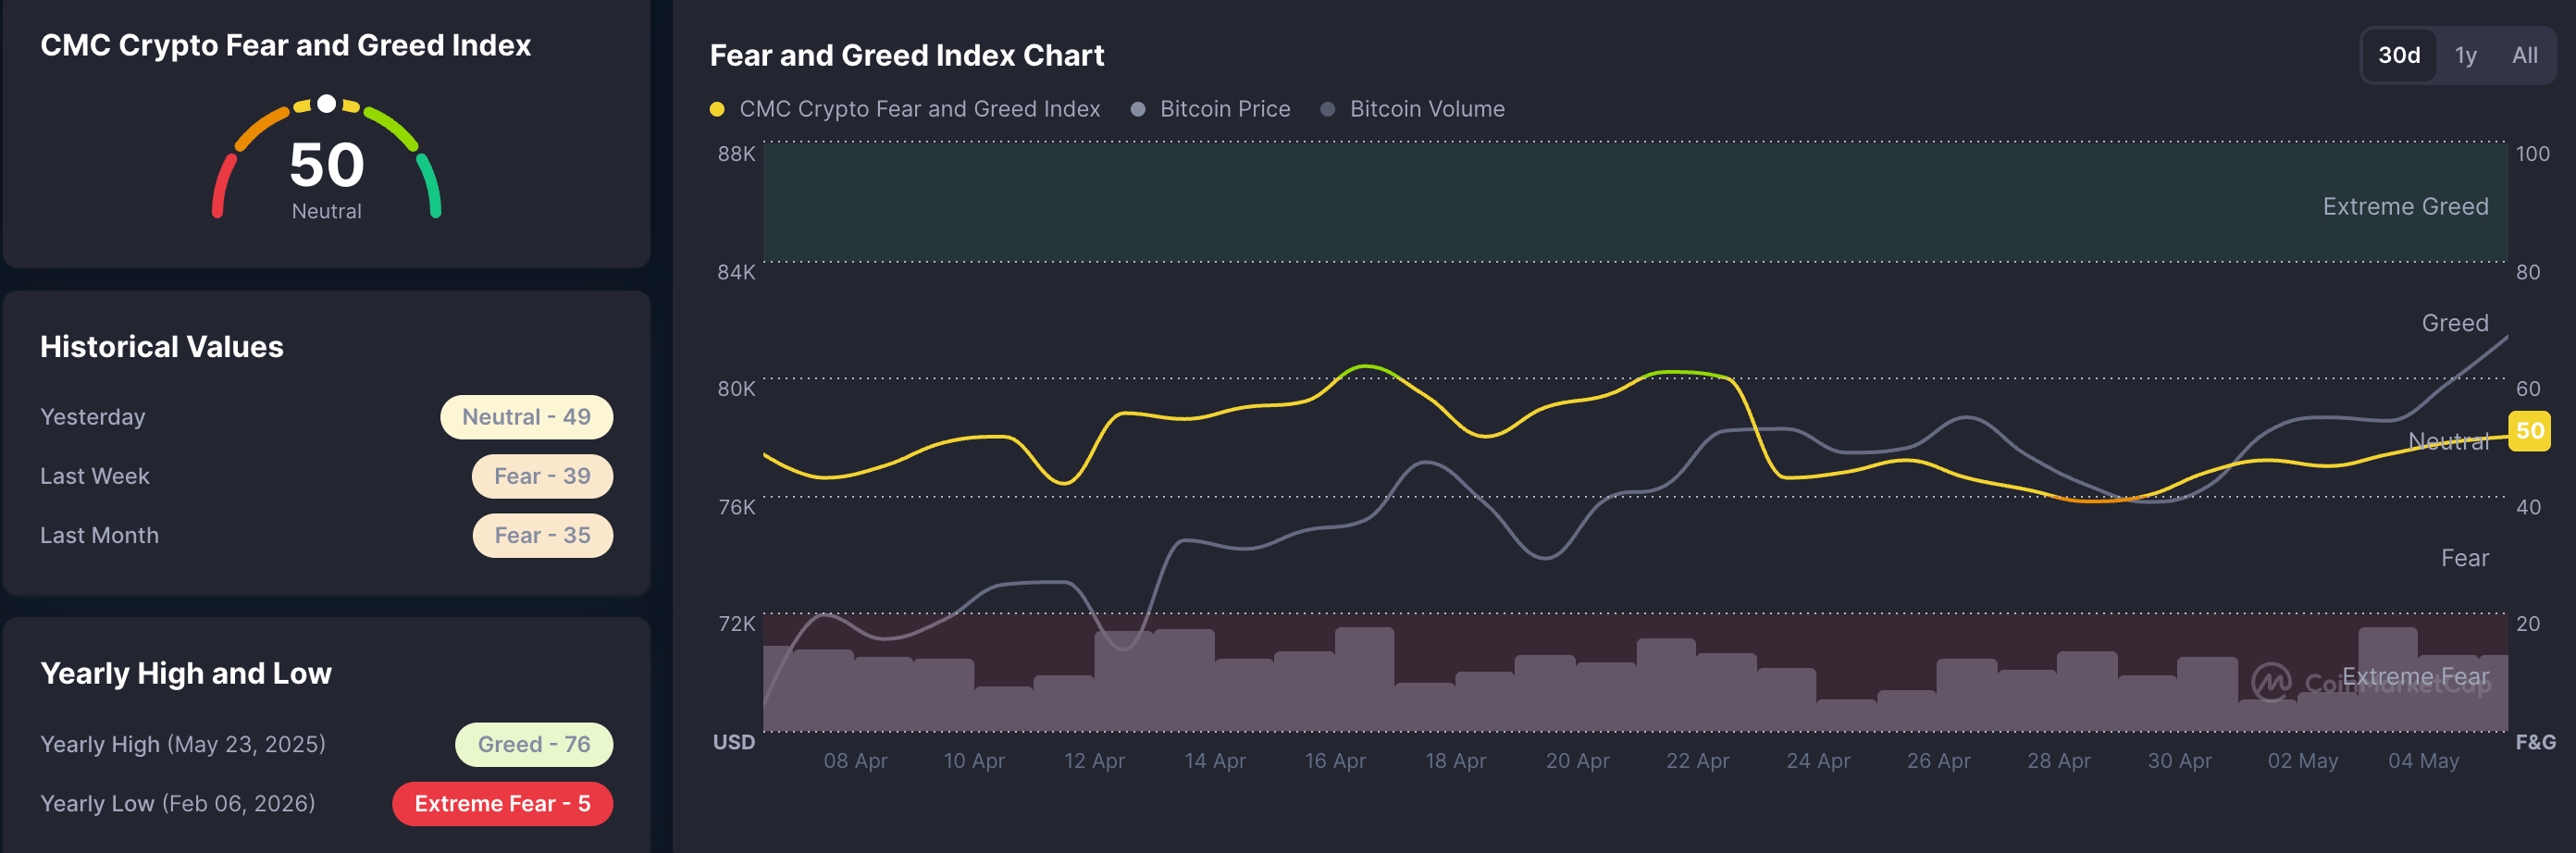
Meanwhile, the derivatives market witnesses a bullish shift driven by forced liquidations of short positions. CoinGlass data shows $387 million in total liquidations over the last 24 hours led by $314 million in short liquidations, suggesting a bearish side wipeout and a buy-side dominance.
Zcash, Toncoin and Terra Classic lead the altcoin rally
Zcash trades above $500 at press time on Wednesday, maintaining a steady recovery trend. The privacy coin extends a steep advance and sits well above both the 50-day Exponential Moving Average (EMA) at $335.61 and the 200-day EMA at $296.30, keeping the broader structure firmly bullish.
Strong upside momentum underpins the move, with the Relative Strength Index (RSI) deep in overbought territory near 83 and the Moving Average Convergence Divergence (MACD) holding firmly in positive territory, which together suggest persistent buying pressure despite stretched conditions.
Looking up, the $560 resistance level caps the short-term recovery guarding the upside to its all-time high of $750.
On the downside, immediate pivot support is located around the $500 psychological mark, followed by the 50-day EMA near $336 and then the 200-day EMA around $296, which together define a broad demand band in case of a corrective pullback.
Toncoin trades above $2.00 at the time of writing on Wednesday, extending a strong bullish phase after decisively reclaiming its key medium- and long-term averages.
The pair now holds well above the 50-day EMA at $1.3927 and the 200-day EMA at $1.6876, suggesting a solidly supported uptrend structure. The prior downward resistance trend line, broken near $1.3884, has been left well behind, reinforcing the transition from a capped market to a trending one.
Momentum is overheated, with the RSI near 87 and MACD firmly positive, hinting that while upside pressure remains strong, the risk of a cooling phase is rising.
A decisive close above the $2.00 mark could extend the rally toward $2.3760, which could cap the upside toward $2.8990.
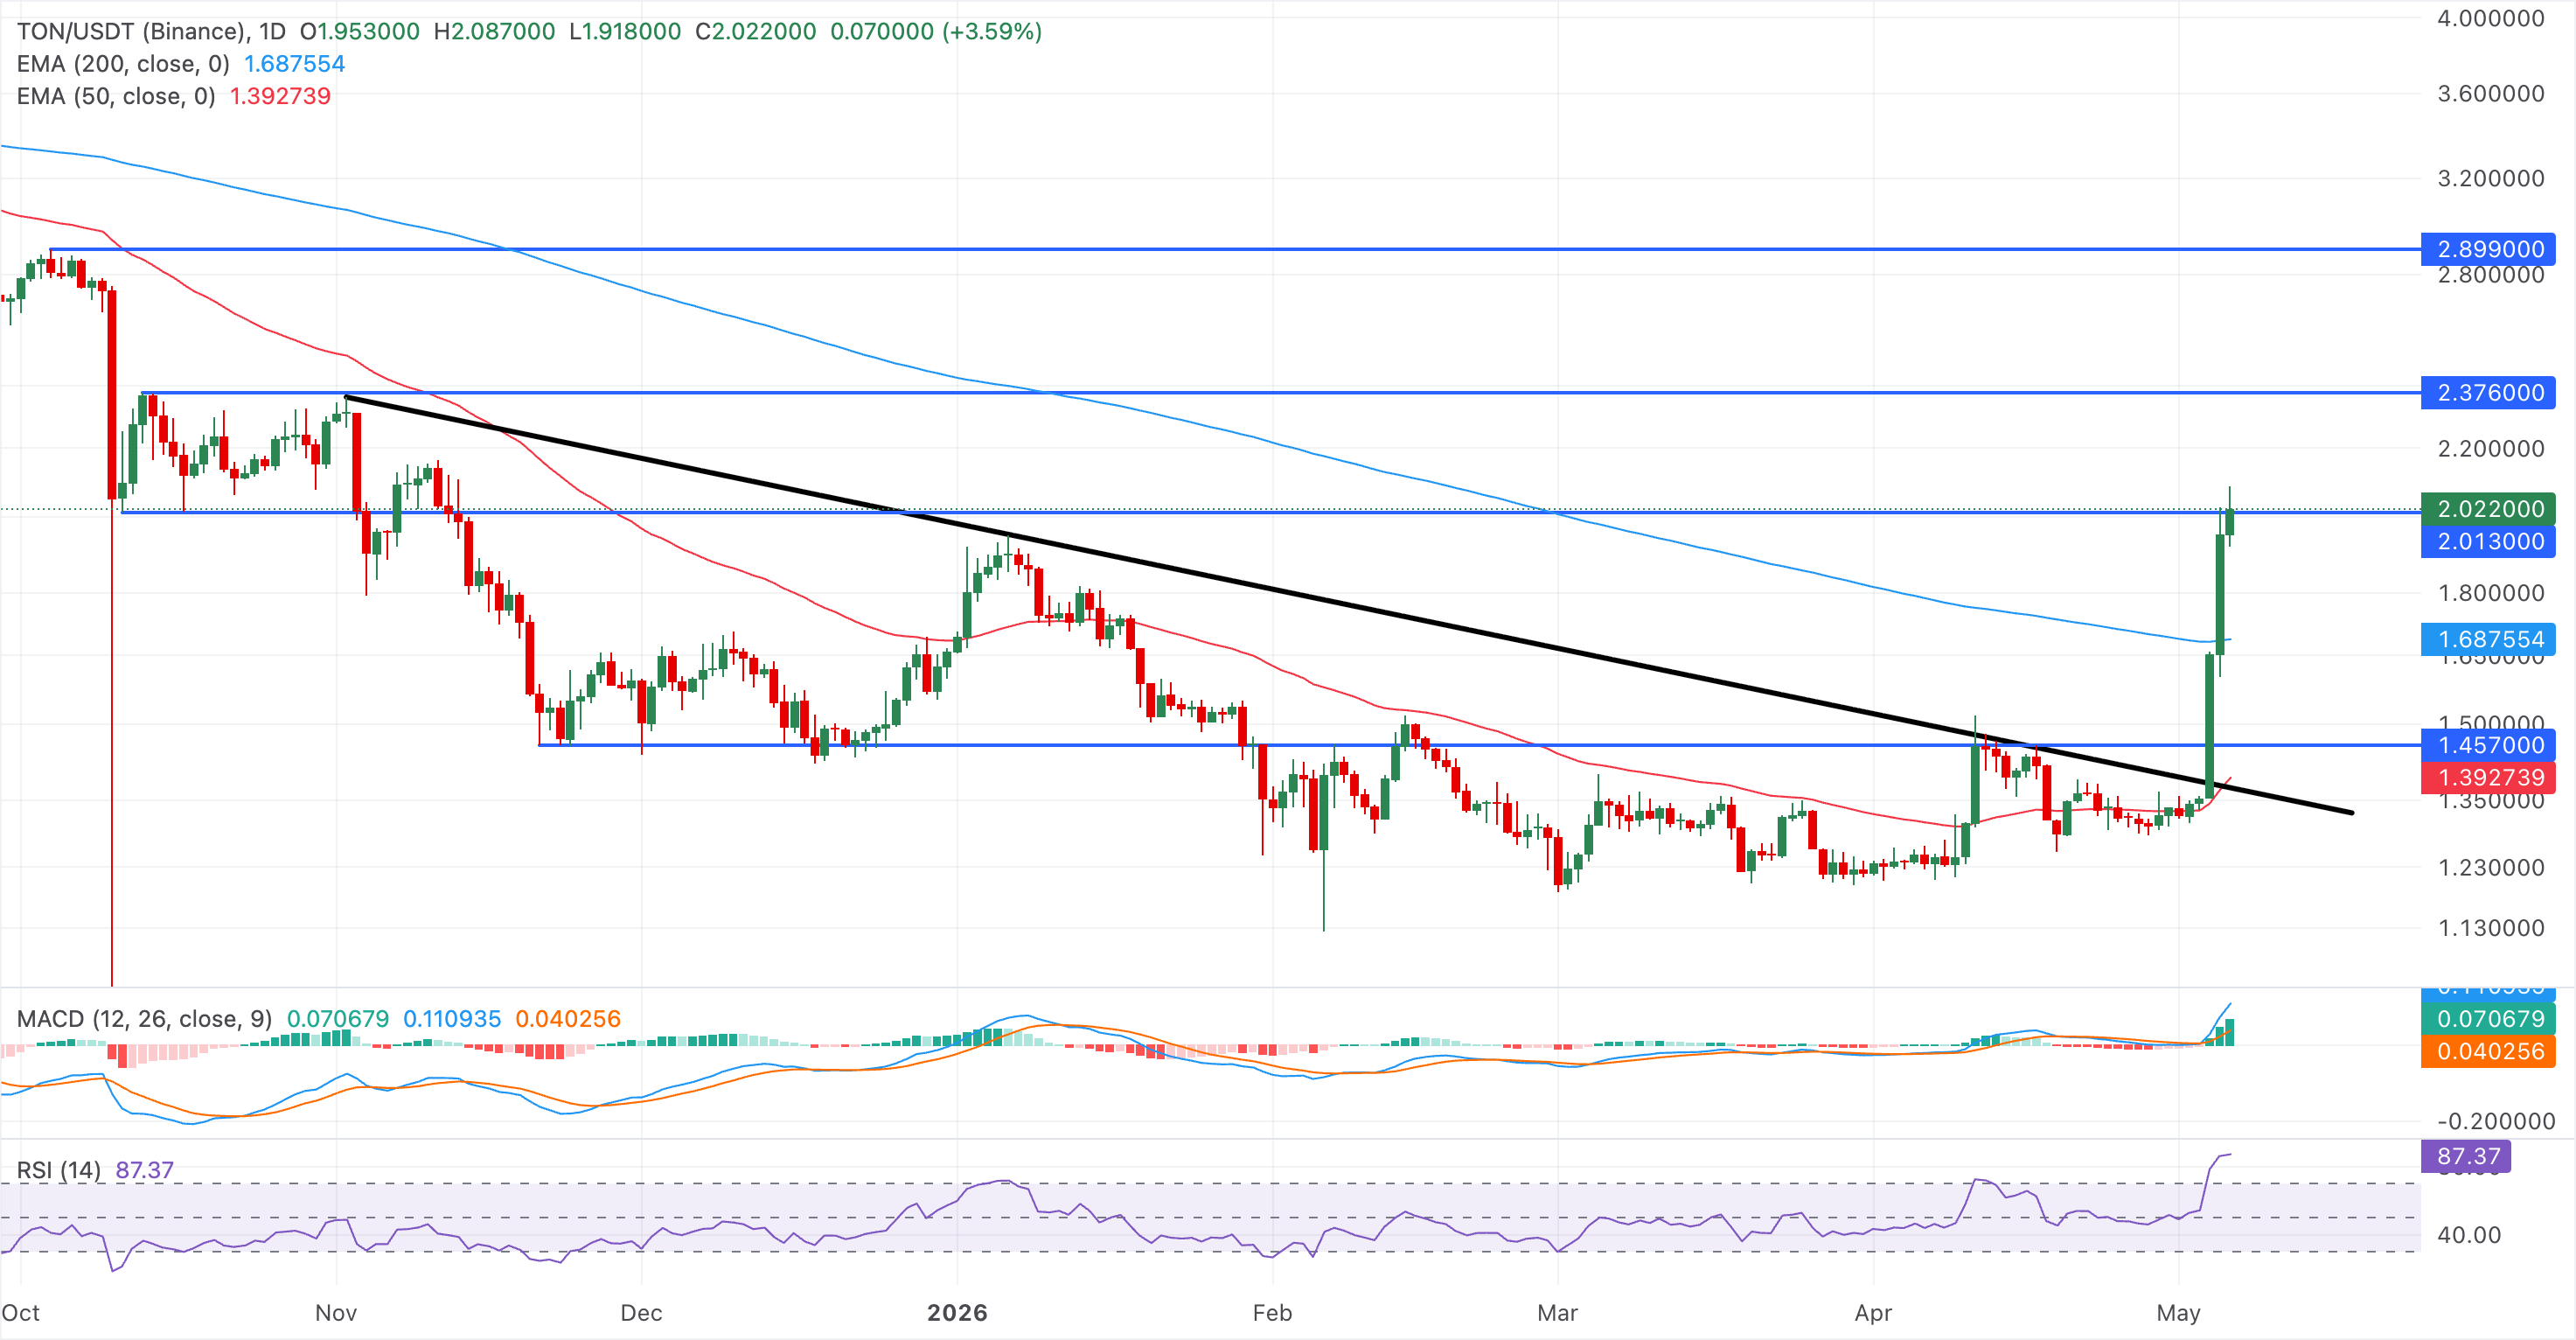
Initial support is now seen at the 200-day EMA around $1.6876, where a pullback could test the durability of the newly established uptrend.
(The technical analysis of this story was written with the help of an AI tool.)

Plus d’un million d’utilisateurs se tournent vers FXStreet pour des données de marché en temps réel, des outils de graphiques, des analyses d’experts et des actualités Forex. Leur calendrier économique complet et leurs webinaires éducatifs aident les traders à rester informés et à prendre des décisions éclairées. FXStreet s’appuie sur une équipe d’environ 60 professionnels répartis entre le siège de Barcelone et diverses régions du monde.
Lire la suite


