
Crypto Today: Bitcoin, Ethereum, XRP test rebound strength amid ETF outflows, waning sentiment
Par John Isige
Mis à jour: 13 May 2026


ARTICLES POPULAIRES
Cryptocurrency prices are showing signs of recovery on Wednesday, following volatility that accompanied the release of the United States (US) Consumer Price Index (CPI) data the previous day.
- Bitcoin rebounds above the critical $80,000 support despite persistent ETF outflows and softening market sentiment.
- Ethereum is showing renewed strength above $2,300, bolstered by support from the 50-day EMA.
- XRP is poised for a breakout above $1.50, supported by bullish technical indicators, with the MACD maintaining a buy signal.
Cryptocurrency prices are showing signs of recovery on Wednesday, following volatility that accompanied the release of the United States (US) Consumer Price Index (CPI) data the previous day. Despite headline CPI inflation increasing 3.8% annually in April, from 3.3% in March, boosting the US Dollar (USD). Bitcoin (BTC) is trading near $81,000 at the time of writing.
The CPI increase beat market expectations of 3.7%. On a monthly basis, it rose by 0.6% after a 0.9% increase in March, matching analysts' forecast. The core CPI, which excludes volatile food and energy prices, rose 0.4% on a monthly basis and 2.8% on an annual basis, higher than expected and the previous month's readings.
Altcoins, including Ethereum (ETH) and Ripple (XRP), are grinding higher alongside Bitcoin, with ETH holding above $2,300 and XRP sitting on short-term support at $1.45.
Crypto market sentiment softens amid capital outflows
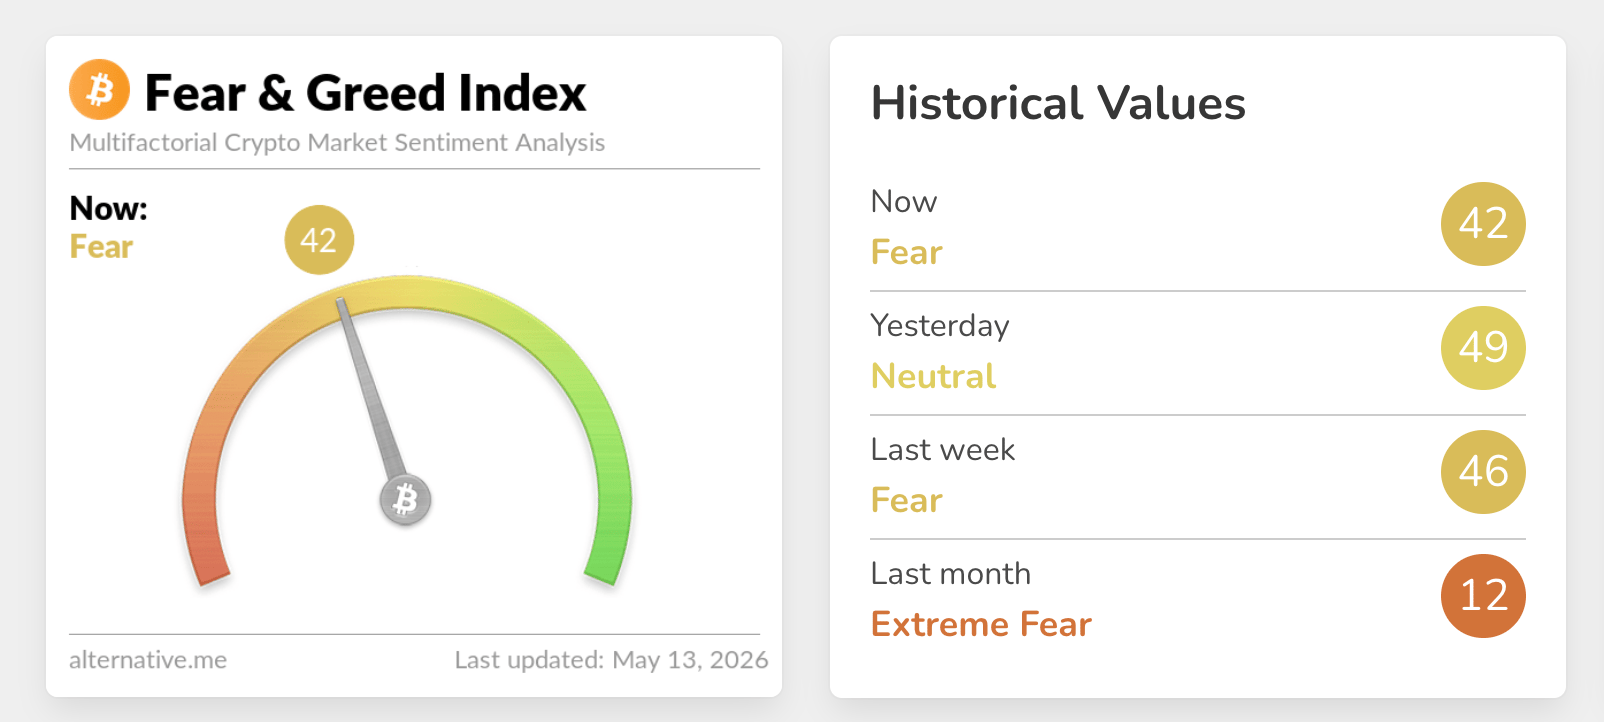
Sentiment in the broader crypto market is fading, as reflected by the Fear & Greed Index declining to 42 on Wednesday in the fear territory, from 49 in the neutral region the previous day.
Bitcoin spot Exchange-Traded Funds (ETFs) saw outflows totaling $233 million on Tuesday, in line with the softening risk appetite. Cumulative inflows remain relatively steady at $59.13 billion, while assets under management average $107.31 billion despite outflows.

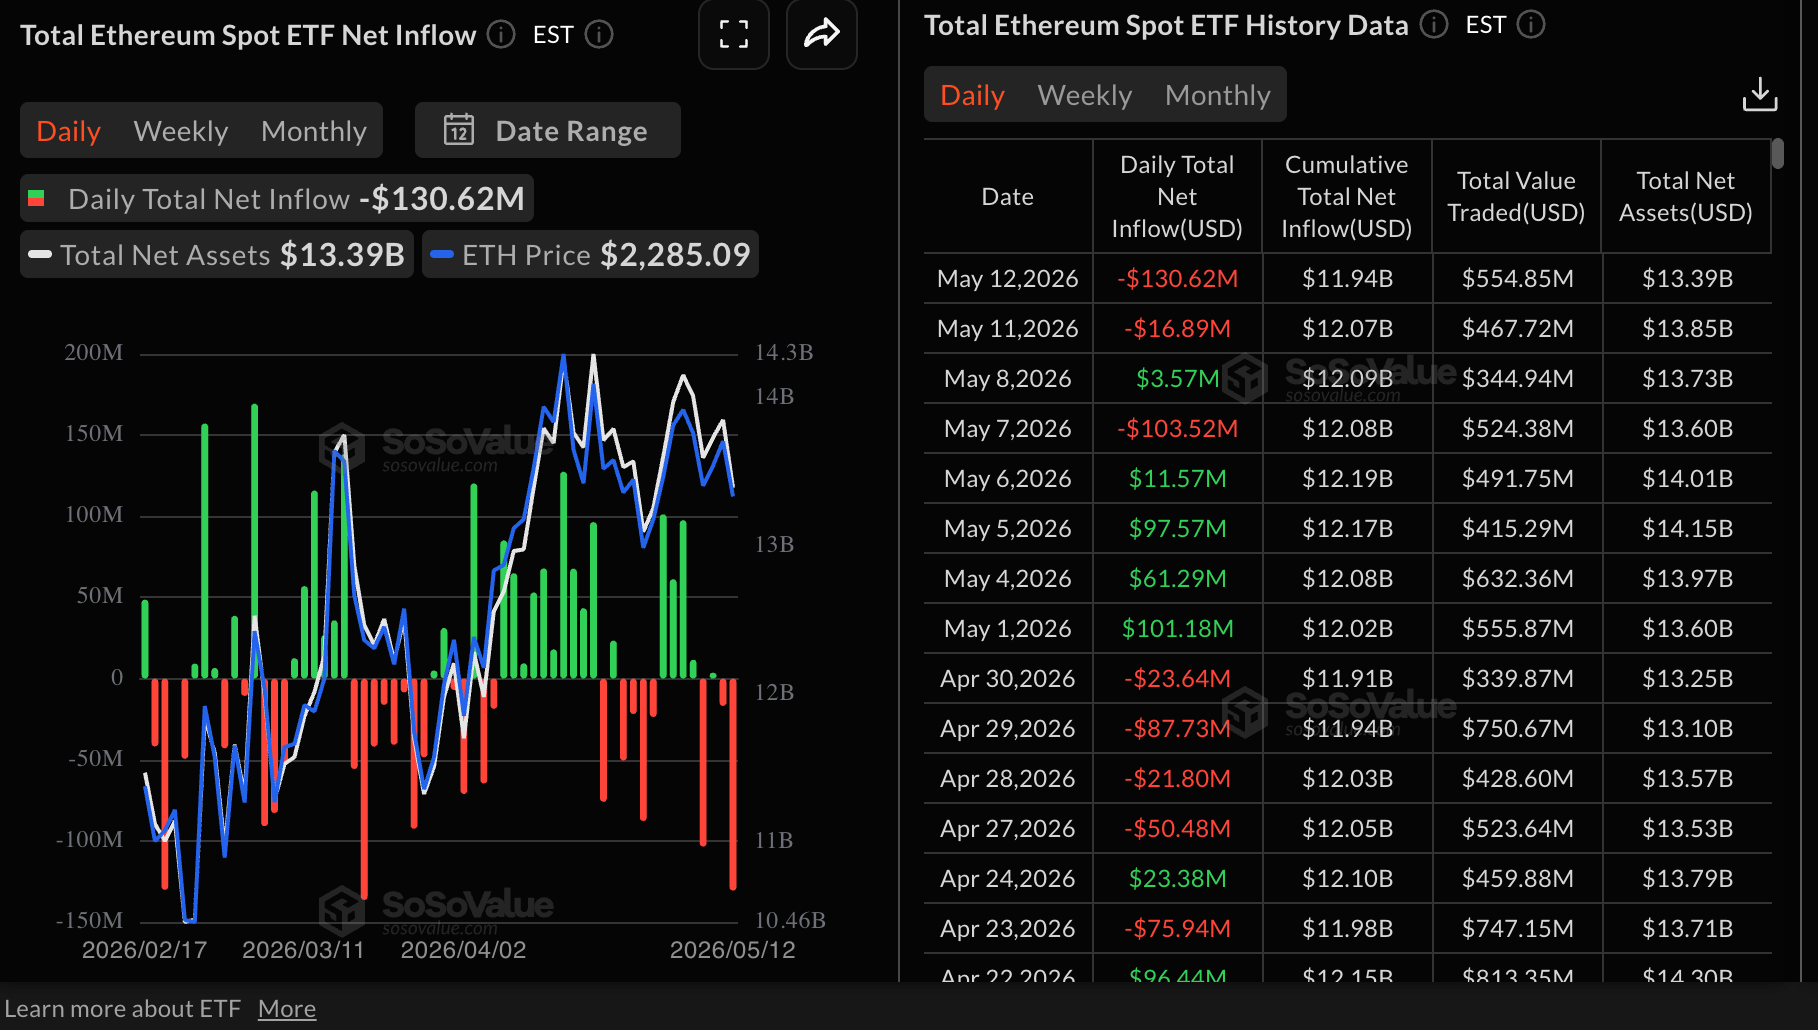
Ethereum spot ETFs have posted two consecutive days of outflows, totaling $131 million on Tuesday and $17 million on Monday, according to SoSoValue data. This shows that weakening sentiment is weighing on investors, who remain cautiously optimistic. Meanwhile, cumulative inflows now stand at $11.94 billion, with net assets at $13.39 billion.
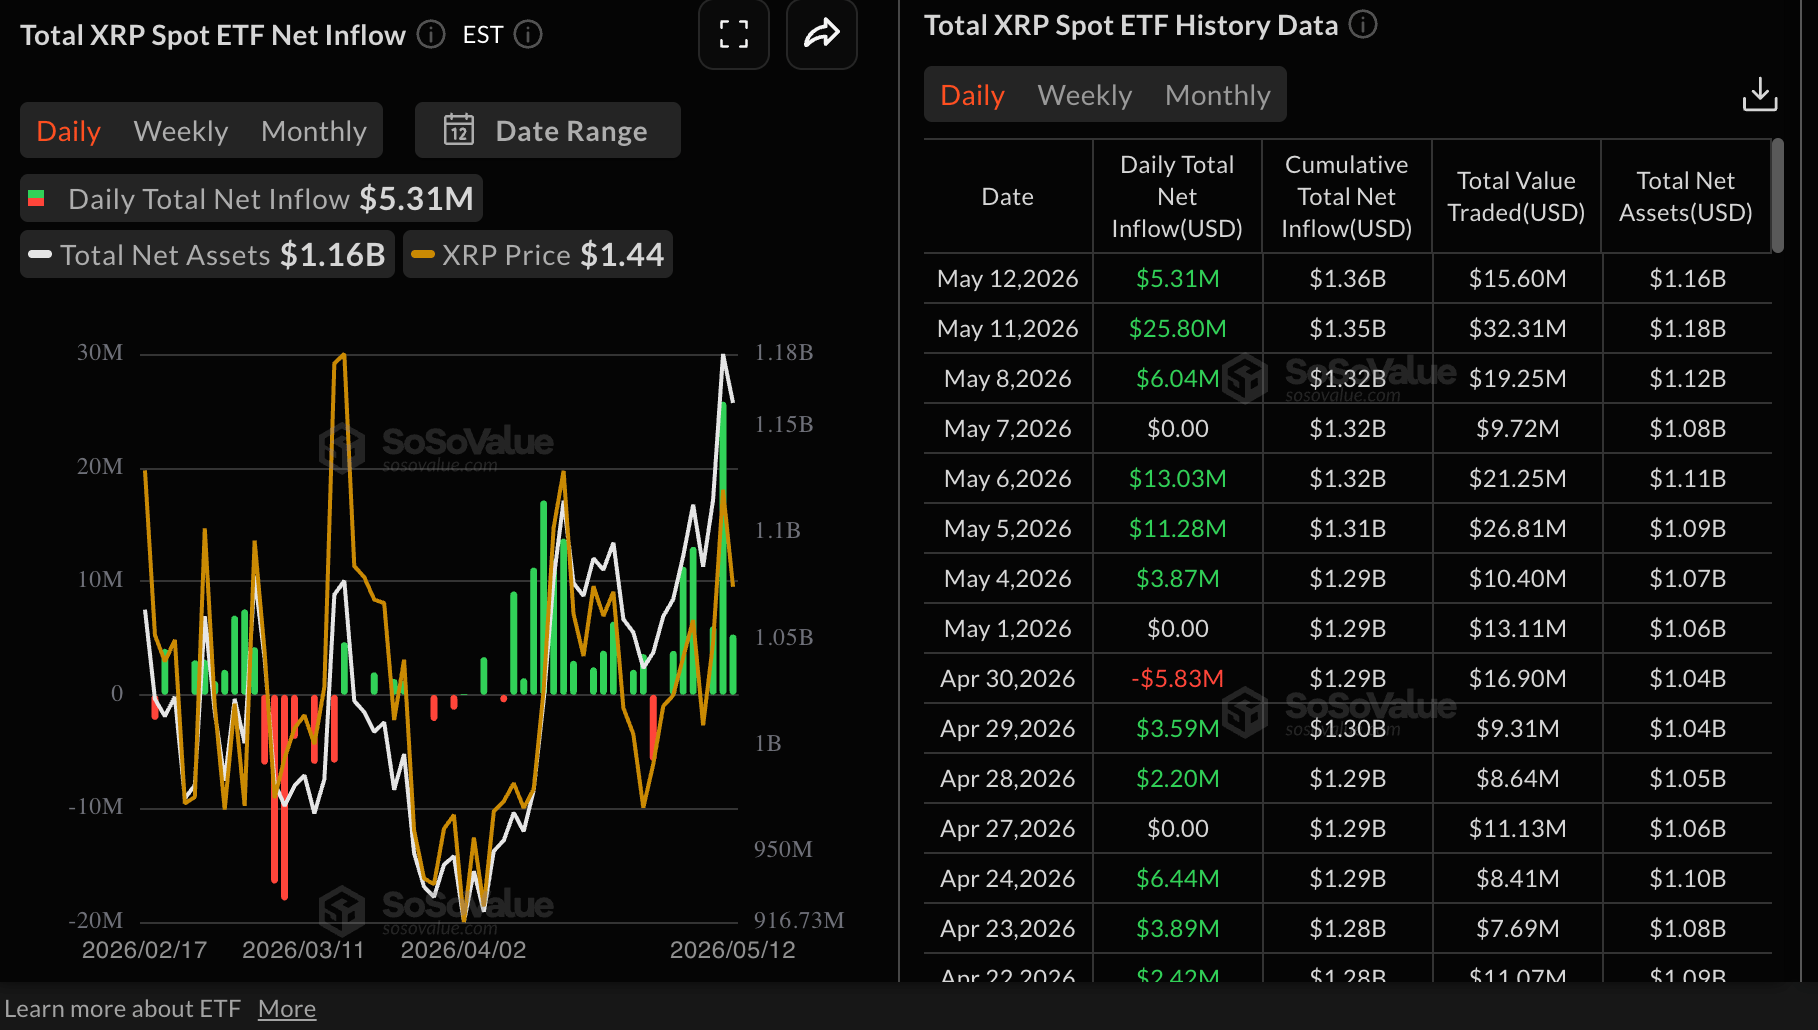
Turning to XRP, US-listed spot ETFs beat broader market odds to post mild inflows of roughly $5 million on Tuesday, a significant drop from Monday’s nearly $26 million. Cumulative inflows average $1.36 billion, rising from the previous day’s $1.35 billion. Net assets under management are currently at $1.16 billion.
Technical outlook: Bitcoin bulls return as momentum builds
Bitcoin trades at $81,064, holding a neutral-to-bullish tone as it consolidates above its short- and medium-term Exponential Moving Averages (EMAs). The Crypto King remains supported by the 50-day EMA near $76,417 and the 100-day EMA around $76,755, while the SuperTrend line at roughly $75,598 underpins the broader uptrend structure.
Momentum is mixed, with the Relative Strength Index (RSI) hovering just above 60 on the daily chart, hinting at sustained underlying demand, even as the Moving Average Convergence Divergence (MACD) histogram slides slightly into negative territory, suggesting waning upside conviction in the very near term.
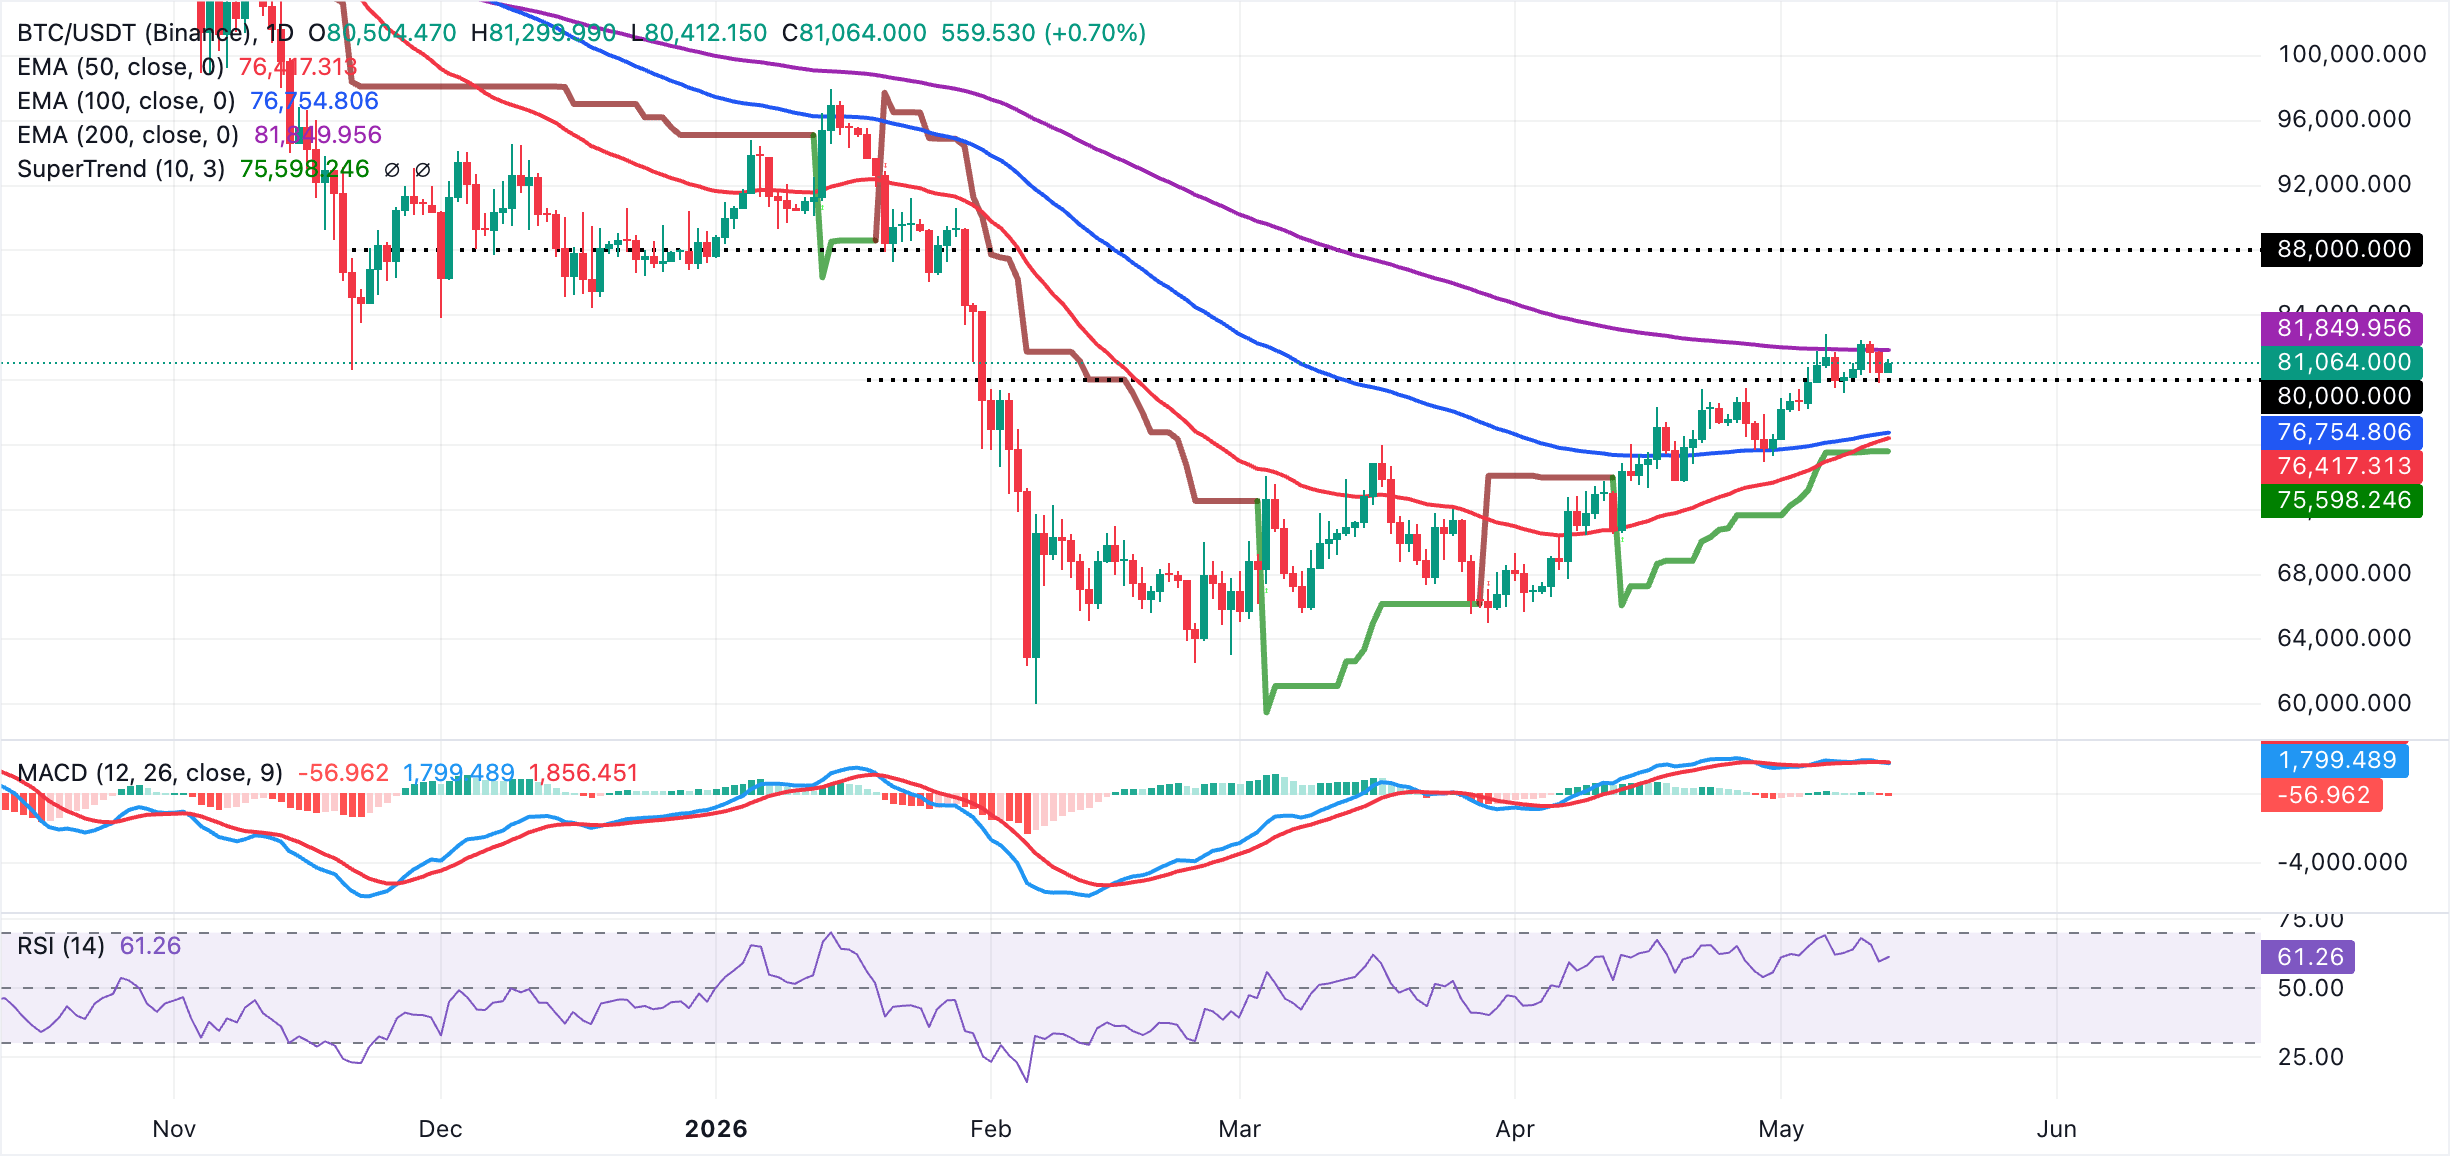
On the upside, the first notable barrier is the 200-day EMA, now aligned as resistance around $81,850 and capping further immediate gains. A clear daily close above this level would reopen the path toward fresh highs. On the downside, any pullback is initially expected to find demand at the pivotal $80,000 level, followed by the clustered 50- and 100-day EMAs between $76,417 and $76,755, with a deeper slide toward the SuperTrend support near $75,600 likely to attract dip-buying interest.
Altcoins technical outlook: Ethereum and XRP poised to extend recovery
Ethereum trades above $2,300, with the near-term tone seemingly capped as price holds below the 100-day and 200-day EMAs at roughly $2,341 and $2,532. The pair, however, remains supported by the 50-day EMA at $2,276 and the SuperTrend line near $2,145, hinting at an ongoing consolidation rather than a clean breakdown.
Meanwhile, the RSI sits just below the neutral 50 mark on the daily chart while the MACD histogram is negative. This outlook suggests that upside attempts may continue to struggle while ETH trades under its medium- and long-term EMAs.
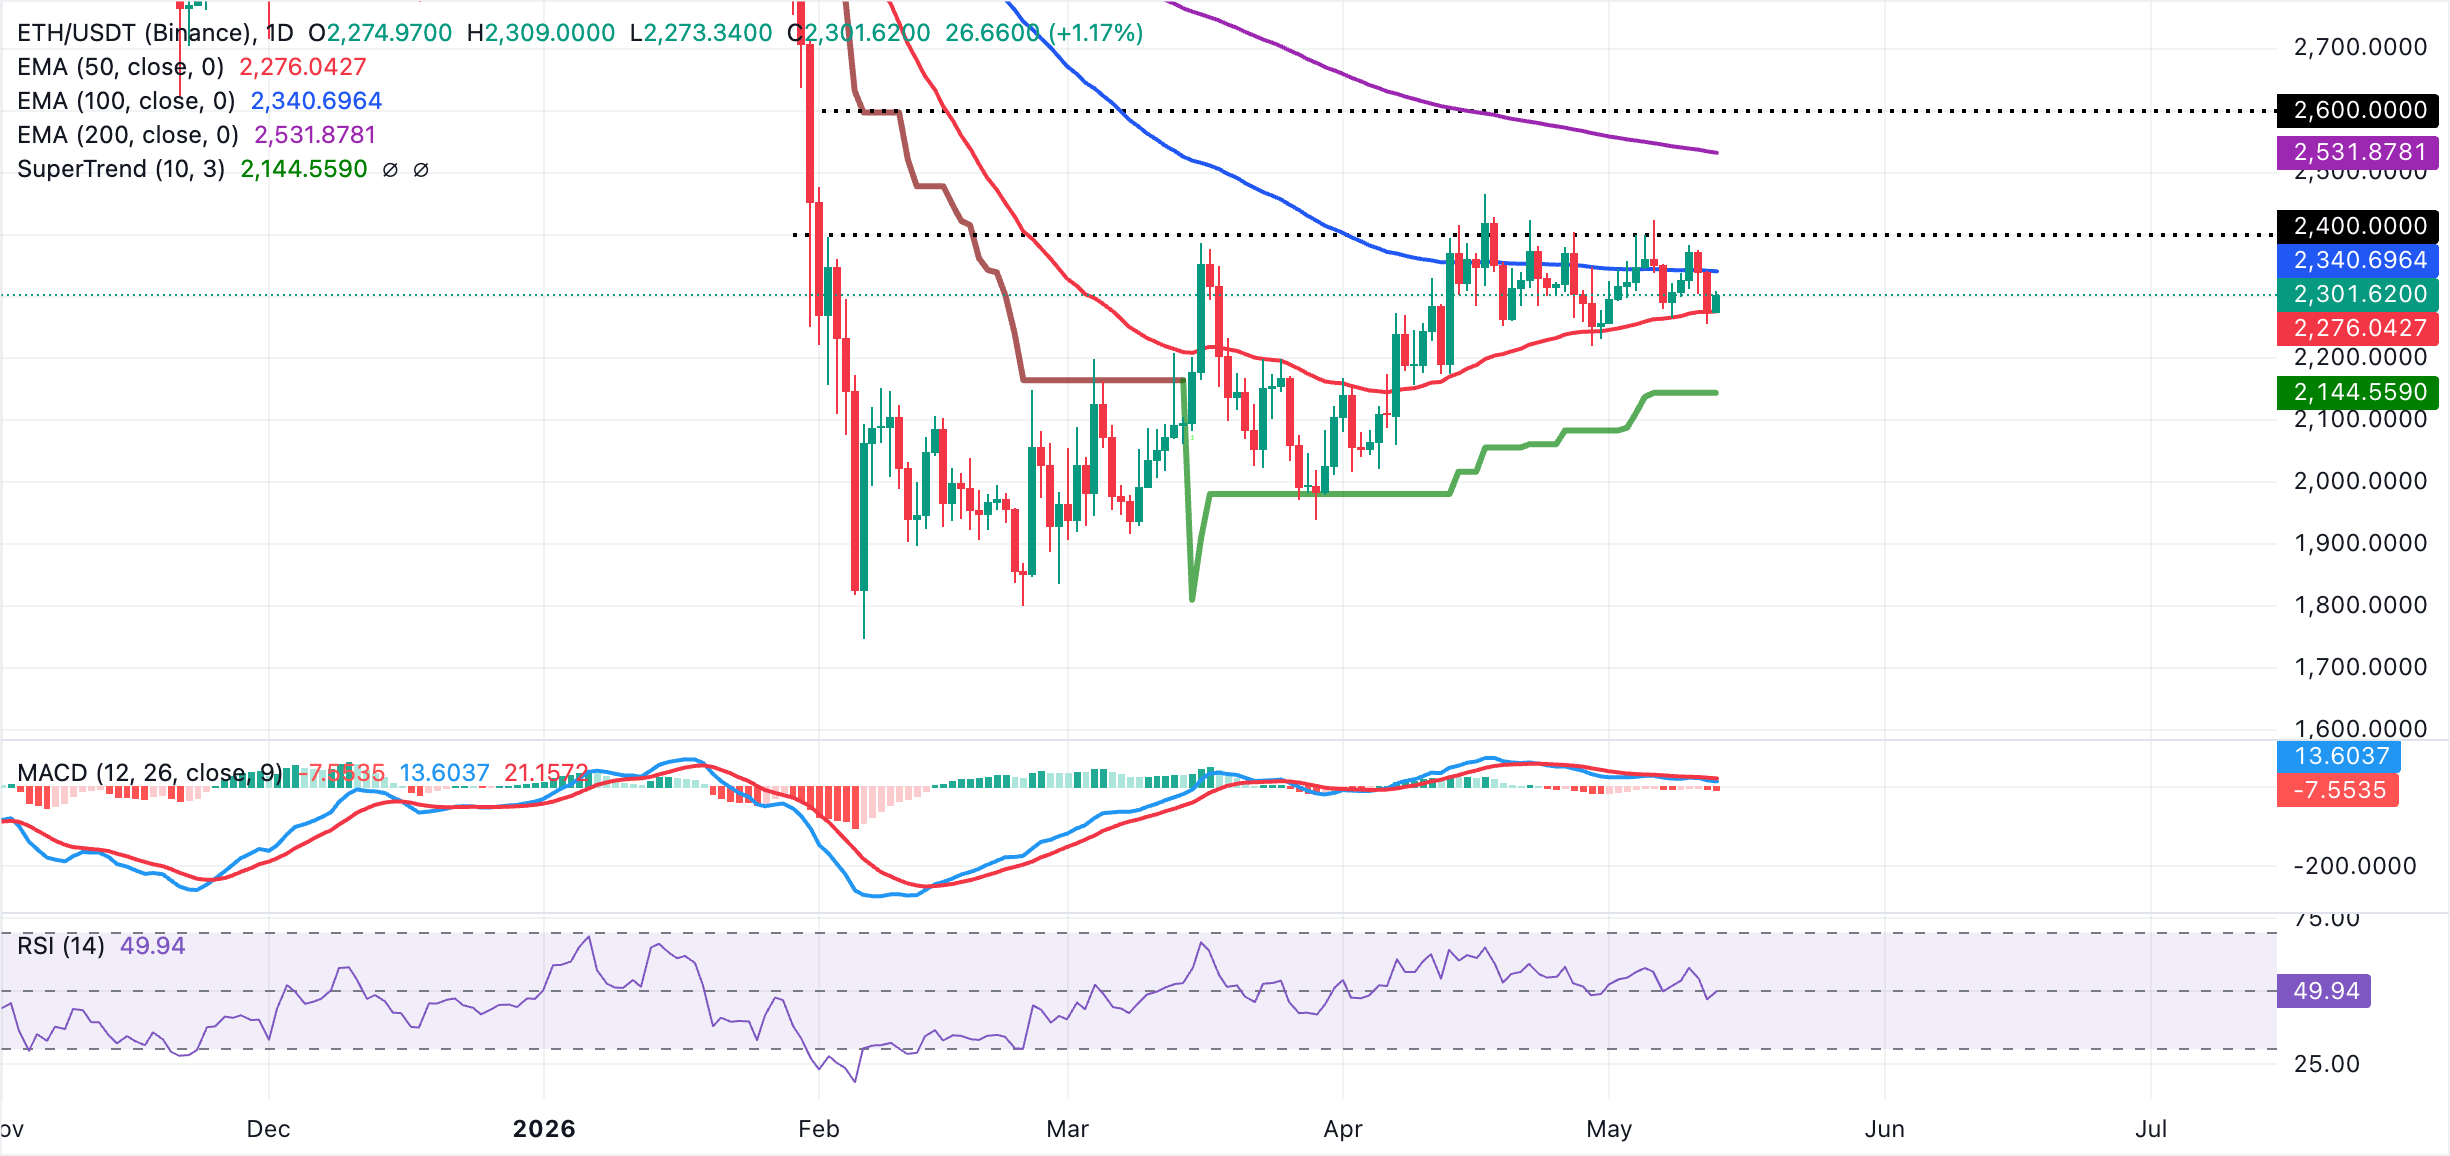
On the topside, initial resistance is seen at the 100-day EMA around $2,341. A daily close above this barrier would open the way toward the 200-day EMA near $2,532, where sellers are likely to re-emerge. On the downside, immediate support is provided by the 50-day EMA at $2,276, with a decisive break lower exposing the SuperTrend support zone around $2,145. Losing this demand area would reinforce the broader bearish bias and deepen the corrective phase.
XRP, on the other hand, trades at $1.46, holding above the 50-day EM at $1.42 and the SuperTrend support near $1.33, both of which hint at a constructive outlook in the near term. Despite the robust support, XRP still shows a capped tone, trading beneath the 100-day EMA at $1.50 and the broader 200-day EMA at $1.71.
The MACD histogram remains slightly positive on the daily chart, while the RSI hovers around 58, suggesting mild bullish momentum that has yet to overcome the overhead moving average and trendline barriers.
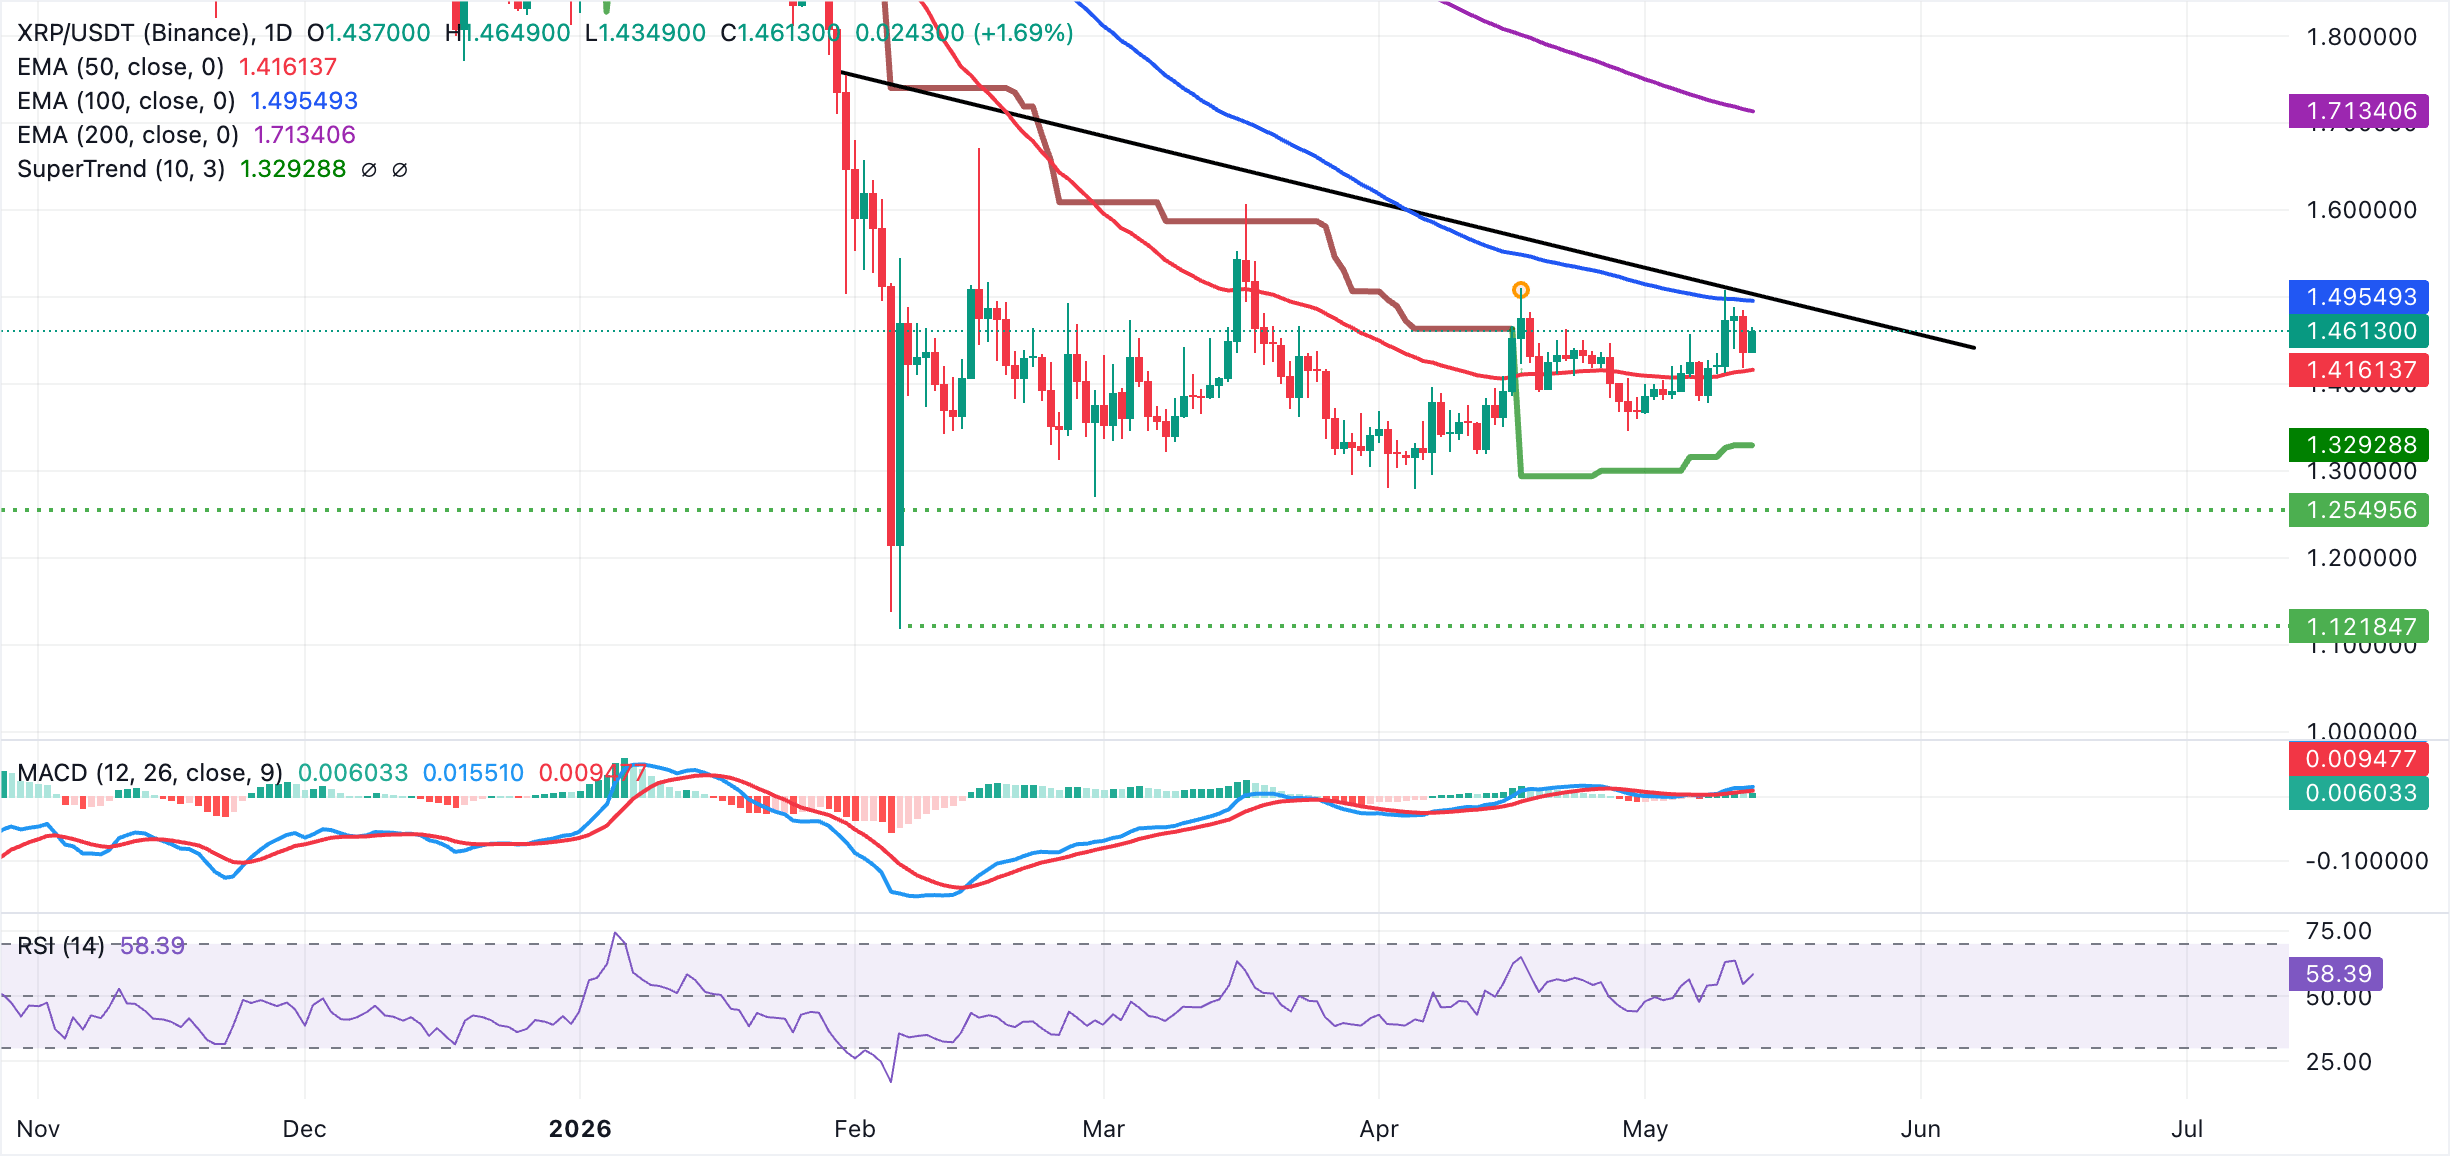
On the topside, immediate resistance lies at the 100-day EMA around $1.50, converging with a descending trendline. A sustained break above this cluster would open the way toward the longer-term 200-day EMA at $1.71. On the downside, initial support is aligned with the 50-day EMA at $1.42, followed by the SuperTrend line near $1.33, where a daily close below would negate the current constructive bias and expose deeper losses.
(The technical analysis of this story was written with the help of an AI tool.)
Bitcoin, altcoins, stablecoins FAQs
Bitcoin is the largest cryptocurrency by market capitalization, a virtual currency designed to serve as money. This form of payment cannot be controlled by any one person, group, or entity, which eliminates the need for third-party participation during financial transactions.
Altcoins are any cryptocurrency apart from Bitcoin, but some also regard Ethereum as a non-altcoin because it is from these two cryptocurrencies that forking happens. If this is true, then Litecoin is the first altcoin, forked from the Bitcoin protocol and, therefore, an “improved” version of it.
Stablecoins are cryptocurrencies designed to have a stable price, with their value backed by a reserve of the asset it represents. To achieve this, the value of any one stablecoin is pegged to a commodity or financial instrument, such as the US Dollar (USD), with its supply regulated by an algorithm or demand. The main goal of stablecoins is to provide an on/off-ramp for investors willing to trade and invest in cryptocurrencies. Stablecoins also allow investors to store value since cryptocurrencies, in general, are subject to volatility.
Bitcoin dominance is the ratio of Bitcoin's market capitalization to the total market capitalization of all cryptocurrencies combined. It provides a clear picture of Bitcoin’s interest among investors. A high BTC dominance typically happens before and during a bull run, in which investors resort to investing in relatively stable and high market capitalization cryptocurrency like Bitcoin. A drop in BTC dominance usually means that investors are moving their capital and/or profits to altcoins in a quest for higher returns, which usually triggers an explosion of altcoin rallies.

Plus d’un million d’utilisateurs se tournent vers FXStreet pour des données de marché en temps réel, des outils de graphiques, des analyses d’experts et des actualités Forex. Leur calendrier économique complet et leurs webinaires éducatifs aident les traders à rester informés et à prendre des décisions éclairées. FXStreet s’appuie sur une équipe d’environ 60 professionnels répartis entre le siège de Barcelone et diverses régions du monde.
Lire la suite


