
Crypto Today: Bitcoin, Ethereum, XRP trade under sustained selling pressure despite mild ETF inflows
Par John Isige
Mis à jour: 5 Jun 2026


ARTICLES POPULAIRES

Cryptocurrency prices remain under pressure as a risk-off mood persists on Friday, with Bitcoin (BTC) consolidating its losses above $62,000. Altcoins, including Ethereum (ETH) and Ripple (XRP), are extending their weakness, trading near lower support levels around $1,600 and $1.12, respectively.
- Bitcoin consolidates losses, trading above $62,000 on Friday, amid very mild $3 million in ETF inflows.
- Ethereum drawdown deepens toward $1,600, aligning with a weakening technical structure.
- XRP draws closer to its $1.10 support level despite mild capital inflows through spot ETFs.
Cryptocurrency prices remain under pressure as a risk-off mood persists on Friday, with Bitcoin (BTC) consolidating its losses above $62,000. Altcoins, including Ethereum (ETH) and Ripple (XRP), are extending their weakness, trading near lower support levels around $1,600 and $1.12, respectively.
Fading optimism for US-Iran peace deal weighs on risk appetite
The United States (US) and Iran appear far from reaching an amicable agreement to end the war that broke out in late February. Despite US President Donald Trump assuring the world that peace negotiations are progressing well and a deal is imminent, Iranian Foreign Minister Abbas Araghchi said Wednesday that “no tangible progress” had been made.
Still, Araghchi added that lines of communication with the US were still open but cautioned that Israel’s continued attack on the Lebanese capital, Beirut, as part of its broader campaign against Hezbollah would reignite a “full-scale resumption” of the US-Iran conflict.
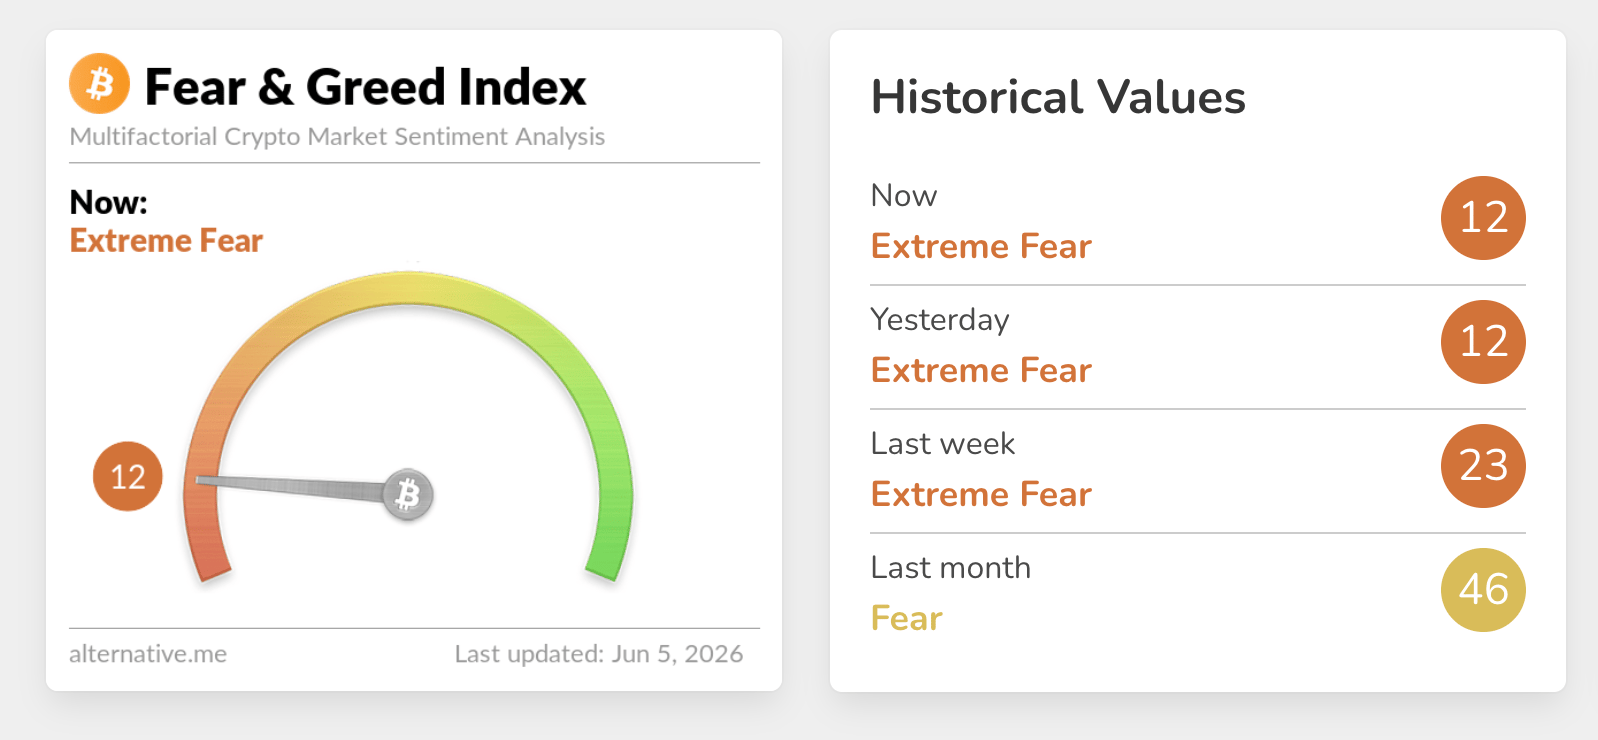
Sentiment across the crypto market remains significantly subdued, as reflected in the Fear & Greed Index, steady at 12 in Extreme Fear territory on Friday. This index averaged 46 in the Fear territory last month, reflecting a brief increase in the appetite for crypto assets in May.
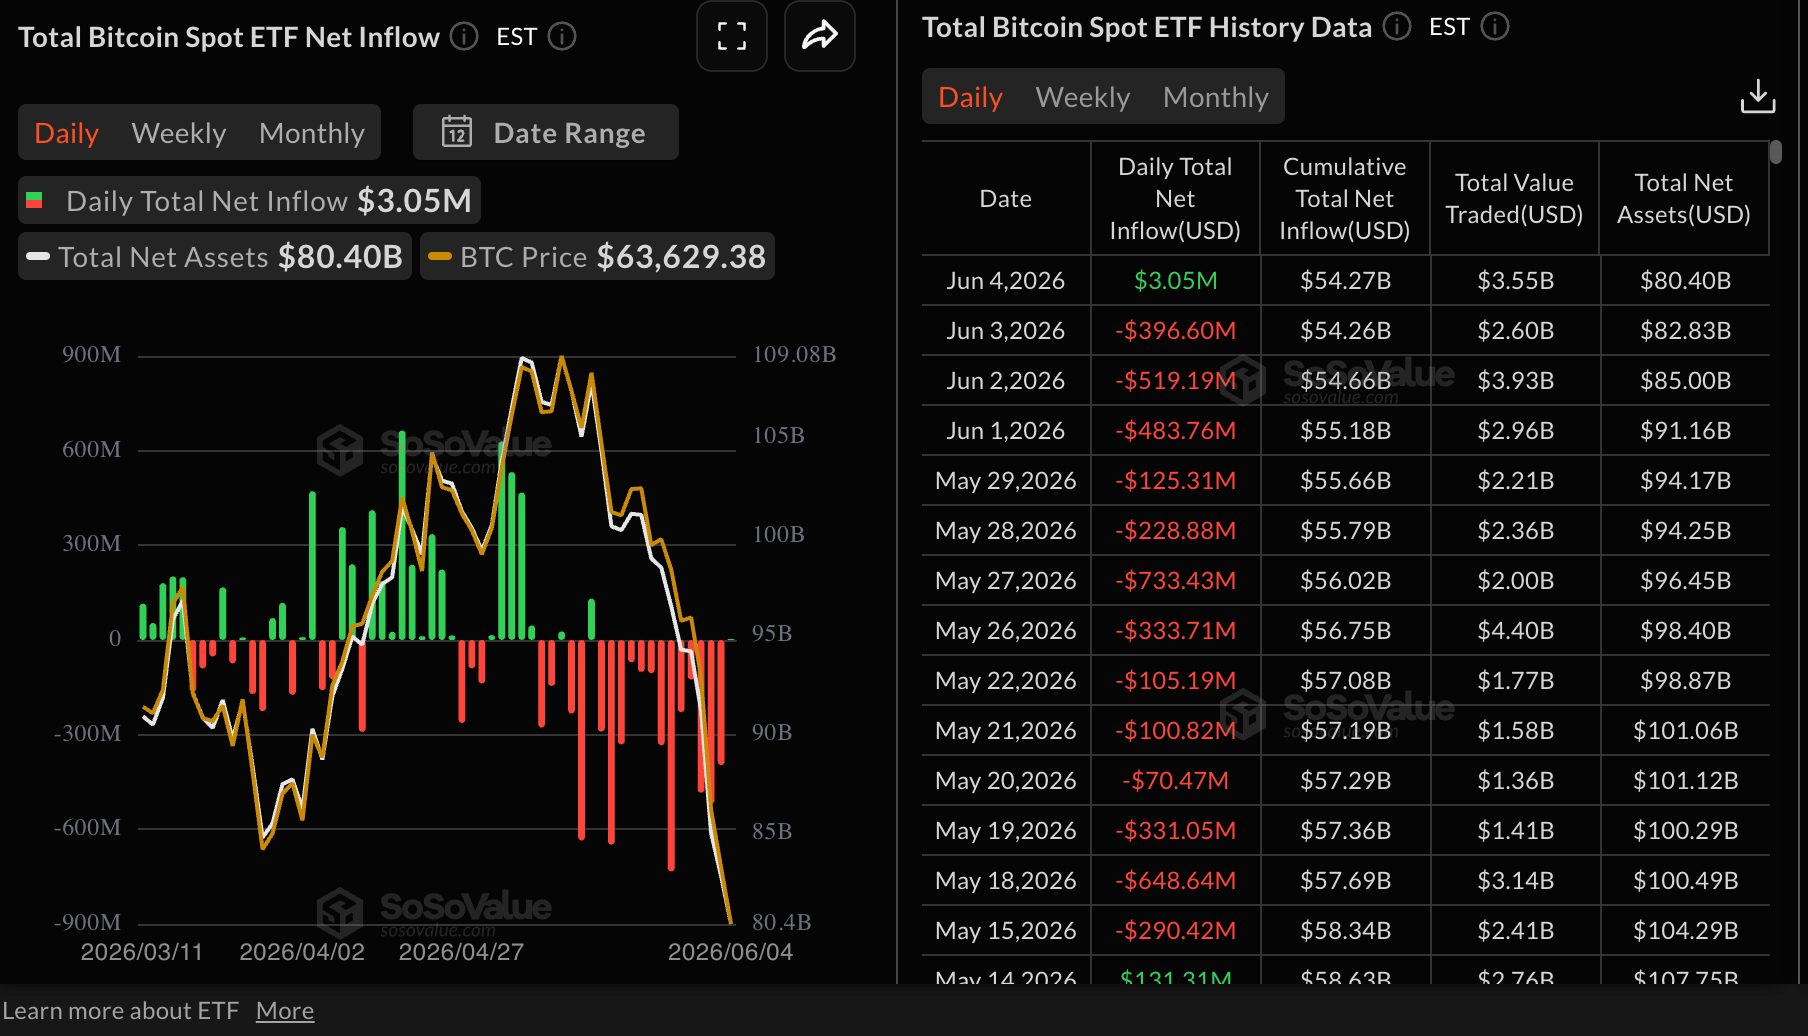
Bitcoin saw a very mild uptick in institutional interest, with inflows into spot Exchange-Traded Funds (ETFs) totaling $3 million on Thursday. Although minor, this marks the first inflow since May 15. The sell-off among institutional investors aligns with the broader risk-off mood, which has seen Bitcoin close in on the early February support at $60,000. Should inflows stabilize in the coming days and offset the incessant headwinds, BTC could regain momentum toward $70,000.
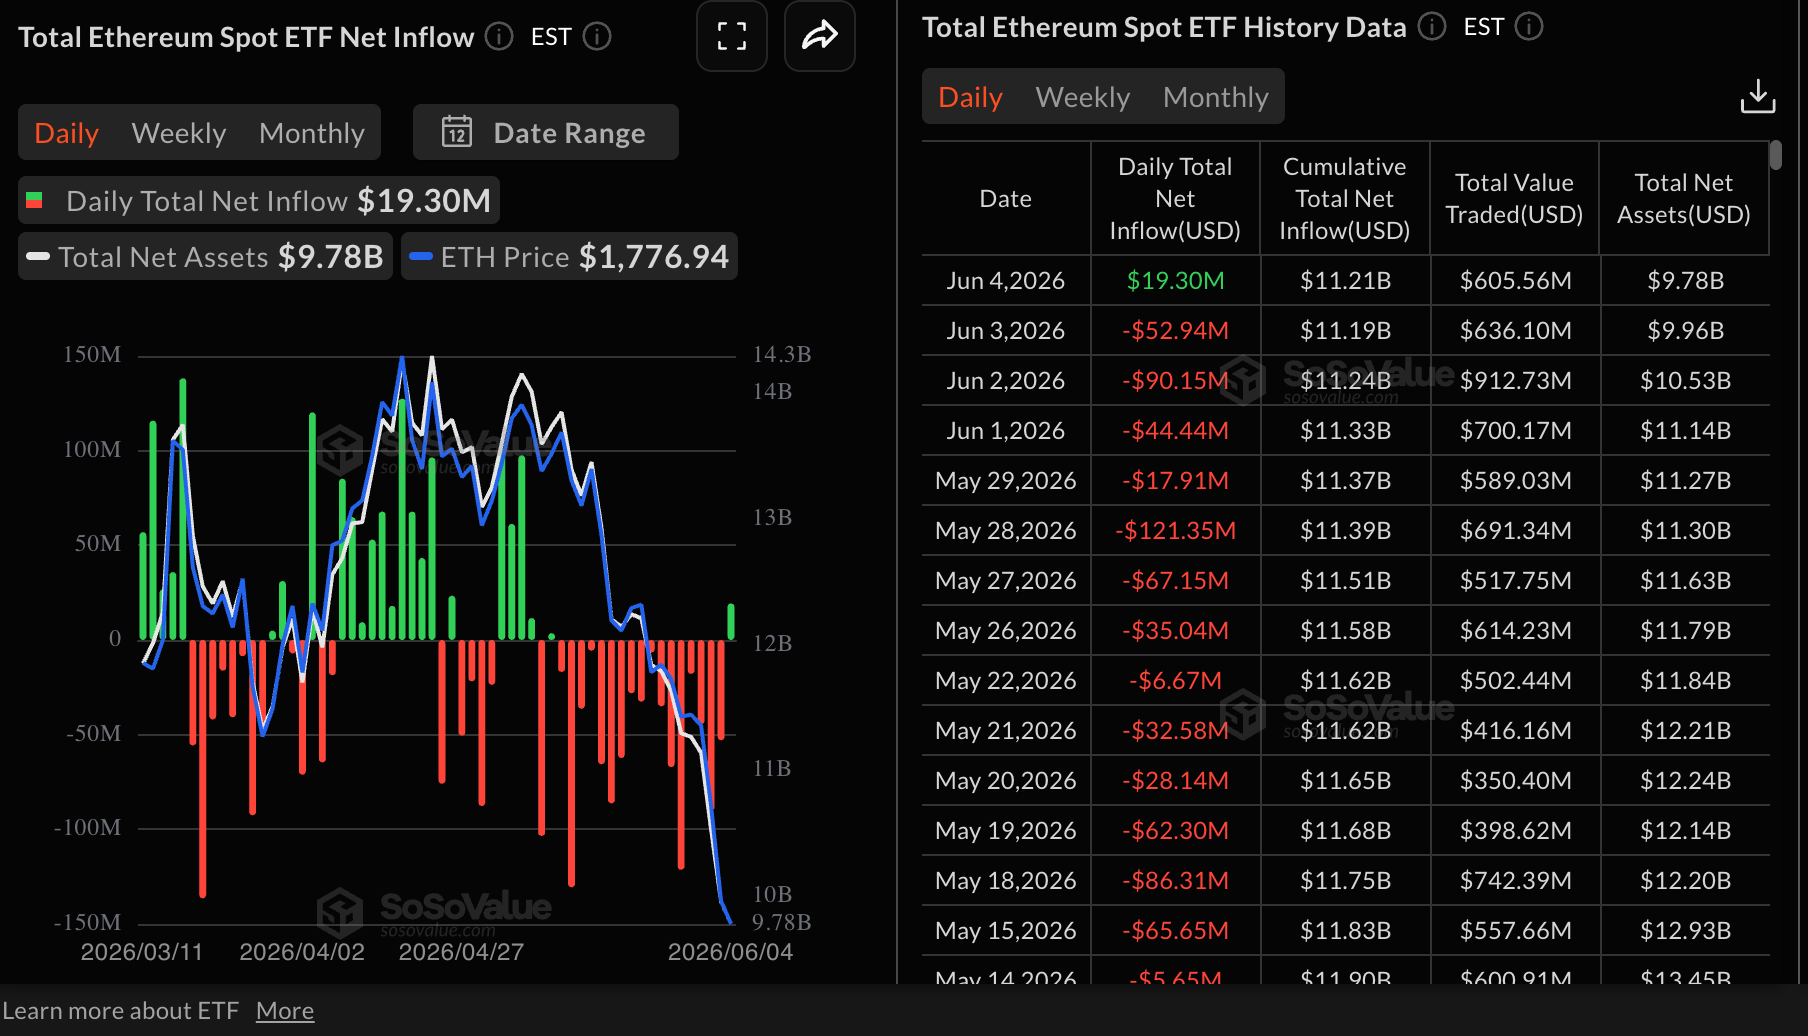
Meanwhile, Ethereum spot ETFs outpaced Bitcoin and XRP, attracting approximately $19 million in inflows on Thursday. SoSoValue data shows cumulative inflows rising to $11.21 billion from $11.19 billion on Wednesday. Net assets under management narrowed to $9.78 billion, down from $9.96 billion in the same period.
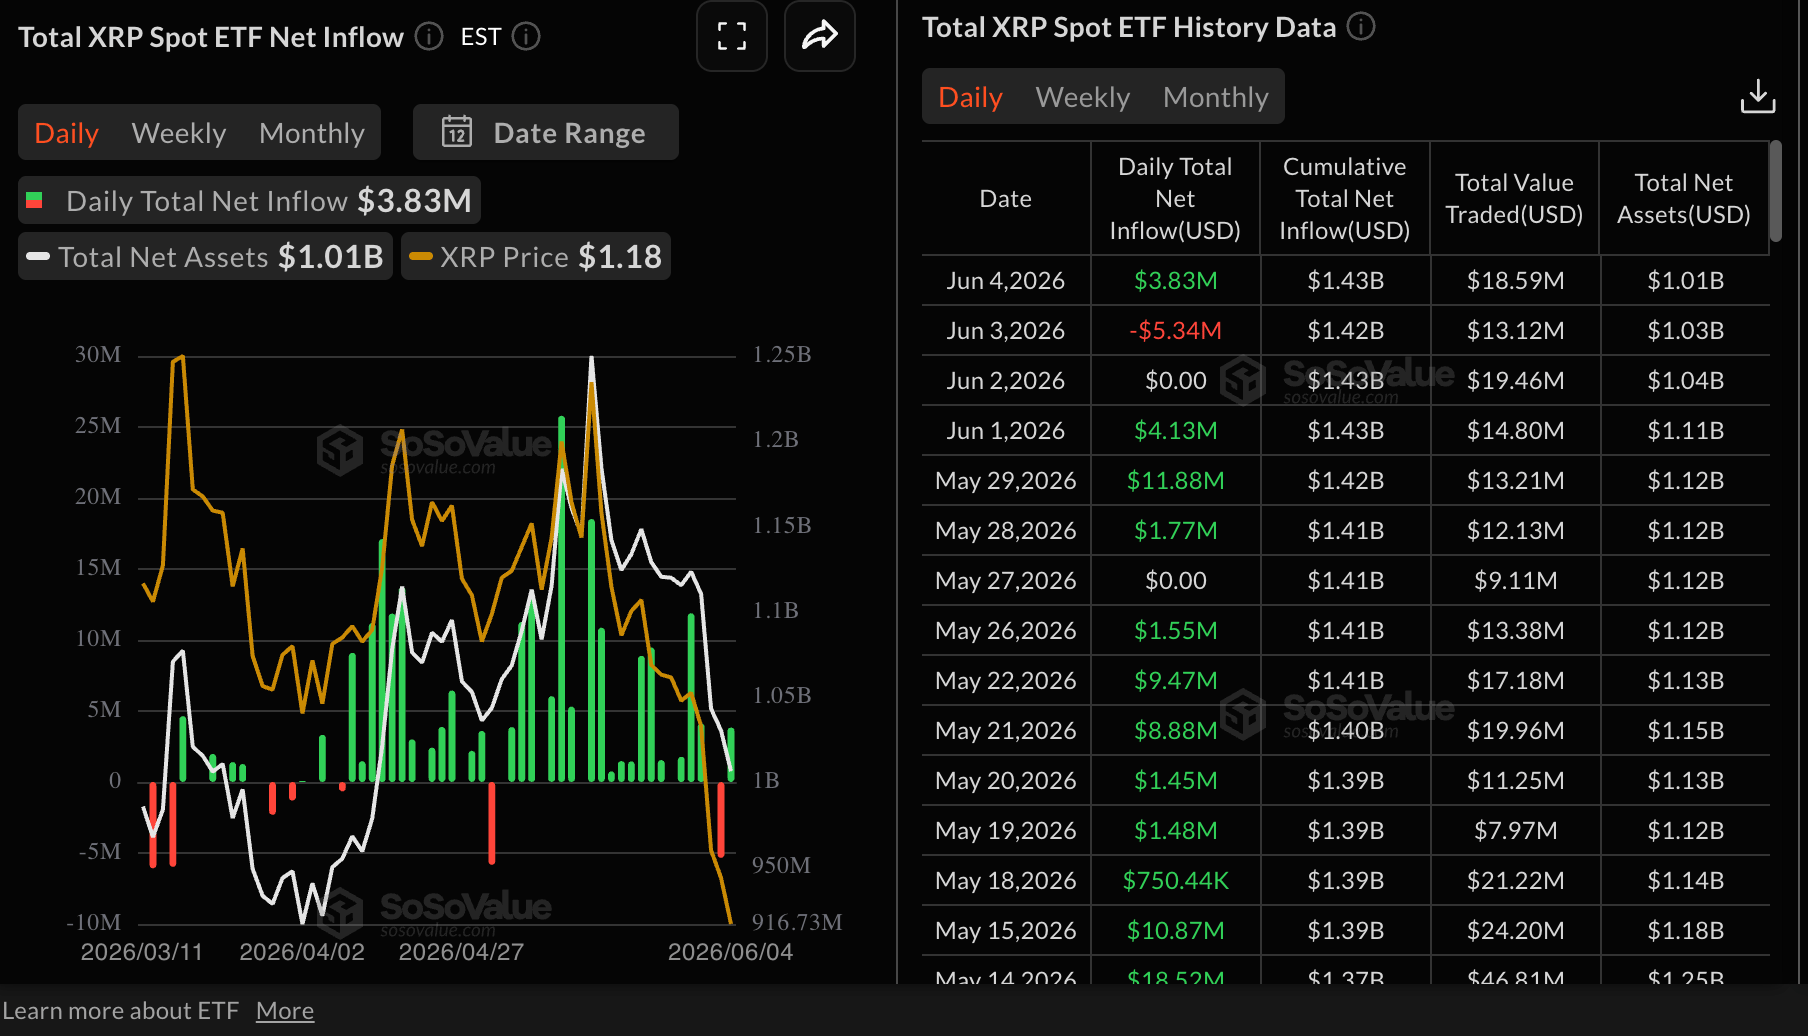
Institutional interest in XRP spot ETFs returned on Thursday amid mild inflows of $3.83 million. SoSoValue data shows that outflows totaled $5.34 million on Wednesday, as the broader sell-off ravaged across the crypto market.
Price analysis: Bitcoin tests critical support
Bitcoin trades above $62,000, extending its slide well below the key Exponential Moving Averages (EMAs) and reinforcing a bearish near-term bias. The spot price is entrenched under the 50-day EMA around $74,296, the 100-day EMA near $75,538 and the 200-day EMA close to $80,349, while a descending trendline resistance comes in lower, near $77,678, keeping rallies capped.
Momentum signals align with this downside structure, as the Relative Strength Index (RSI) sits deep in oversold territory near 17 on the daily chart and the Moving Average Convergence Divergence (MACD) histogram remains firmly negative with a widening bearish profile, hinting that selling pressure still dominates despite the stretched conditions.
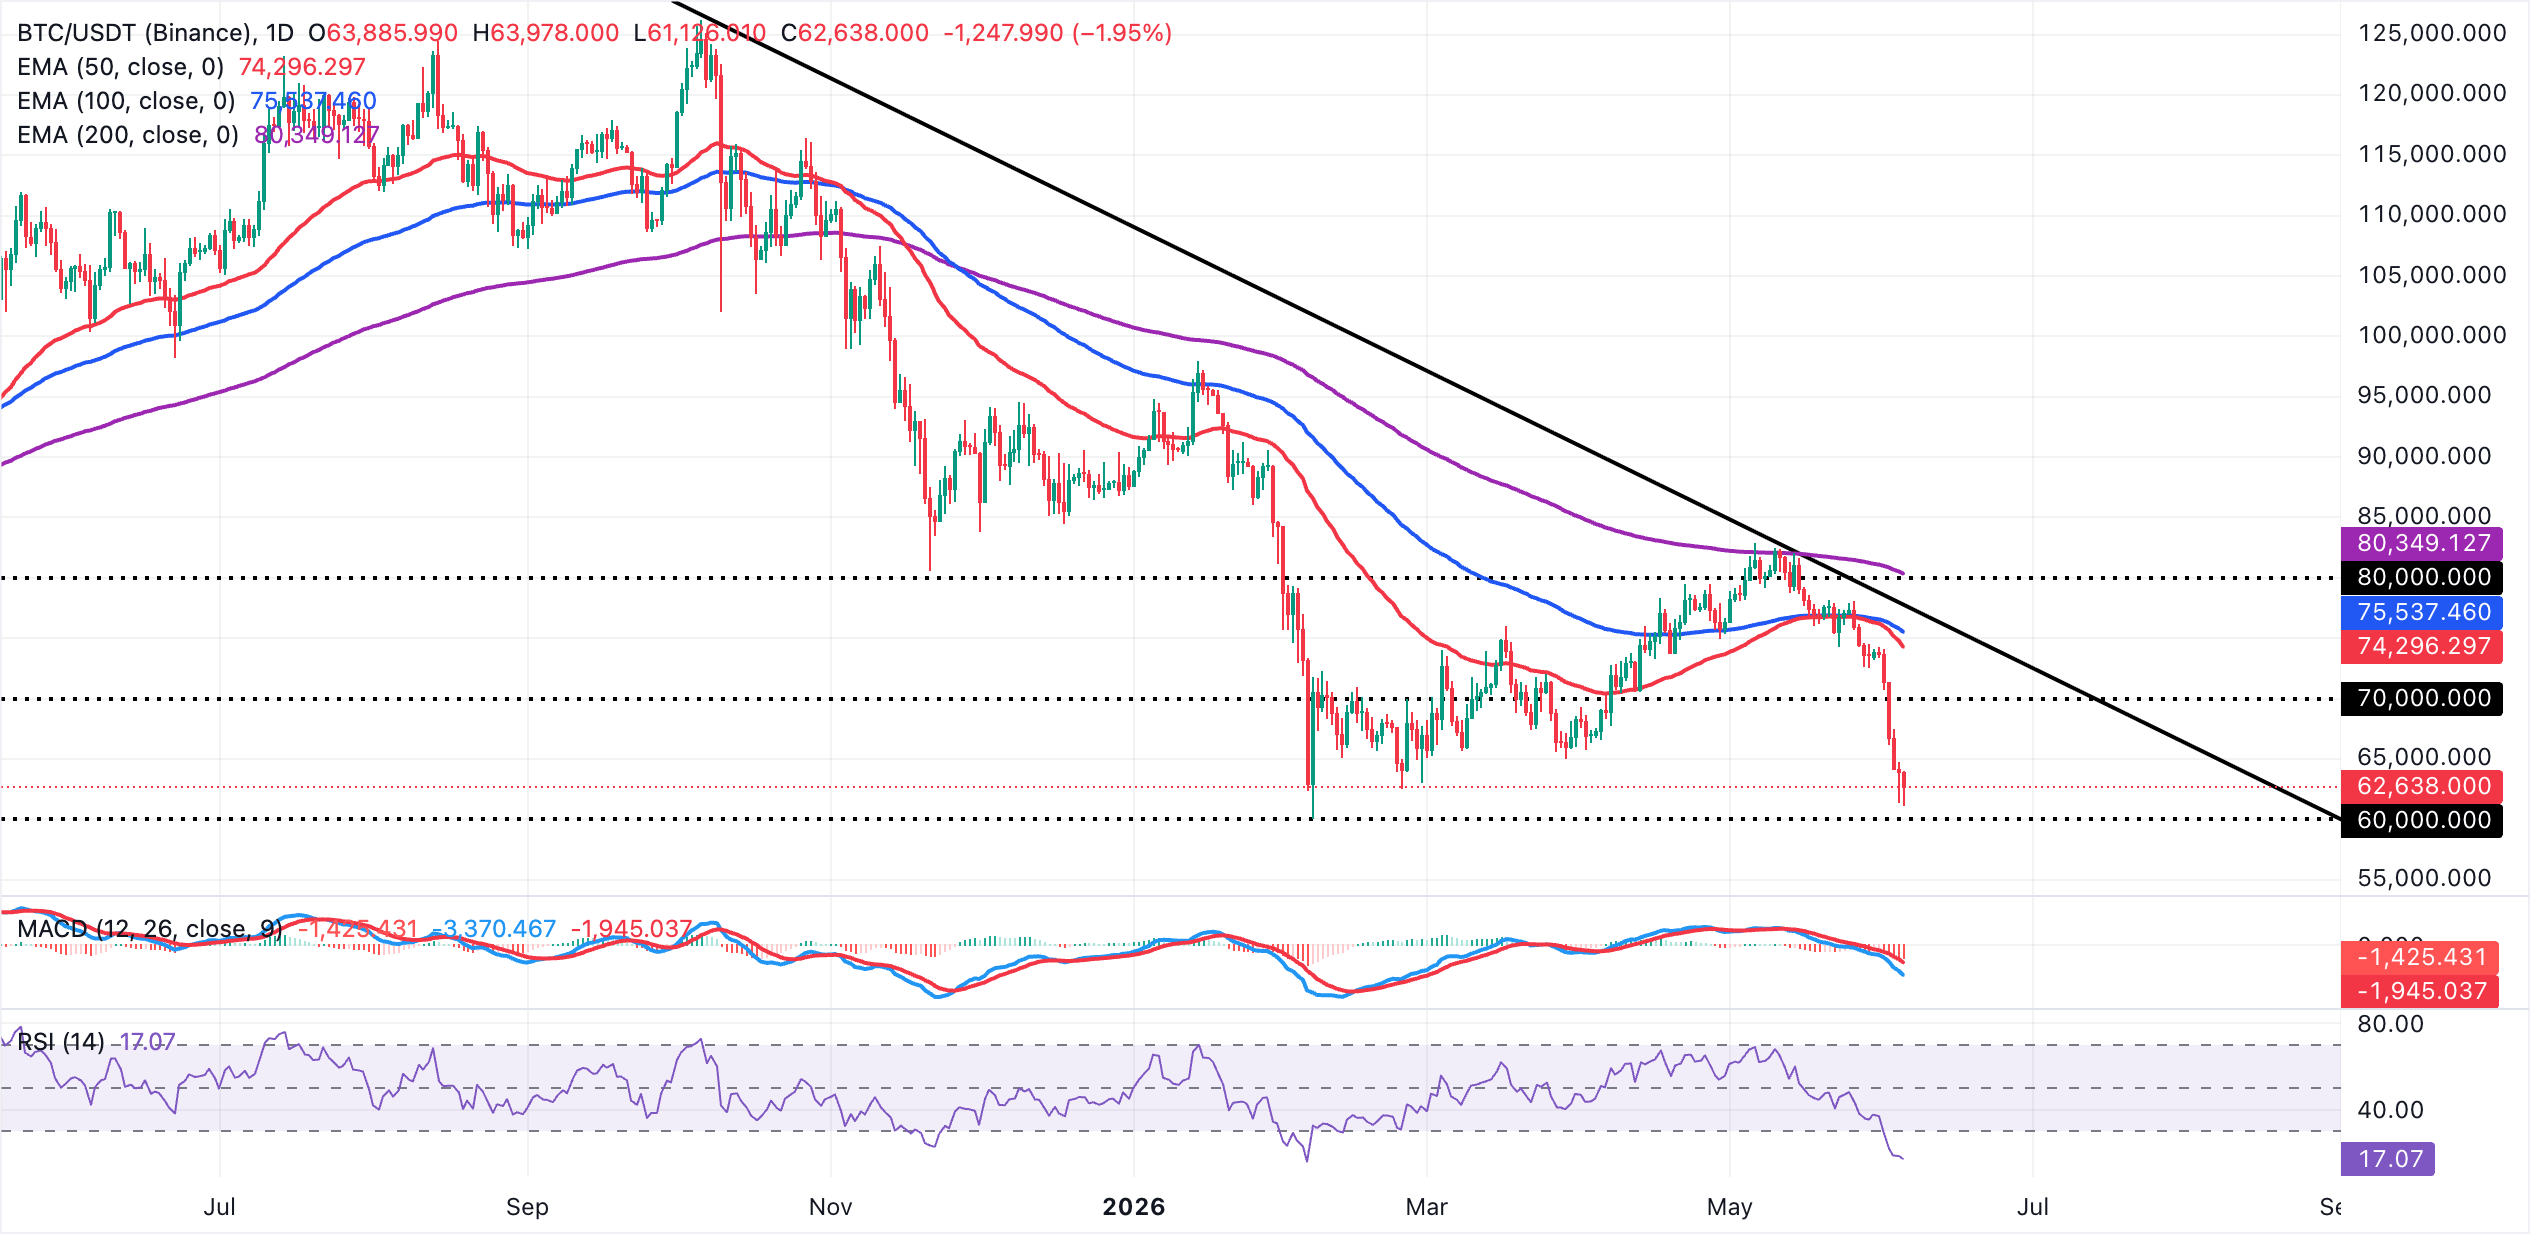
On the topside, initial resistance is seen at the 50-day EMA around $74,296, followed by the 100-day EMA near $75,538, with the descending trendline resistance clustered just above $77,678. Beyond that, the 200-day EMA at about $80,349 forms a higher cap that would need to be reclaimed to ease the broader downside bias.
A sustained break beneath this floor would expose deeper losses and signal an acceleration of the prevailing downtrend into the $50,000s.
Altcoins technical outlook: ETH and XRP slide further as bearish momentum builds
Ethereum trades at $1,674, maintaining a bearish near-term bias as price holds well below the 50-day, 100-day and 200-day EMAs at around $2,114, $2,225 and $2,472, respectively. The MACD histogram remains in negative territory on the daily chart, while the RSI hovers near 15, signaling extreme oversold conditions that could slow the current downside.
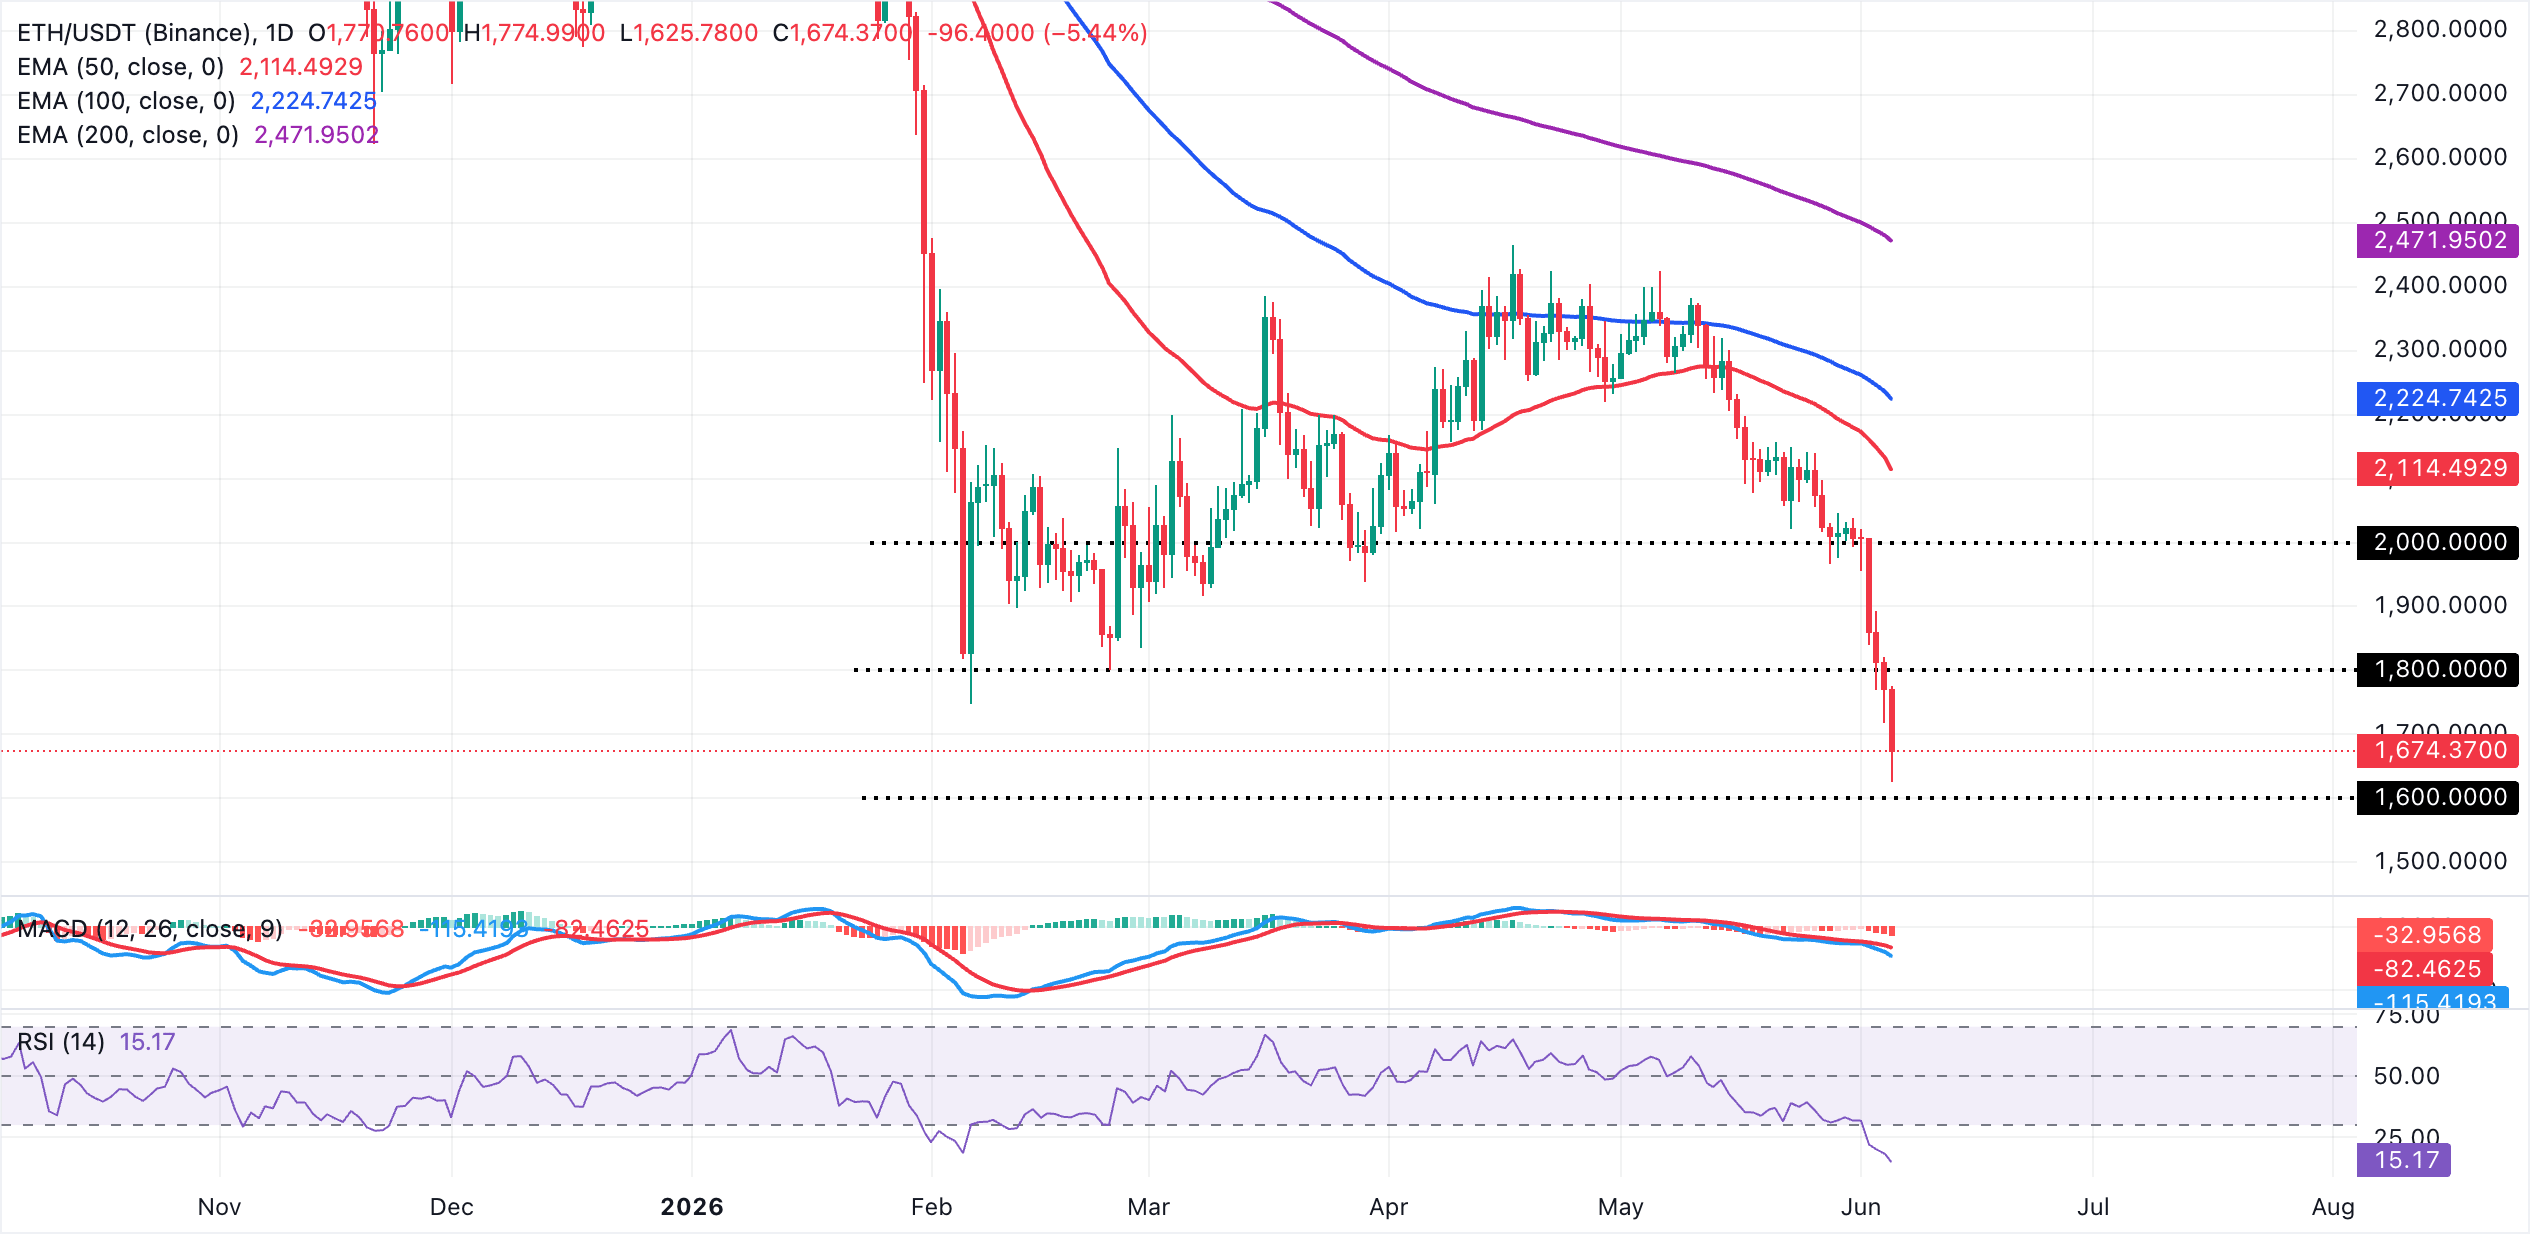
On the topside, initial resistance appears at the 50-day EMA near $2,114, followed by the 100-day EMA around $2,225 and then the 200-day EMA close to $2,472, levels that together define a broad supply zone that would need to be reclaimed to ease bearish pressure. The range at $1,600 serves as the initial support, but a deeper sell-off could confirm a prolonged bearish structure.
XRP, on the other hand, trades at $1.13, holding deep below the 50-day, 100-day and 200-day EMAs at $1.35, $1.43 and $1.64, keeping the broader tone decisively bearish while the long-standing downward resistance trendline, proxied around $1.52, remains a distant cap.
Momentum conditions reinforce the downside bias, with the RSI sliding to oversold territory near 21 on the daily chart and the MACD histogram extending further into negative ground, hinting that selling pressure persists even as the latest swing stretches to extreme levels.
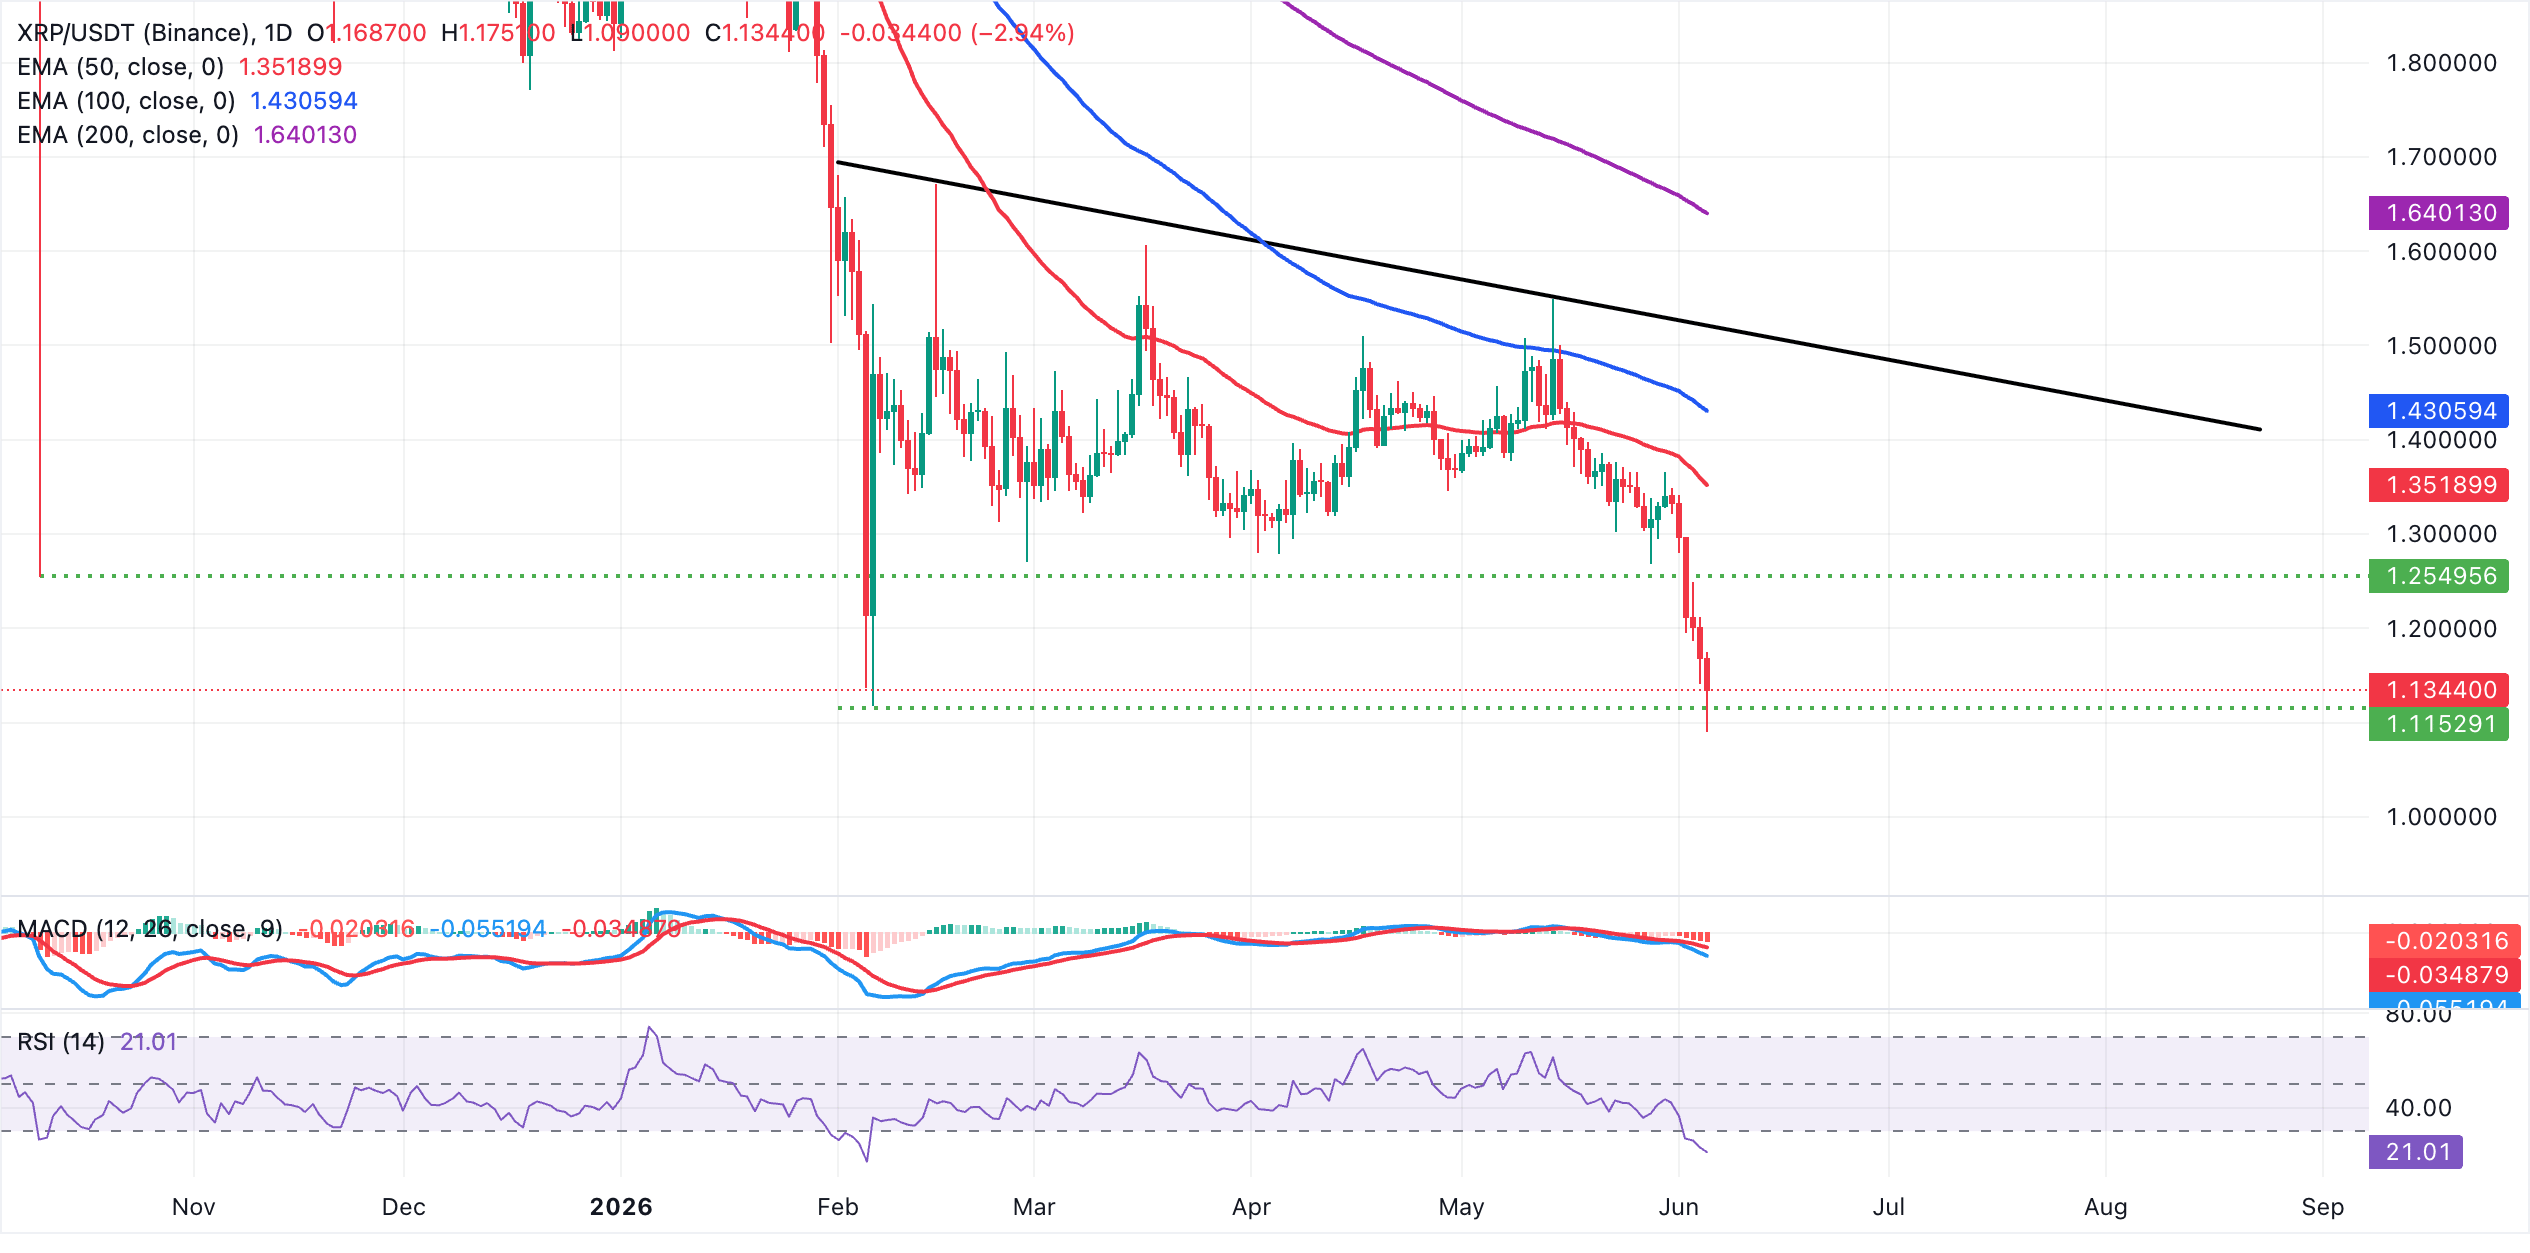
On the topside, initial resistance aligns with the 50-day EMA at $1.35, followed by the 100-day EMA at $1.43, while the descending resistance trendline near $1.52 and the 200-day EMA at $1.64 form a broader supply band that would need to be reclaimed to challenge the prevailing downtrend. A sustained sell-off could press XRP into the demand at $1.10, followed by a deeper correction to the critical $1.00 level.
(The technical analysis of this story was written with the help of an AI tool.)
Crypto ETF FAQs
An Exchange-Traded Fund (ETF) is an investment vehicle or an index that tracks the price of an underlying asset. ETFs can not only track a single asset, but a group of assets and sectors. For example, a Bitcoin ETF tracks Bitcoin’s price. ETF is a tool used by investors to gain exposure to a certain asset.
Yes. The first Bitcoin futures ETF in the US was approved by the US Securities & Exchange Commission in October 2021. A total of seven Bitcoin futures ETFs have been approved, with more than 20 still waiting for the regulator’s permission. The SEC says that the cryptocurrency industry is new and subject to manipulation, which is why it has been delaying crypto-related futures ETFs for the last few years.
Yes. The SEC approved in January 2024 the listing and trading of several Bitcoin spot Exchange-Traded Funds, opening the door to institutional capital and mainstream investors to trade the main crypto currency. The decision was hailed by the industry as a game changer.
The main advantage of crypto ETFs is the possibility of gaining exposure to a cryptocurrency without ownership, reducing the risk and cost of holding the asset. Other pros are a lower learning curve and higher security for investors since ETFs take charge of securing the underlying asset holdings. As for the main drawbacks, the main one is that as an investor you can’t have direct ownership of the asset, or, as they say in crypto, “not your keys, not your coins.” Other disadvantages are higher costs associated with holding crypto since ETFs charge fees for active management. Finally, even though investing in ETFs reduces the risk of holding an asset, price swings in the underlying cryptocurrency are likely to be reflected in the investment vehicle too.

Plus d’un million d’utilisateurs se tournent vers FXStreet pour des données de marché en temps réel, des outils de graphiques, des analyses d’experts et des actualités Forex. Leur calendrier économique complet et leurs webinaires éducatifs aident les traders à rester informés et à prendre des décisions éclairées. FXStreet s’appuie sur une équipe d’environ 60 professionnels répartis entre le siège de Barcelone et diverses régions du monde.
Lire la suite


