
Dogecoin Price Forecast: Bearish setup persists as institutional interest revives
Par Vishal Dixit
Mis à jour: 13 Apr 2026


ARTICLES POPULAIRES

Dogecoin (DOGE) is holding steady around $0.09000 at press time on Monday, after losing over 2% on the previous day. Institutional demand for the meme coin surged on Friday, with its largest inflow ever, while the leverage market shows mixed sentiment.
- Dogecoin hovers near $0.090 on Monday after two consecutive days of losses.
- Institutional demand resurfaces for DOGE with $1.34 million in inflows on Friday.
- Derivatives market refocuses on Dogecoin, fueling its Open Interest amid fluctuating funding rates.
Dogecoin (DOGE) is holding steady around $0.09000 at press time on Monday, after losing over 2% on the previous day. Institutional demand for the meme coin surged on Friday, with its largest inflow ever, while the leverage market shows mixed sentiment. Technically, Dogecoin leans bearish as it tapers within a descending triangle pattern.
Dogecoin derivatives remain mixed as institutions return
Sentiment toward Dogecoin is mixed amid the ongoing US-Iran conflict over control of the Strait of Hormuz. The DOGE-focused Exchange Traded Funds (ETFs) recorded $1.34 million in inflows on Friday, marking their largest inflow ever after 18 consecutive days of zero net flows. This sudden revival of institutional interest marks its fifth daily inflow since inception and solidifies near-term confidence.

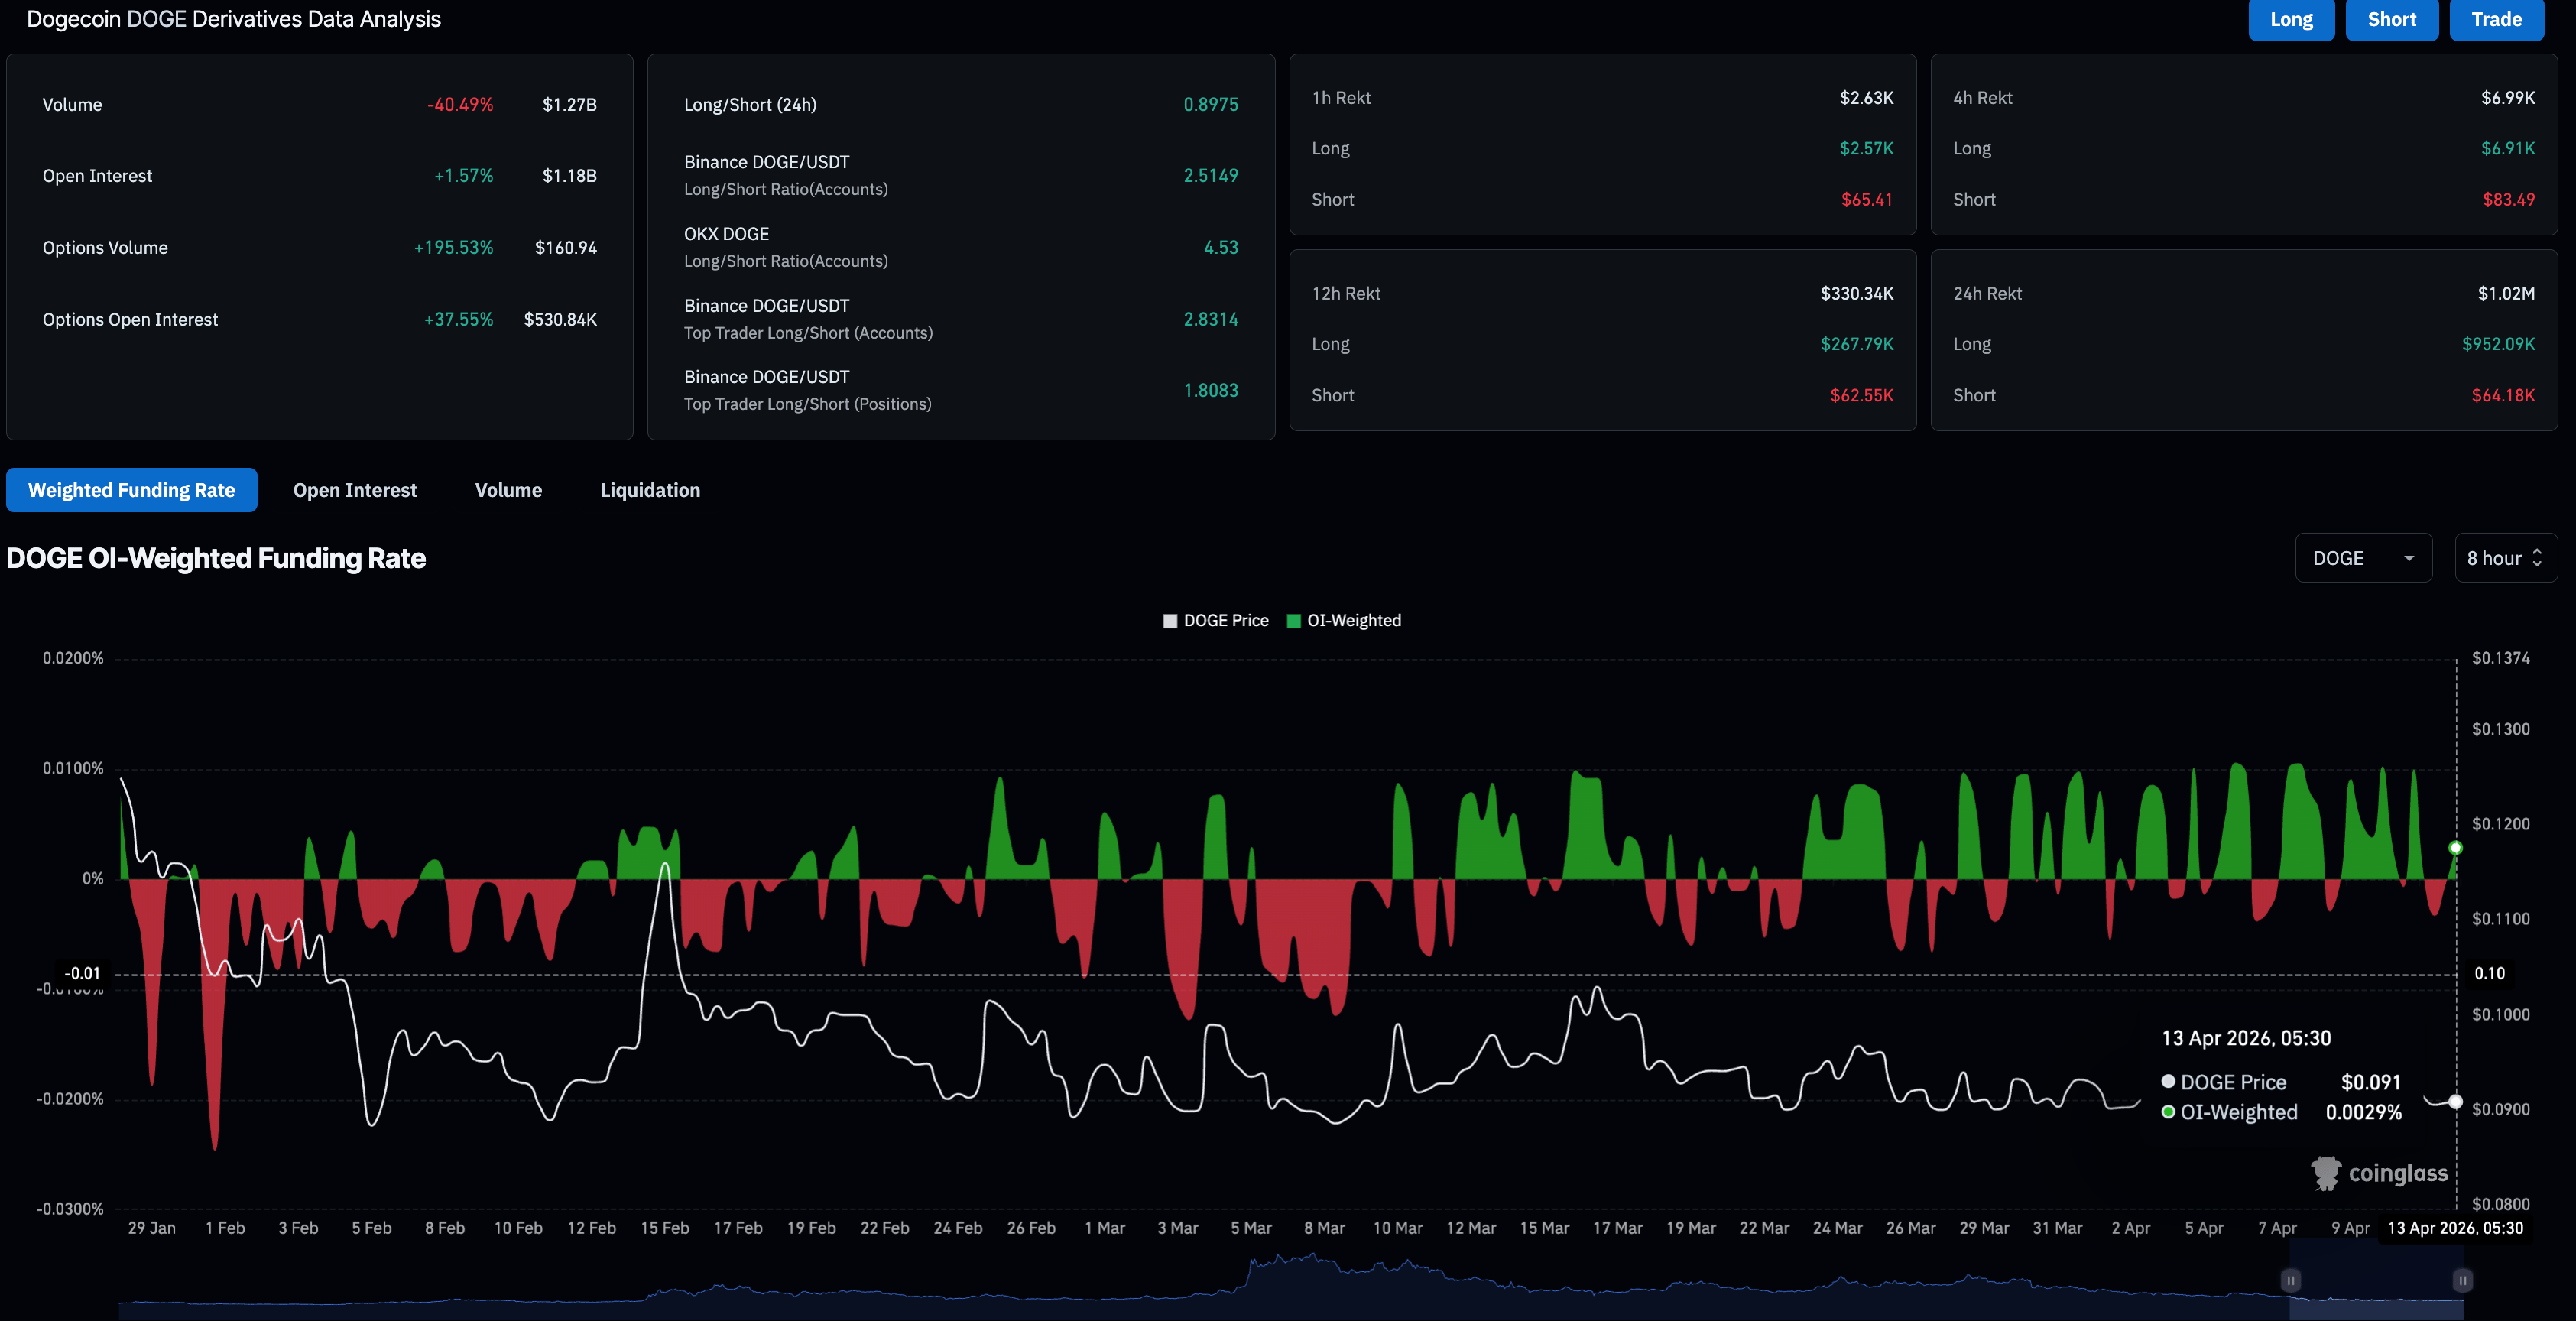
On the other hand, the derivatives market shows mixed sentiment. CoinGlass data shows DOGE futures Open Interest (OI) stands at $1.18 billion, rising over 1% in the last 24 hours, indicating an increase in the notional value of outstanding DOGE contracts.
However, the positional buildup lacks clear direction, as the OI-weighted funding rate fluctuates around the zero line. At the time of writing, the DOGE funding rate is positive at 0.0029%, suggesting a near-term bullish bias.
Technical outlook: Will DOGE give a bearish breakout?
Dogecoin maintains a bearish near‑term bias as it consolidates within a descending triangle pattern, with the 50-day Exponential Moving Average (EMA) at $0.0957 coinciding with the overhead trendline.
The bottom support of the triangle pattern aligns with the February 11 low at $0.0879. If DOGE closes below this level, it could threaten the February 6 low at $0.0800.
Meanwhile, the 100-day EMA at $0.1074 and the 200-day EMA at $0.1295 reinforce a broader downbeat structure. The Moving Average Convergence Divergence (MACD) indicator hovers marginally in positive territory, and the Relative Strength Index (RSI) around 45 suggests only modest downside pressure rather than a strong recovery impulse.
On the topside, immediate resistance is seen at the 50-day EMA near $0.0957. A daily close above this level would be needed to ease the current bearish pressure and open the way toward the 100-day EMA at $0.1074. Further up, the 200-day EMA at $0.1295 marks a more distant barrier that currently defines the upper boundary of the medium‑term bearish context.
(The technical analysis of this story was written with the help of an AI tool.)

Plus d’un million d’utilisateurs se tournent vers FXStreet pour des données de marché en temps réel, des outils de graphiques, des analyses d’experts et des actualités Forex. Leur calendrier économique complet et leurs webinaires éducatifs aident les traders à rester informés et à prendre des décisions éclairées. FXStreet s’appuie sur une équipe d’environ 60 professionnels répartis entre le siège de Barcelone et diverses régions du monde.
Lire la suite


