
Dogecoin Price Forecast: Smart money flees DOGE, exposing a 12% downside risk
Par Vishal Dixit
Mis à jour: 8 Jun 2026


ARTICLES POPULAIRES

Dogecoin (DOGE) price hovers around $0.0850 at press time on Monday, keeping steady after a 5% rebound the previous day from the February 6 low at $0.08000.
- Dogecoin hovers around $0.0850 on Monday, stalling after a 5% rebound the previous day.
- On-chain activity shows smart money trimming their DOGE holdings to a five-month low.
- Retail interest in DOGE remains weak after 14% drop last week.
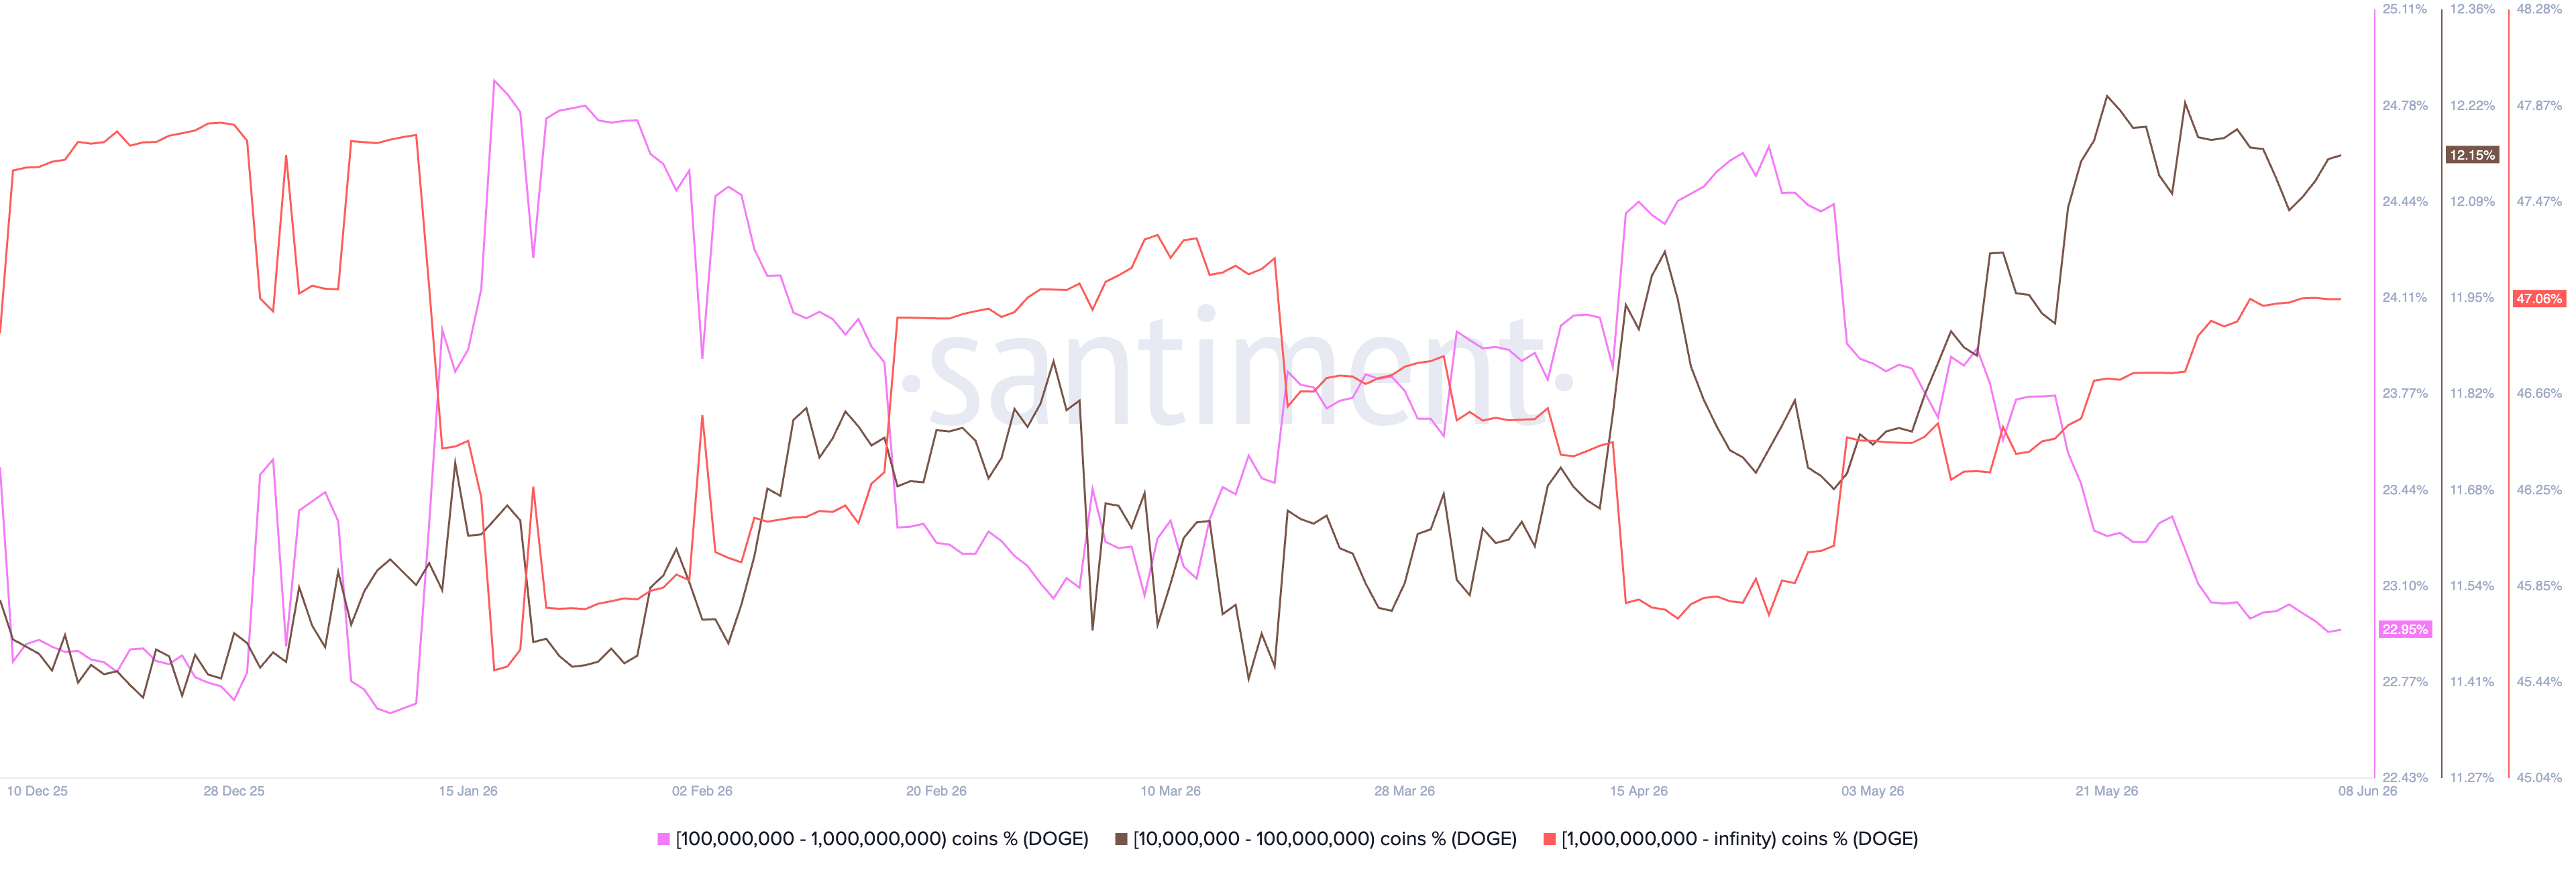
Dogecoin (DOGE) price hovers around $0.0850 at press time on Monday, keeping steady after a 5% rebound the previous day from the February 6 low at $0.08000. On-chain data show that large-wallet investors with 100 million to 1 billion DOGE have reduced their holdings to a five-month low, providing the downside pressure. Meanwhile, the DOGE futures Open Interest is down to a two-month low, suggesting weaker retail interest amid the broader market correction.
Smart money is dumping DOGE
On-chain data shows that Dogecoin, the oldest meme coin in the crypto market, is losing its place in smart investors' portfolios. According to Santiment, wallets with over 1 billion DOGE, typically linked to exchanges, now hold 47.06% of the circulating supply, up from the low of 45.71% on April 18. Although the surge in potential exchange-linked wallet holdings does not indicate direct selling pressure, the decline in smart investors' holdings weighs on Dogecoin.
Wallets holding 100 million to 1 billion DOGE have reduced their exposure to 22.95% of the circulating supply, down from 24.63% on April 25. This trimming has reached its lowest level in five months, reinforcing reduced interest in DOGE.
On the retail side, the risk-on sentiment in Dogecoin futures is waning. CoinGlass data shows the DOGE futures Open Interest (OI) is flatlining just above the $1 billion threshold, after a clear downtrend from the May 15 high of $1.76 billion. This reduction in the notional value of outstanding DOGE contracts to a two-month low reflects a lack of risk appetite for DOGE.
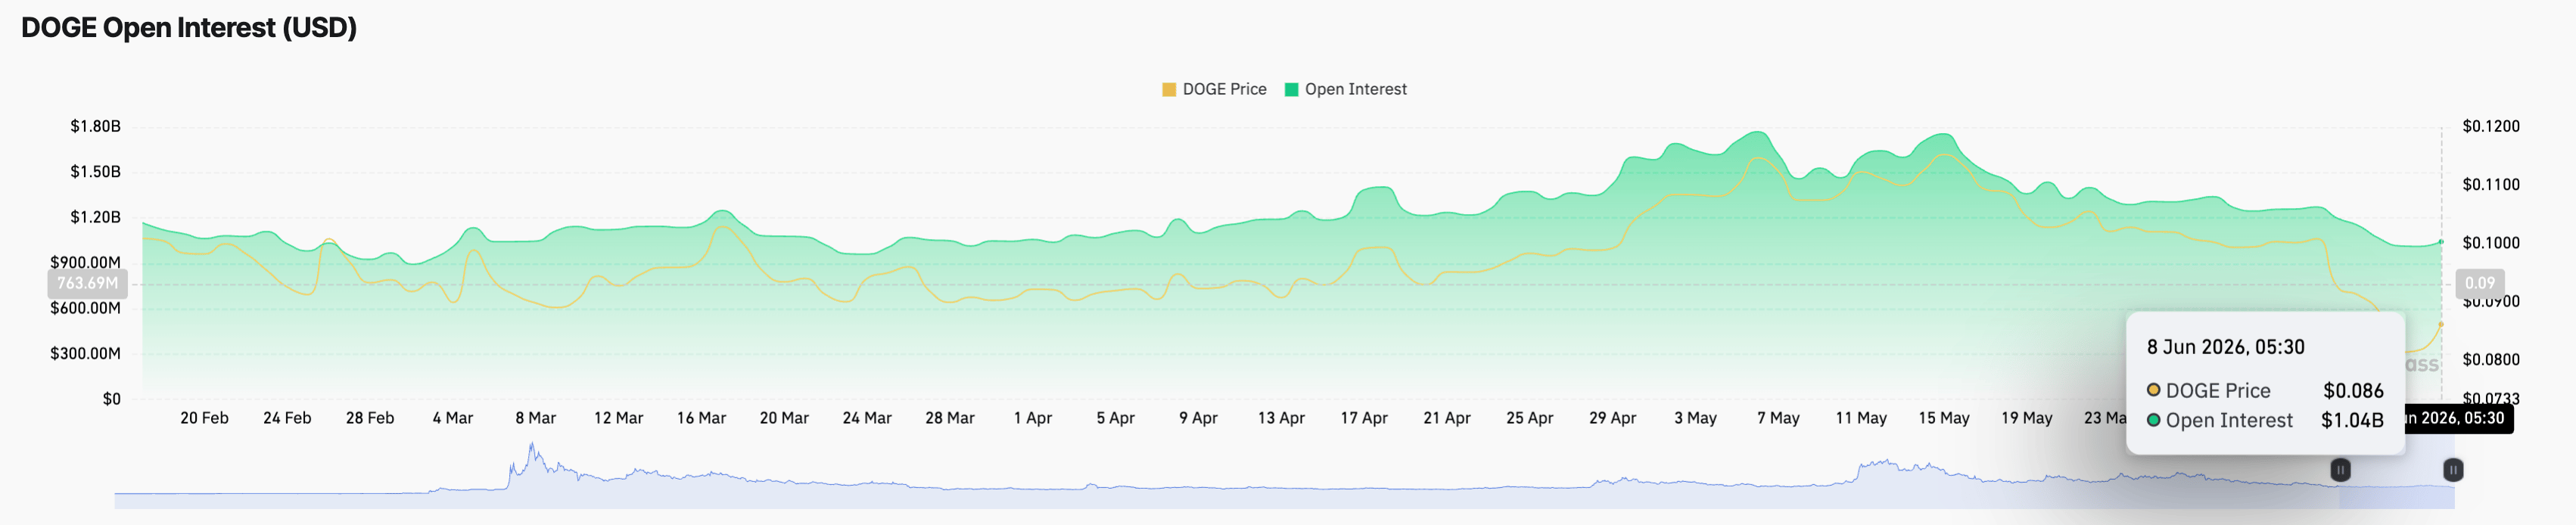
A steeper correction in DOGE OI could add weight to the falling spot market prices, risking the $0.0800 threshold.
Technical outlook: Will DOGE hold above $0.0800?
Dogecoin price hovers around $0.0857 at press time on Monday, stalling below the now-resistance level at $0.0879, which was previously support marked by the February 11 low. The meme coin consolidates below $0.0879 after a 5% rebound on Sunday, following a Dragonfly Doji (long-tailed, short-bodied) candle around the February 6 low at $0.0800, reflecting a near-term bullish stronghold.
From a technical perspective, the rebound could transform the steep correction in DOGE into a minor accumulation zone, increasing the chances of an upward reversal. That said, the downside momentum seems stretched on the daily chart as the Relative Strength Index (RSI) at 30 shows an uptick from the oversold zone. Yet, the Moving Average Convergence Divergence (MACD) indicator remains in negative territory, reflecting a significant bearish momentum.
Still, a slip below the $0.0800 level resulting in a daily close would expose a 12% downside risk to the January 8, 2024, low at $0.0741, followed by the November 1, 2023, low at $0.0654.
On the topside, initial resistance appears at $0.0879, followed by the 50-day EMA at around $0.0989, near the $0.1000 psychological threshold.
(The technical analysis of this story was written with the help of an AI tool.)

Plus d’un million d’utilisateurs se tournent vers FXStreet pour des données de marché en temps réel, des outils de graphiques, des analyses d’experts et des actualités Forex. Leur calendrier économique complet et leurs webinaires éducatifs aident les traders à rester informés et à prendre des décisions éclairées. FXStreet s’appuie sur une équipe d’environ 60 professionnels répartis entre le siège de Barcelone et diverses régions du monde.
Lire la suite


