
Dow Jones Industrial Average rallies as ceasefire hopes lift sentiment
Par Joshua Gibson
Mis à jour: 1 Apr 2026


ARTICLES POPULAIRES

The Dow Jones Industrial Average climbed around 400 points on Wednesday, or roughly 0.9%, as equities extended their rally into a second session on growing hopes that an end to the US-Iran conflict may be in sight.
- The Dow gained over 400 points as growing optimism around a potential US-Iran ceasefire boosted risk appetite across all three major indexes.
- Nike tumbled after issuing weak forward guidance, projecting sales declines for the rest of the calendar year including a sharp drop in China.
- Oil prices pulled back around 1% as President Trump signaled US forces could leave Iran within weeks, easing energy supply fears.
- Strong retail sales and private payrolls data reinforced the view that the US economy is absorbing the energy shock, though ISM prices paid surged.
The Dow Jones Industrial Average climbed around 400 points on Wednesday, or roughly 0.9%, as equities extended their rally into a second session on growing hopes that an end to the US-Iran conflict may be in sight. The S&P 500 rose about 1% while the Nasdaq Composite outperformed with a gain of roughly 1.6%, led by strength in mega-cap tech names.
Ceasefire talk drives broad-based rally
The session's bullish tone was set early after President Trump posted on Truth Social that Iran's president had requested a ceasefire. Trump added that the US would consider the offer only when the Strait of Hormuz is "open, free, and clear," while maintaining aggressive rhetoric toward Tehran. This follows Trump's remarks late Tuesday that he expects US military forces to leave Iran within two to three weeks. While Iran's foreign minister pushed back against what he described as threats and deadlines, the market read the situation as an incremental step toward de-escalation. However, with Trump set to deliver a national address later Wednesday evening, traders remain on edge. Without a definitive all-clear, volatility is expected to persist in the near term.
Oil retreats as war premium eases
West Texas Intermediate (WTI) Crude Oil futures shed around 1% to trade just above $100 per barrel, while Brent crude slipped by a similar margin to just above $102. The pullback came as ceasefire rhetoric took some of the geopolitical risk premium out of energy markets, though prices remain historically elevated given the ongoing Strait of Hormuz disruptions. Oil has been a dominant macro driver throughout this conflict, and any material shift in war dynamics will continue to set the tone for equities and inflation expectations alike.
Nike sinks on grim outlook
Nike (NKE) was the session's most notable decliner, tumbling around 14% after the athletic wear giant issued a surprisingly downbeat outlook despite beating Wall Street expectations on both revenue and earnings per share (EPS) for the fiscal third quarter. Revenue came in at $11.28 billion, slightly ahead of estimates, while EPS of $0.35 topped the $0.28 consensus. The damage came from guidance, where management warned that Q4 sales are expected to fall between 2% and 4%, well below analyst expectations for modest growth. Greater China revenue is projected to decline around 20% in the current quarter. Net income dropped 35% year over year and gross margins contracted as higher tariffs in North America continued to weigh on profitability.
Tech and AI sentiment get a boost
Big tech names posted modest gains across the board, with Microsoft (MSFT), Nvidia (NVDA), Alphabet (GOOG), Meta (META), and Amazon (AMZN) all trading higher. Risk sentiment was supported not only by the ceasefire headlines but also by the formal closing of OpenAI's record $122 billion funding round at an $852 billion valuation. Amazon committed $50 billion to the round, while Nvidia and SoftBank each contributed $30 billion. The deal reinforced the market's conviction in the AI infrastructure buildout, providing a sentiment tailwind for chip and cloud names. Elsewhere, Intel (INTC) jumped around 10% after announcing the buyback of its Ireland chip fabrication facility, which investors took as a sign of renewed strategic focus.
Economic data paints a mixed picture
The day's data releases painted a broadly resilient consumer picture but flagged rising input cost pressures. ADP Employment Change for March came in at 62K, comfortably ahead of the 40K consensus, while February retail sales rose 0.6% month over month versus 0.5% expected. Retail sales excluding autos also beat at 0.5% versus 0.3% forecast, reinforcing the view that consumer spending is holding up despite the energy shock. On the manufacturing side, the Institute for Supply Management (ISM) Manufacturing Purchasing Managers Index (PMI) for March edged up to 52.7, just above the 52.5 consensus. However, ISM prices paid surged to 78.3 from 73, a significant beat that highlights the inflationary pass-through from elevated Oil prices. New orders fell to 53.5 from 55.8, suggesting some cooling in demand momentum.
St. Louis Federal Reserve (Fed) President Alberto Musalem struck a hawkish tone, arguing that the current policy rate appropriately balances the Fed's dual mandate and should remain steady for some time. He noted that the real policy rate has already declined given the energy-driven rise in inflation expectations. The CME FedWatch Tool continues to show around a 95% probability of a hold at the April 29-30 Federal Open Market Committee (FOMC) meeting, with rate futures pricing a near coin-flip between zero and one cuts for the full year. Markets are closed on Friday for Good Friday, but the March Nonfarm Payrolls (NFP) report will still be released at 12:30 GMT, with consensus at 60K versus the prior reading of -92K. Initial jobless claims on Thursday and Trump's scheduled national address Wednesday evening are the next key catalysts.
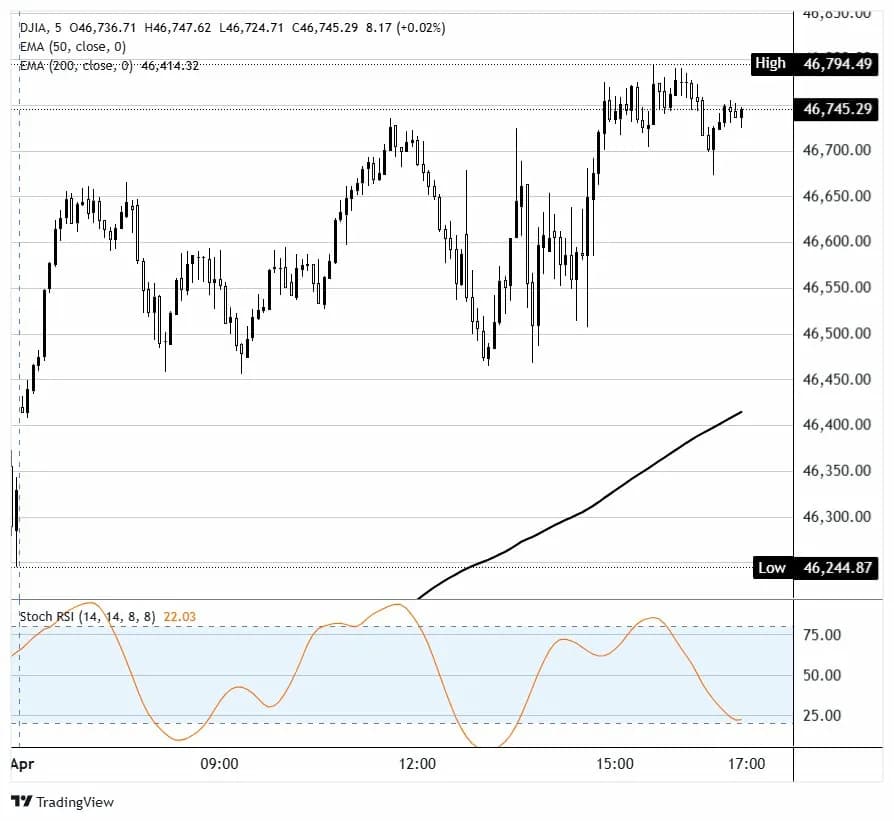
Dow Jones 5-minute chart
Dow Jones FAQs
The Dow Jones Industrial Average, one of the oldest stock market indices in the world, is compiled of the 30 most traded stocks in the US. The index is price-weighted rather than weighted by capitalization. It is calculated by summing the prices of the constituent stocks and dividing them by a factor, currently 0.152. The index was founded by Charles Dow, who also founded the Wall Street Journal. In later years it has been criticized for not being broadly representative enough because it only tracks 30 conglomerates, unlike broader indices such as the S&P 500.
Many different factors drive the Dow Jones Industrial Average (DJIA). The aggregate performance of the component companies revealed in quarterly company earnings reports is the main one. US and global macroeconomic data also contributes as it impacts on investor sentiment. The level of interest rates, set by the Federal Reserve (Fed), also influences the DJIA as it affects the cost of credit, on which many corporations are heavily reliant. Therefore, inflation can be a major driver as well as other metrics which impact the Fed decisions.
Dow Theory is a method for identifying the primary trend of the stock market developed by Charles Dow. A key step is to compare the direction of the Dow Jones Industrial Average (DJIA) and the Dow Jones Transportation Average (DJTA) and only follow trends where both are moving in the same direction. Volume is a confirmatory criteria. The theory uses elements of peak and trough analysis. Dow’s theory posits three trend phases: accumulation, when smart money starts buying or selling; public participation, when the wider public joins in; and distribution, when the smart money exits.
There are a number of ways to trade the DJIA. One is to use ETFs which allow investors to trade the DJIA as a single security, rather than having to buy shares in all 30 constituent companies. A leading example is the SPDR Dow Jones Industrial Average ETF (DIA). DJIA futures contracts enable traders to speculate on the future value of the index and Options provide the right, but not the obligation, to buy or sell the index at a predetermined price in the future. Mutual funds enable investors to buy a share of a diversified portfolio of DJIA stocks thus providing exposure to the overall index.

Plus d’un million d’utilisateurs se tournent vers FXStreet pour des données de marché en temps réel, des outils de graphiques, des analyses d’experts et des actualités Forex. Leur calendrier économique complet et leurs webinaires éducatifs aident les traders à rester informés et à prendre des décisions éclairées. FXStreet s’appuie sur une équipe d’environ 60 professionnels répartis entre le siège de Barcelone et diverses régions du monde.
Lire la suite


