




Ethereum Price Forecast: ETH continues July uptrend with 20% rise after triggering buy signal
Ethereum price today: $1,930
- Ethereum has gained more than 20% since triggering the MVRV Buy Signal.
- On-chain and ETF data show investors favor the top altcoin, but buying remains modest.
- ETH could reclaim the $2,000 level if it clears the 100-day EMA resistance.
Ethereum (ETH) has gained 3% on Tuesday, extending its July gains above 20% after key on-chain indicators highlighted a resumption of buying activity.
The strong performance so far in July comes a few days after ETH triggered the Market Value to Realized Value (MVRV) Buy signal. ETH has been up by roughly 22% since the signal.

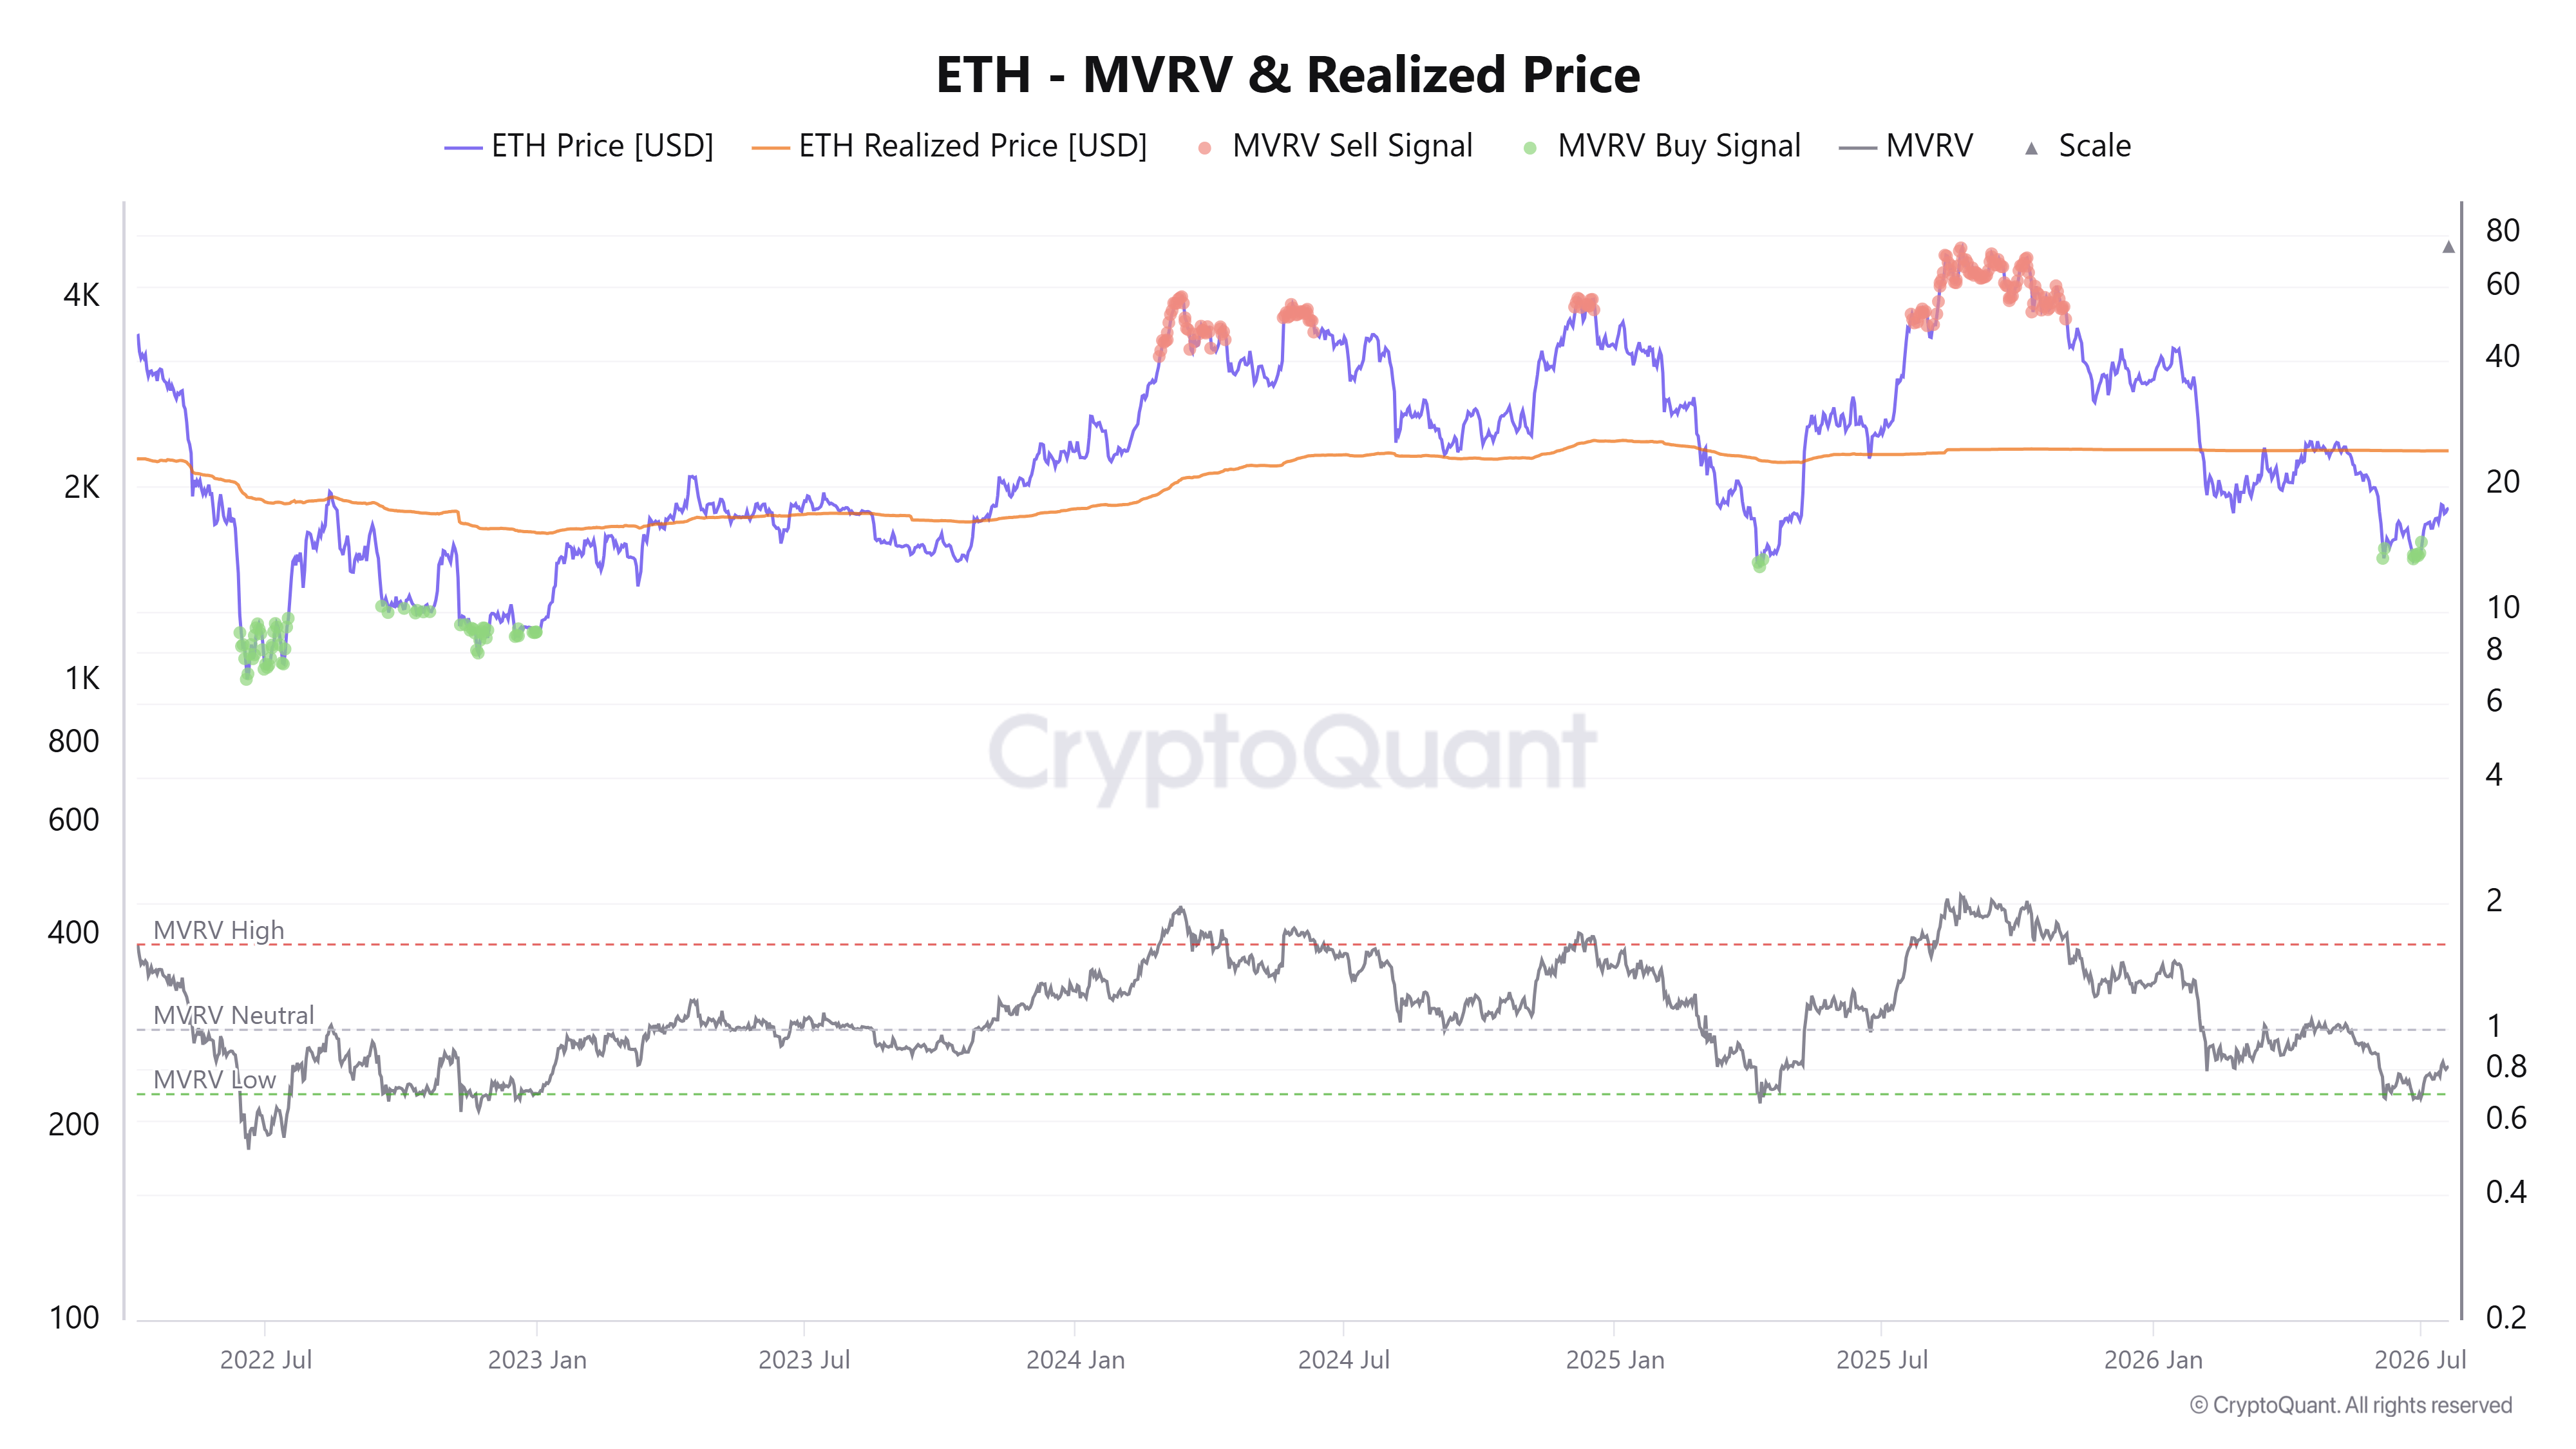
Historically, ETH has rallied by roughly 245% if, after triggering the MVRV Buy Signal, it successfully clears and holds above the realized price (average on-chain investors' cost basis) resistance.
In November 2022 and April 2025, the top altcoin rallied by 270% and 220% in subsequent months before seeing a correction after hitting the MVRV sell signal.
ETH accumulation is improving but not yet intense
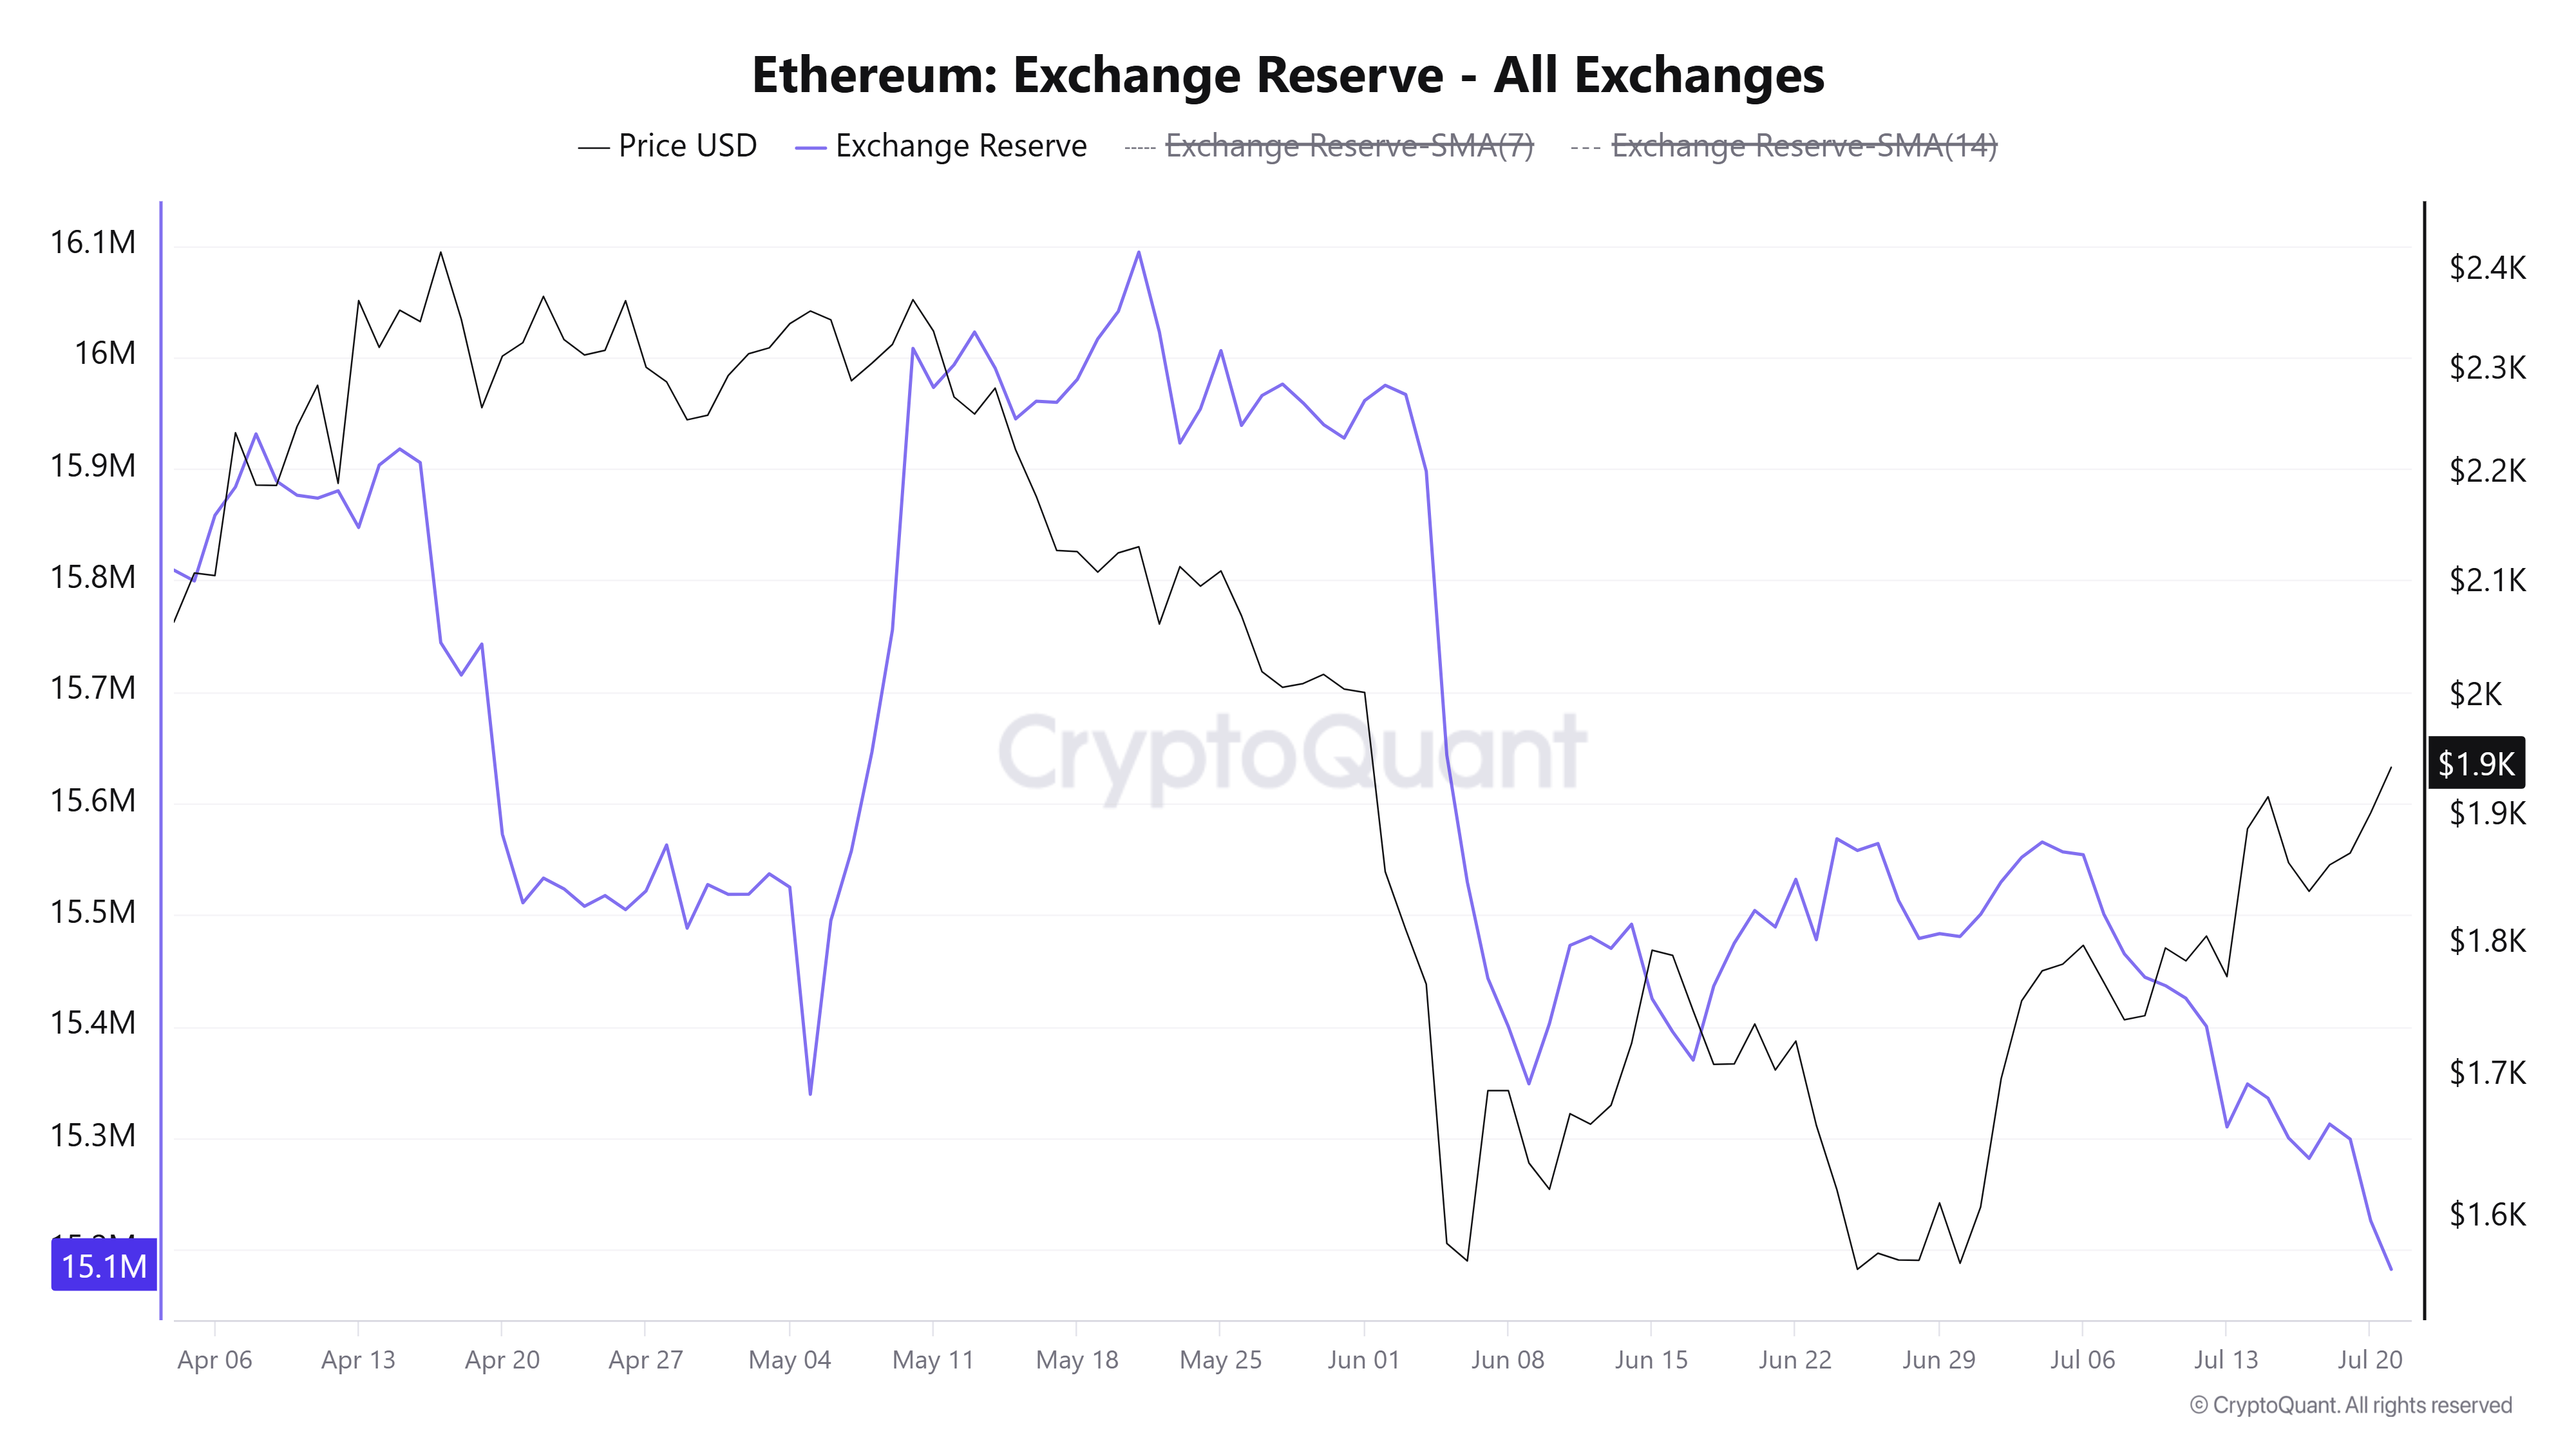
Investors are potentially following the signal as exchange reserves of the top altcoin have dropped by 370K ETH in July. A decline in an asset's exchange reserves shows that investors are moving coins from exchanges to private wallets, reducing available sell-side supply.
Recent data from on-chain analytics tools align with the move as whale wallets have been accumulating and staking ETH over the past few days.
Two new wallets staked their entire holdings after withdrawing 74,033 ETH and 12,800 ETH from Gemini and Binance, respectively, on Monday, according to Arkham data cited by Lookonchain. Wallets linked to BitMEX co-founder Arthur Hayes also bought 1,332.5 ETH, while another wallet acquired 10,501 ETH.
As a result, the total value of staked ETH has continued to rise to new highs, reaching 40.89 million ETH, per data from Validator Queue.
Despite buying activity, changes in wallets across several cohorts indicate that investors have yet to demonstrate conviction.
Wallets with a balance of 10K-100K ETH, who were major buyers during the early stages of the downtrend, have only accumulated a net of 110K ETH since the beginning of the month. This cohort reduced their buying pace after further price declines in February.
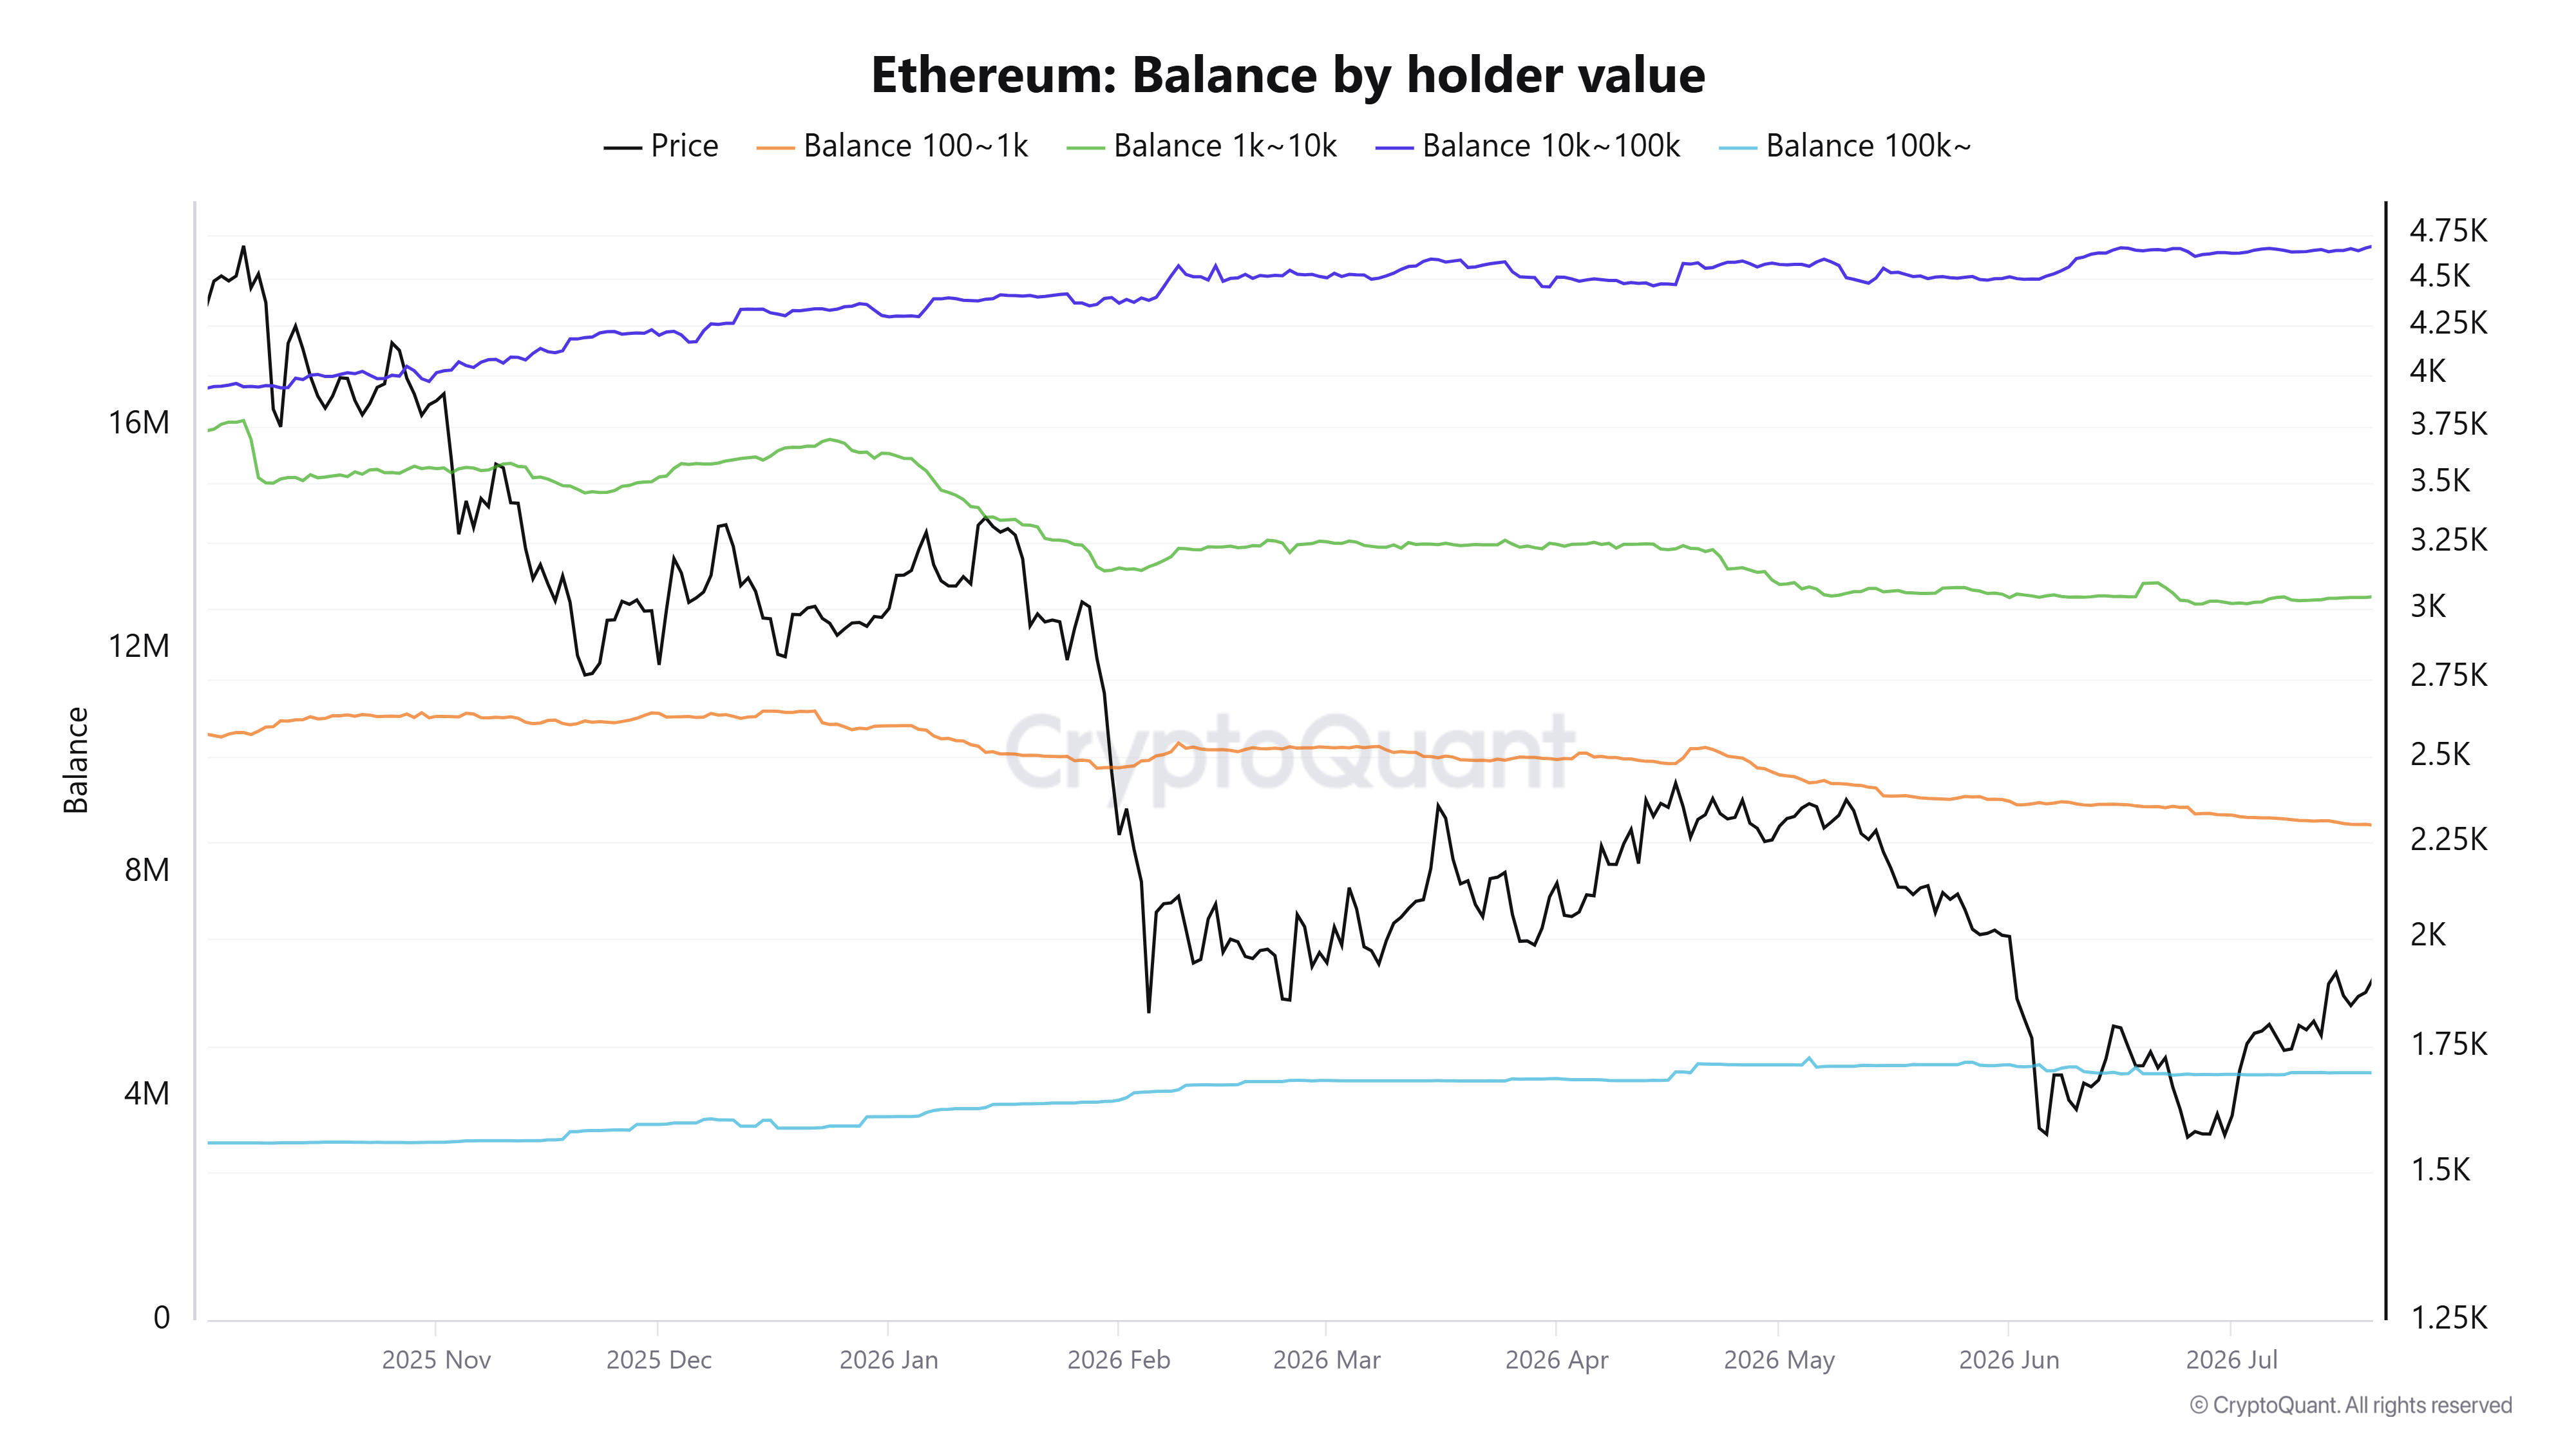
Large-scale retail wallets, with a balance of 1K-10K ETH, are showing signs of a flip from selling toward buying, scooping 100K ETH so far in July. However, wallets with a balance of 100-1K ETH continue to distribute, reducing their holdings by 190K ETH in the same period.
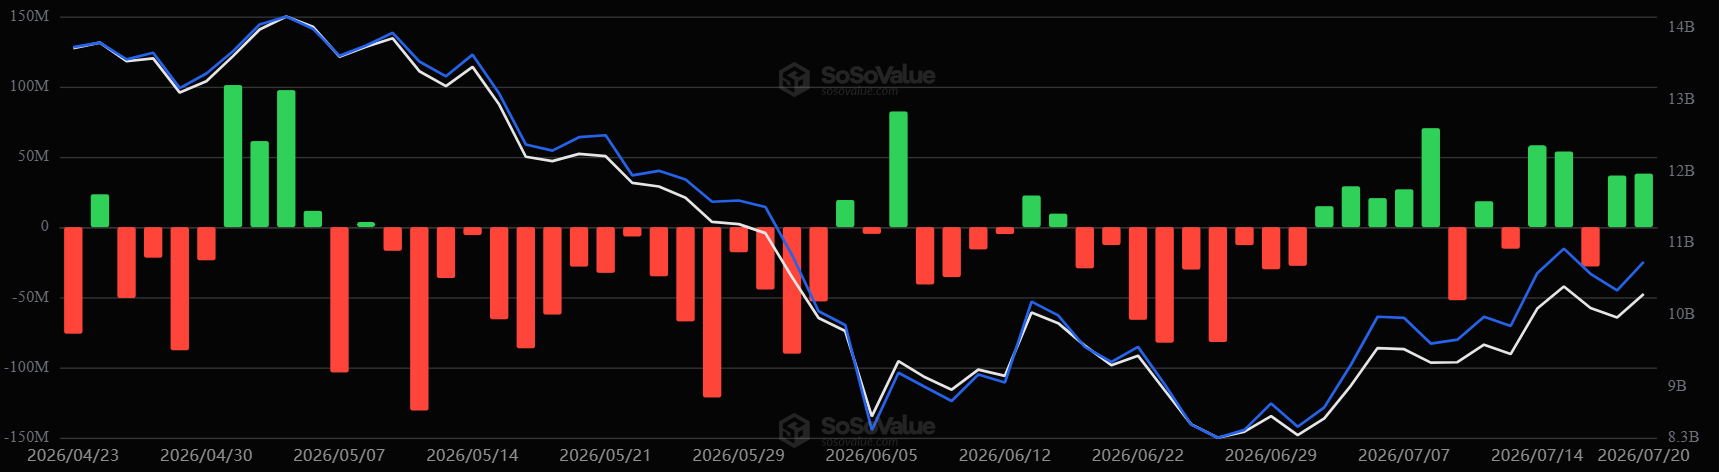
On the institutional side, interest continues to improve as US spot ETH exchange-traded funds (ETFs) saw $38.09 million in net inflows on Monday, a second consecutive trading day of net buying. The products have only seen three days of outflows so far in July, compared to 15 and 17 outflow days in May and June, respectively.
Ethereum price forecast: ETH could reclaim $2,000 if it clears the 100-day EMA
On the daily chart, ETH is testing the 100-day Exponential Moving Average (EMA) at $1,939, which caps the topside and keeps the near-term tone broadly neutral. The Relative Strength Index (RSI) near 65 and the Stochastic Oscillator (Stoch) above 90 hint at strong but potentially overextended bullish momentum as price tests this immediate EMA barrier.
On the topside, initial resistance is defined by the 100-day EMA, which hampered the rally last week. Above the EMA is a cluster of horizontal levels at $2,018 and $2,107, ahead of a thicker band at $2,211 and $2,388. Higher up, $2,746 and $3,411 remain distant medium-term caps.
On the downside, first support emerges at $1,909, with further demand seen at $1,806 and $1,741. Below these, deeper floors sit at $1,524 and $1,404, ahead of a major base near $1,155.
(The technical analysis of this story was written with the help of an AI tool. Know more.)













