
Ethereum Price Forecast: ETH is seeing capital outflows despite record network growth
Par Michael Ebiekutan
Date de publication: 12 Mar 2026 | Date de modification: 12 Mar 2026


ARTICLES POPULAIRES

Ethereum (ETH) network activity has been clocking new milestones over the past few months, with active addresses, smart contract calls, and transaction counts surging to new highs.
Ethereum price today: $2,020
- Ethereum network activity has surged to record highs despite a 50% price slide.
- Capital flows have been a major factor in ETH's price direction during the current market cycle.
- ETH has to hold above the 20-day EMA to maintain a cautious bullish outlook.
Ethereum (ETH) network activity has been clocking new milestones over the past few months, with active addresses, smart contract calls, and transaction counts surging to new highs.
Daily active addresses on Ethereum expanded to a record high of around 2 million in February, doubling its peak from the 2021 bull market, according to CryptoQuant in a Tuesday report.
Similarly, transfers triggered by internal smart contract calls and total contract calls also surged to new highs, far above 2021 and 2018 bull-market levels, with the latter surpassing 40 million calls daily.
Despite the strong growth observed across key network metrics, the top altcoin has erased more than 50% of its value over the past four months.
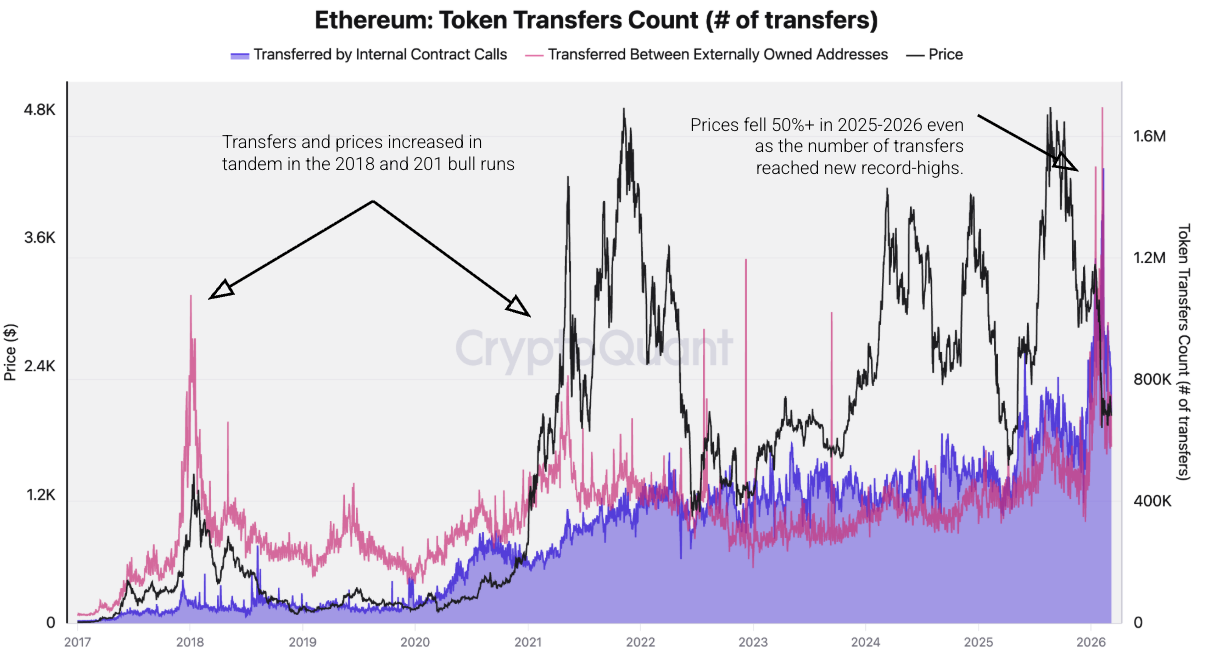
Historically, rising smart contract activity and active addresses have often coincided with price rallies in ETH, suggesting a strong relationship between the two. However, the simultaneous price crash shows a growing divergence, the report states.
"The weakening relationship suggests that Ethereum's application-layer growth is no longer translating directly into higher ETH valuations," wrote CryptoQuant analysts.
Instead, capital flows have been a major factor shaping ETH's price in the current market cycle.
The report highlighted that ETH has experienced larger inflows into exchanges than Bitcoin (BTC), indicating greater selling pressure on the top altcoin. Such a move has historically aligned with the development of price tops.
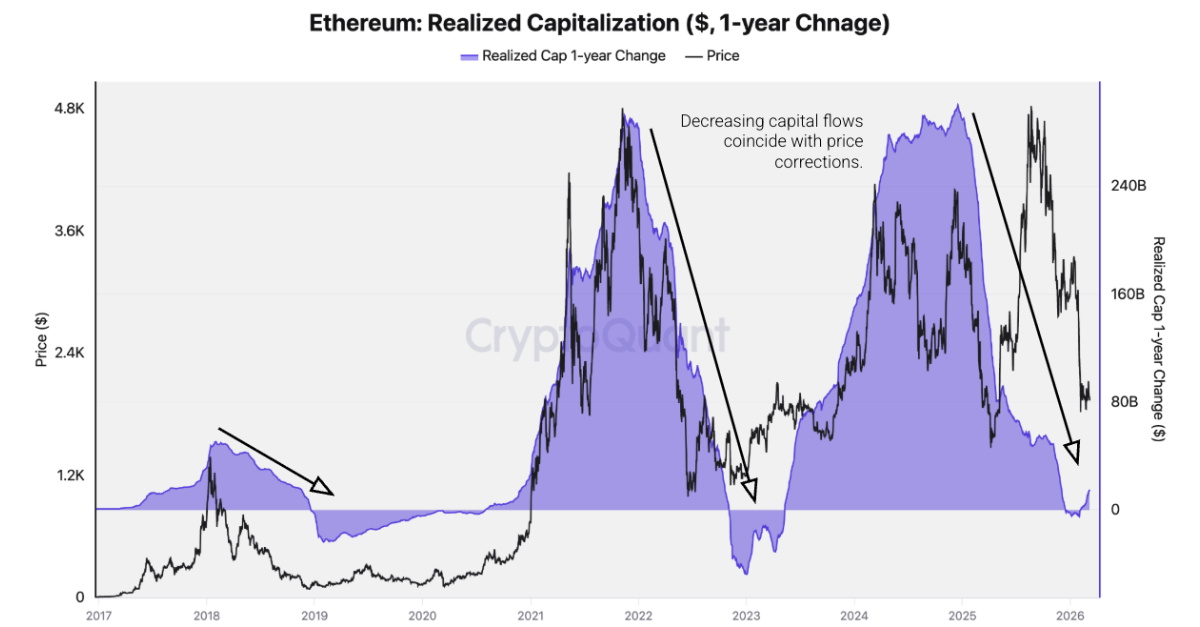
Additionally, the 1-year change in Ethereum's realized capitalization, which measures net capital inflows and outflows, has turned negative. The move indicates that money is flowing out of ETH amid record network activity.
"In previous cycles, particularly during 2017-2018 and 2021, strong increases in realized capitalization coincided with major ETH price rallies, reflecting large inflows of new capital into the network. Conversely, when realized capitalization growth turned negative, such as during 2019 and the 2022-2023 bear market, ETH prices declined sharply," the report states.
Ethereum Price Forecast: ETH has to hold 20-day EMA
Ethereum saw $43.3 million in liquidations over the past 24 hours, led by $24.6 million in short liquidations, per Coinglass.
In the daily chart, ETH trades at $2,055. The near-term bias is neutral with a mild bullish tilt as price holds above the 20-day Exponential Moving Average (EMA), which has flattened near $2,024 and now underpins the latest rebound. The 50-day EMA around $2,219 trends well above spot, framing the broader structure as a recovery within a medium-term down phase.
The Relative Strength Index (RSI) has stabilized just below 50, and the Stochastic Oscillator (Stoch) hovers in mid-range, signaling moderating downside momentum rather than strong trend conviction. At the same time, recent volumes show no capitulation selling.
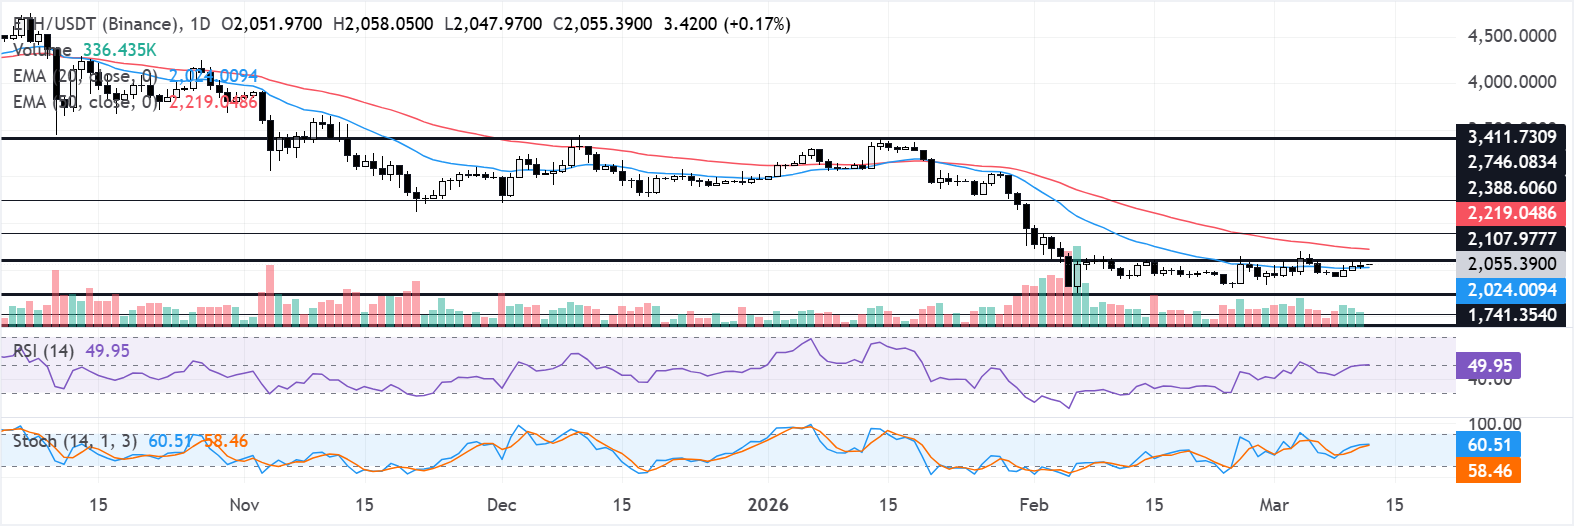
Immediate resistance emerges at the horizontal barrier near $2,108, where a daily close above would open the way toward $2,389 as the next upside objective, followed by $2,746 on extension. On the downside, initial support stands at $1,741, with a break there exposing deeper chart support at $1,524 and then $1,405.
As long as ETH defends the 20-day EMA above these support levels, dip-buying interest would remain favored over aggressive selling into weakness.
(The technical analysis of this story was written with the help of an AI tool.)

Plus d’un million d’utilisateurs se tournent vers FXStreet pour des données de marché en temps réel, des outils de graphiques, des analyses d’experts et des actualités Forex. Leur calendrier économique complet et leurs webinaires éducatifs aident les traders à rester informés et à prendre des décisions éclairées. FXStreet s’appuie sur une équipe d’environ 60 professionnels répartis entre le siège de Barcelone et diverses régions du monde.
Lire la suite


