
Ethereum Price Forecast: ETH sees strong spot demand but faces downside pressure in futures
Par Michael Ebiekutan
Mis à jour: 21 Apr 2026


ARTICLES POPULAIRES

Following the crypto market recovery over the past week, several Ethereum (ETH) onchain metrics are demonstrating notable changes.
Ethereum price today: $2,310
- Ethereum whales accumulated roughly 700K ETH between Thursday and Monday amid ETH ETFs' eight-day inflow streak.
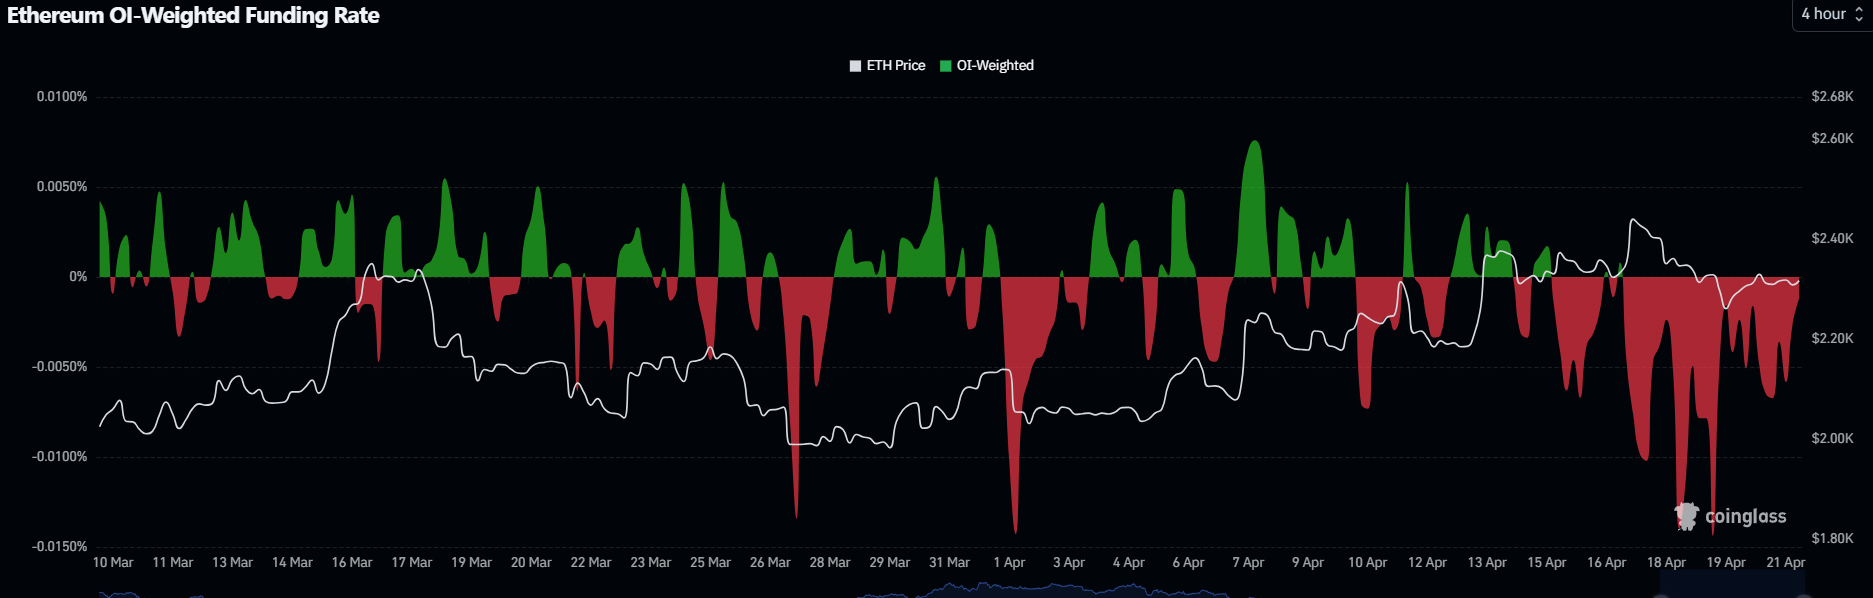
- Ethereum's funding rates have largely remained in negative territory over the past six days.
- ETH is eyeing the convergence of the 100-period EMA and a key trendline support.
Following the crypto market recovery over the past week, several Ethereum (ETH) onchain metrics are demonstrating notable changes.
With Iran's announcement to reopen the Strait of Hormuz, lifting risk sentiment, whales pounced on ETH. Wallets with a balance >10K ETH, also known as whales, accumulated nearly 700K ETH between Thursday and Monday, according to CryptoQuant data. Part of that figure stems from Ethereum treasury firm BitMine Immersion Technologies (BMNR), which acquired over 101K ETH last week.
Smart money tracker Lookonchain also observed several whale buying activities over the past week. Notably, a newly created wallet withdrew 35K ETH from crypto exchange Binance in the early American session on Tuesday and transferred it to digital asset custodian BitGo.
Meanwhile, retailers or investors holding 100-10K ETH largely held steady, adding minimal amounts to their holdings over the past week, a contrast with their behavior since early March, when they resumed distribution.
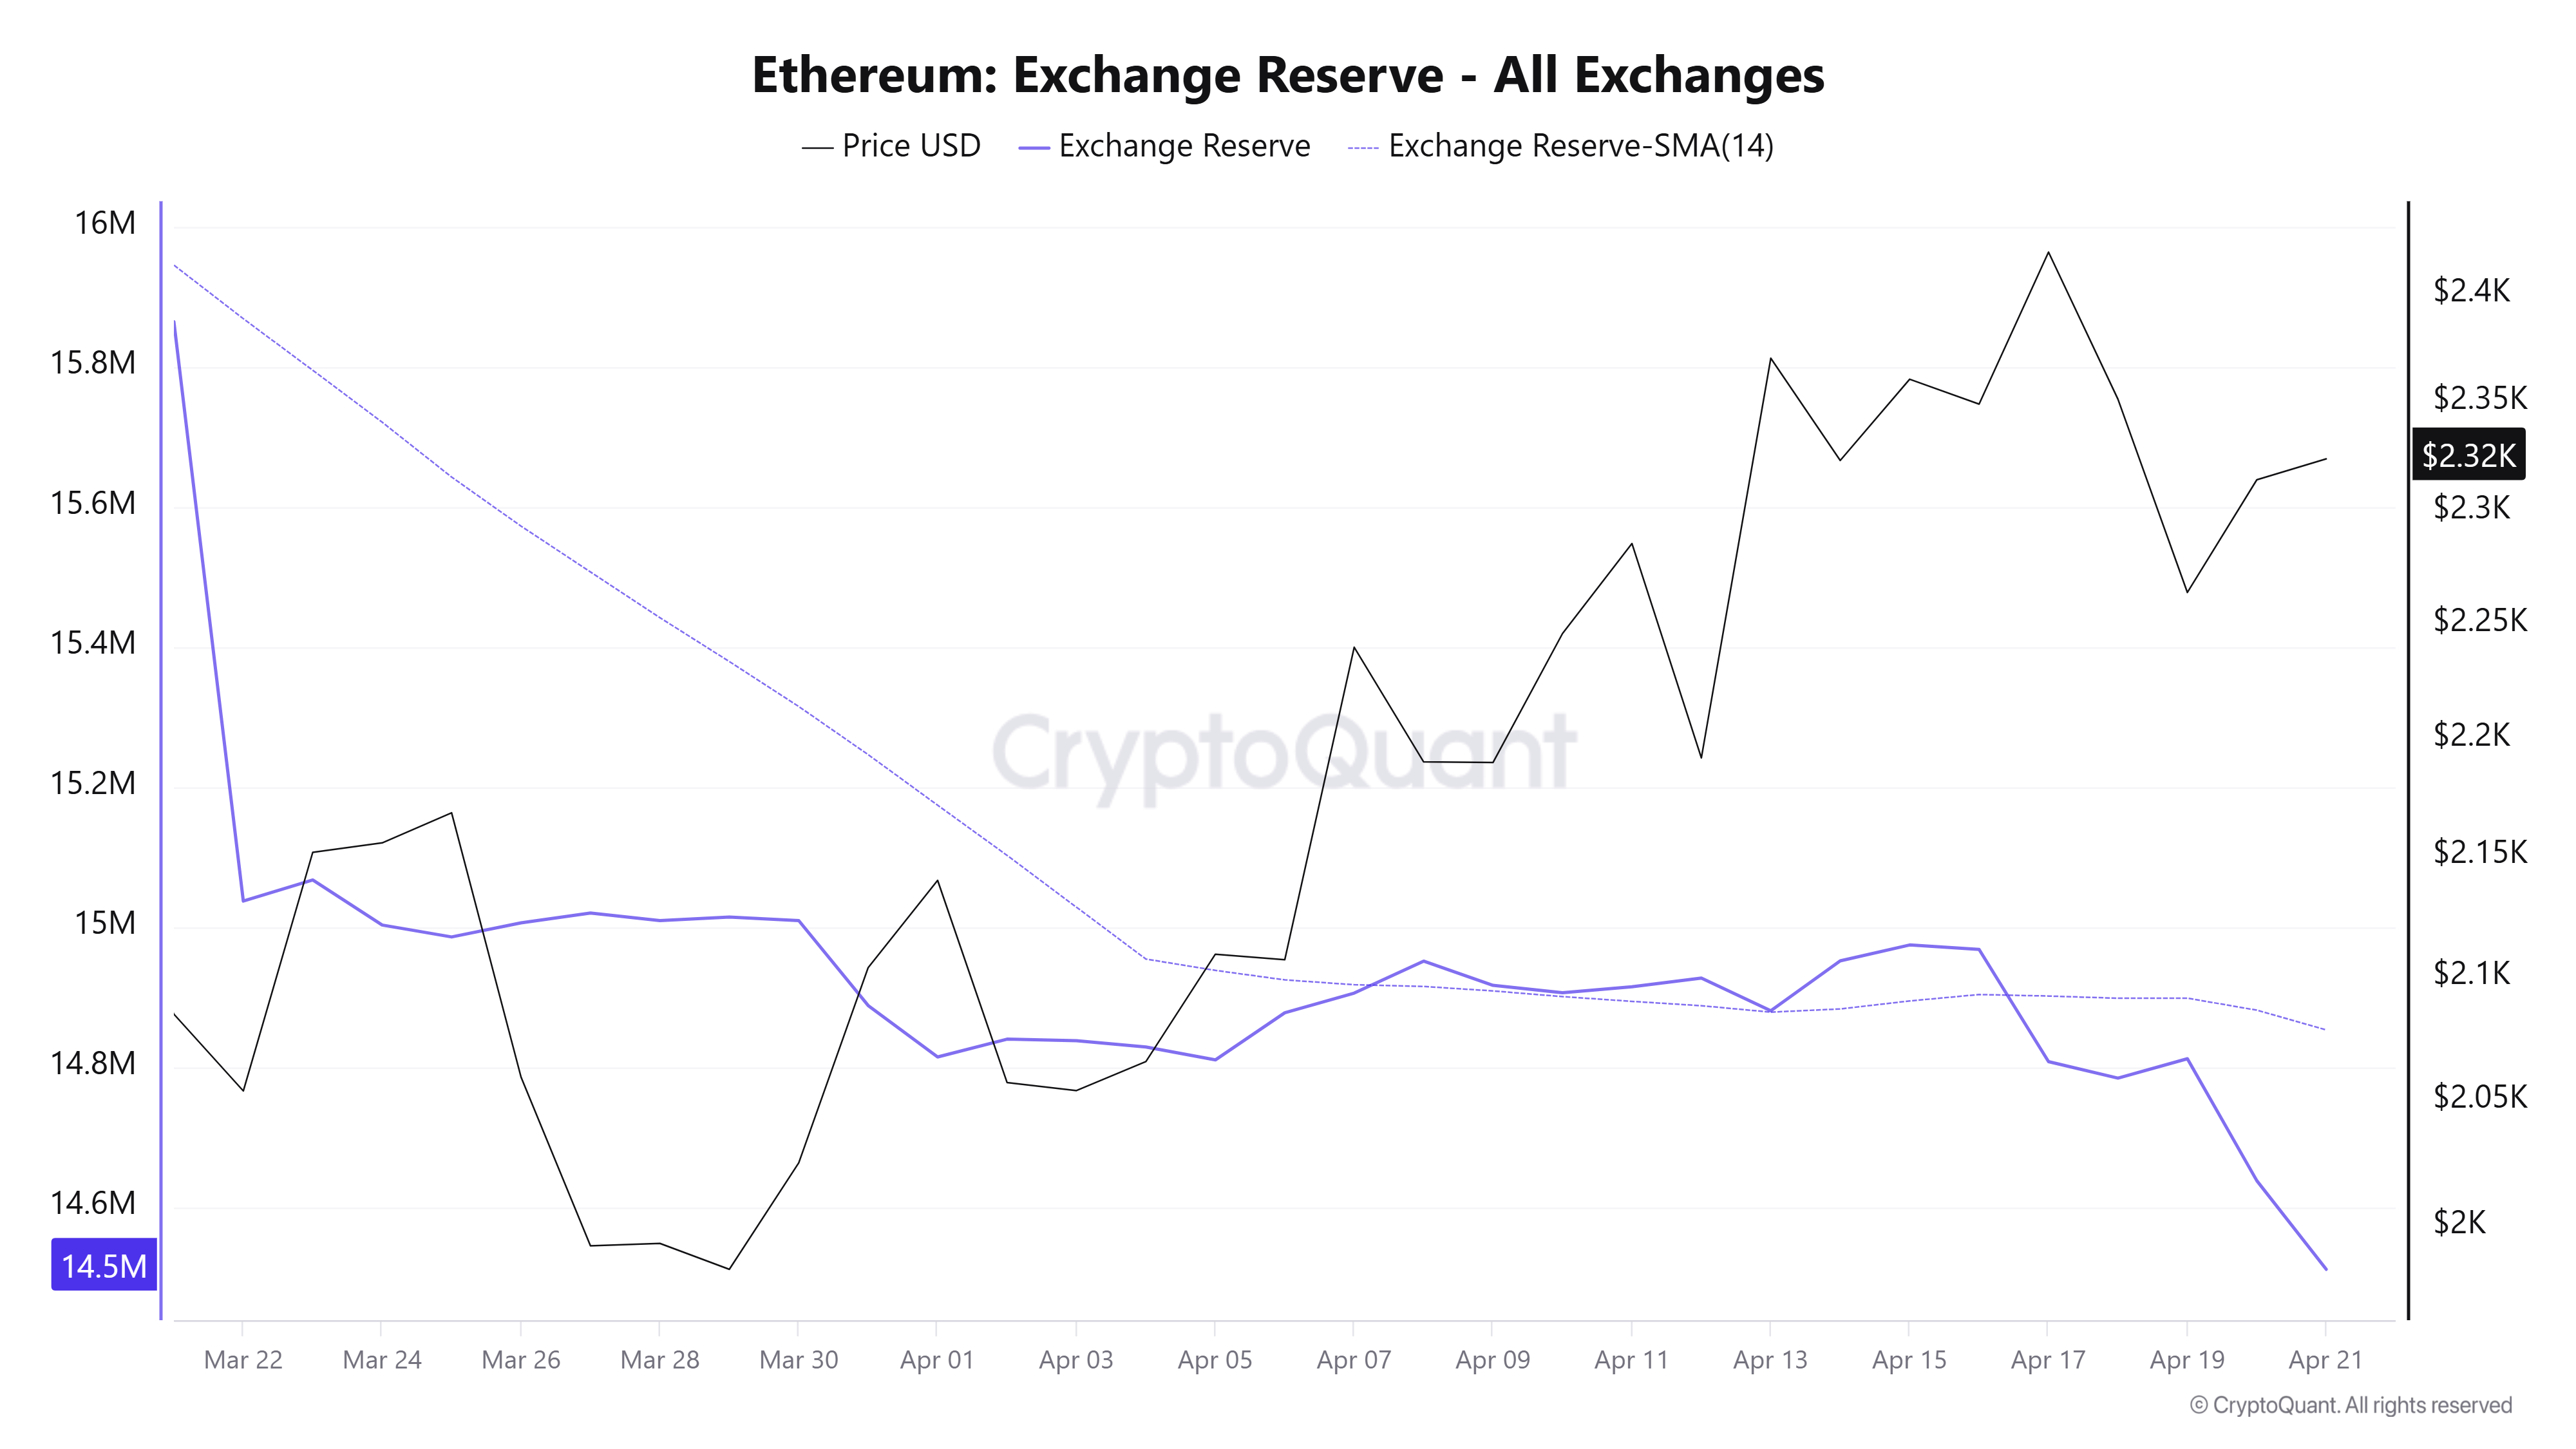
The positive sentiment is also evident in Ethereum exchange reserves, which have fallen by roughly 458K ETH since Thursday, indicating increasing buying pressure.
Institutional and traditional investors also continued to show a return of risk appetite for the top altcoin, with ETH exchange-traded funds (ETFs) recording eight consecutive days of net inflows totaling $493.7 million, according to SoSoValue data.
While spot-side buying is strong, ETH faces strong downside pressure in the futures market, as evidenced by dominant negative funding rates over the past six days. The move has pushed ETH back below $2,400, toward the $2,308 realized price or onchain average cost basis of investors.
Ethereum Price Forecast: ETH eyes dynamic 100-period EMA and trendline support
Ethereum saw $53.4 million in liquidations over the past 24 hours, led by $28.4 million in long liquidations.
On the four-hour chart, ETH is holding a constructive bullish bias, as price sits above the 20-, 50-, and 100-period Exponential Moving Averages (EMAs), which are clustered between roughly $2,323 and $2,268. This stack of EMAs offers layered dynamic support, suggesting dips may continue to attract buyers. At the same time, momentum conditions remain broadly supportive, with the Relative Strength Index (RSI) hovering just above the neutral 50 mark and the Stochastic Oscillator (Stoch) edging into overbought territory, hinting that upside may slow rather than reverse outright.
On the topside, initial resistance emerges at the horizontal barrier near $2,388, ahead of a more distant cap at $2,746. On the downside, the short-term 100-period EMA reinforces immediate support at $2,267 and the prior trendline reference around $2,263. A deeper slide would expose the broader structural floors at $2,211, $2,107 and $1,909.
(The technical analysis of this story was written with the help of an AI tool.)

Plus d’un million d’utilisateurs se tournent vers FXStreet pour des données de marché en temps réel, des outils de graphiques, des analyses d’experts et des actualités Forex. Leur calendrier économique complet et leurs webinaires éducatifs aident les traders à rester informés et à prendre des décisions éclairées. FXStreet s’appuie sur une équipe d’environ 60 professionnels répartis entre le siège de Barcelone et diverses régions du monde.
Lire la suite


