
Ethereum Price Forecast: Whales resume accumulation, but derivatives interest weakens
Ethereum price today: $2,240
- Whales scooped 230K ETH in the past week, while retailers held steady.
- Derivatives exposure grew in March but has slowed on a weekly basis.
- ETH eyes the $2,388 resistance after climbing above the 50-day EMA.
Whales or wallets holding 10K-100K ETH returned to accumulation over the past week after a brief distribution the previous week. The cohort saw a 230K ETH increase in their cumulative balance.
Meanwhile, retailers or wallets holding 100-1K and 1K-10K ETH held steady, maintaining a similar balance as the prior week. Over the past two weeks, investors within this bracket have failed to record major declines in their collective holdings, a stark contrast to their behavior in January and February.

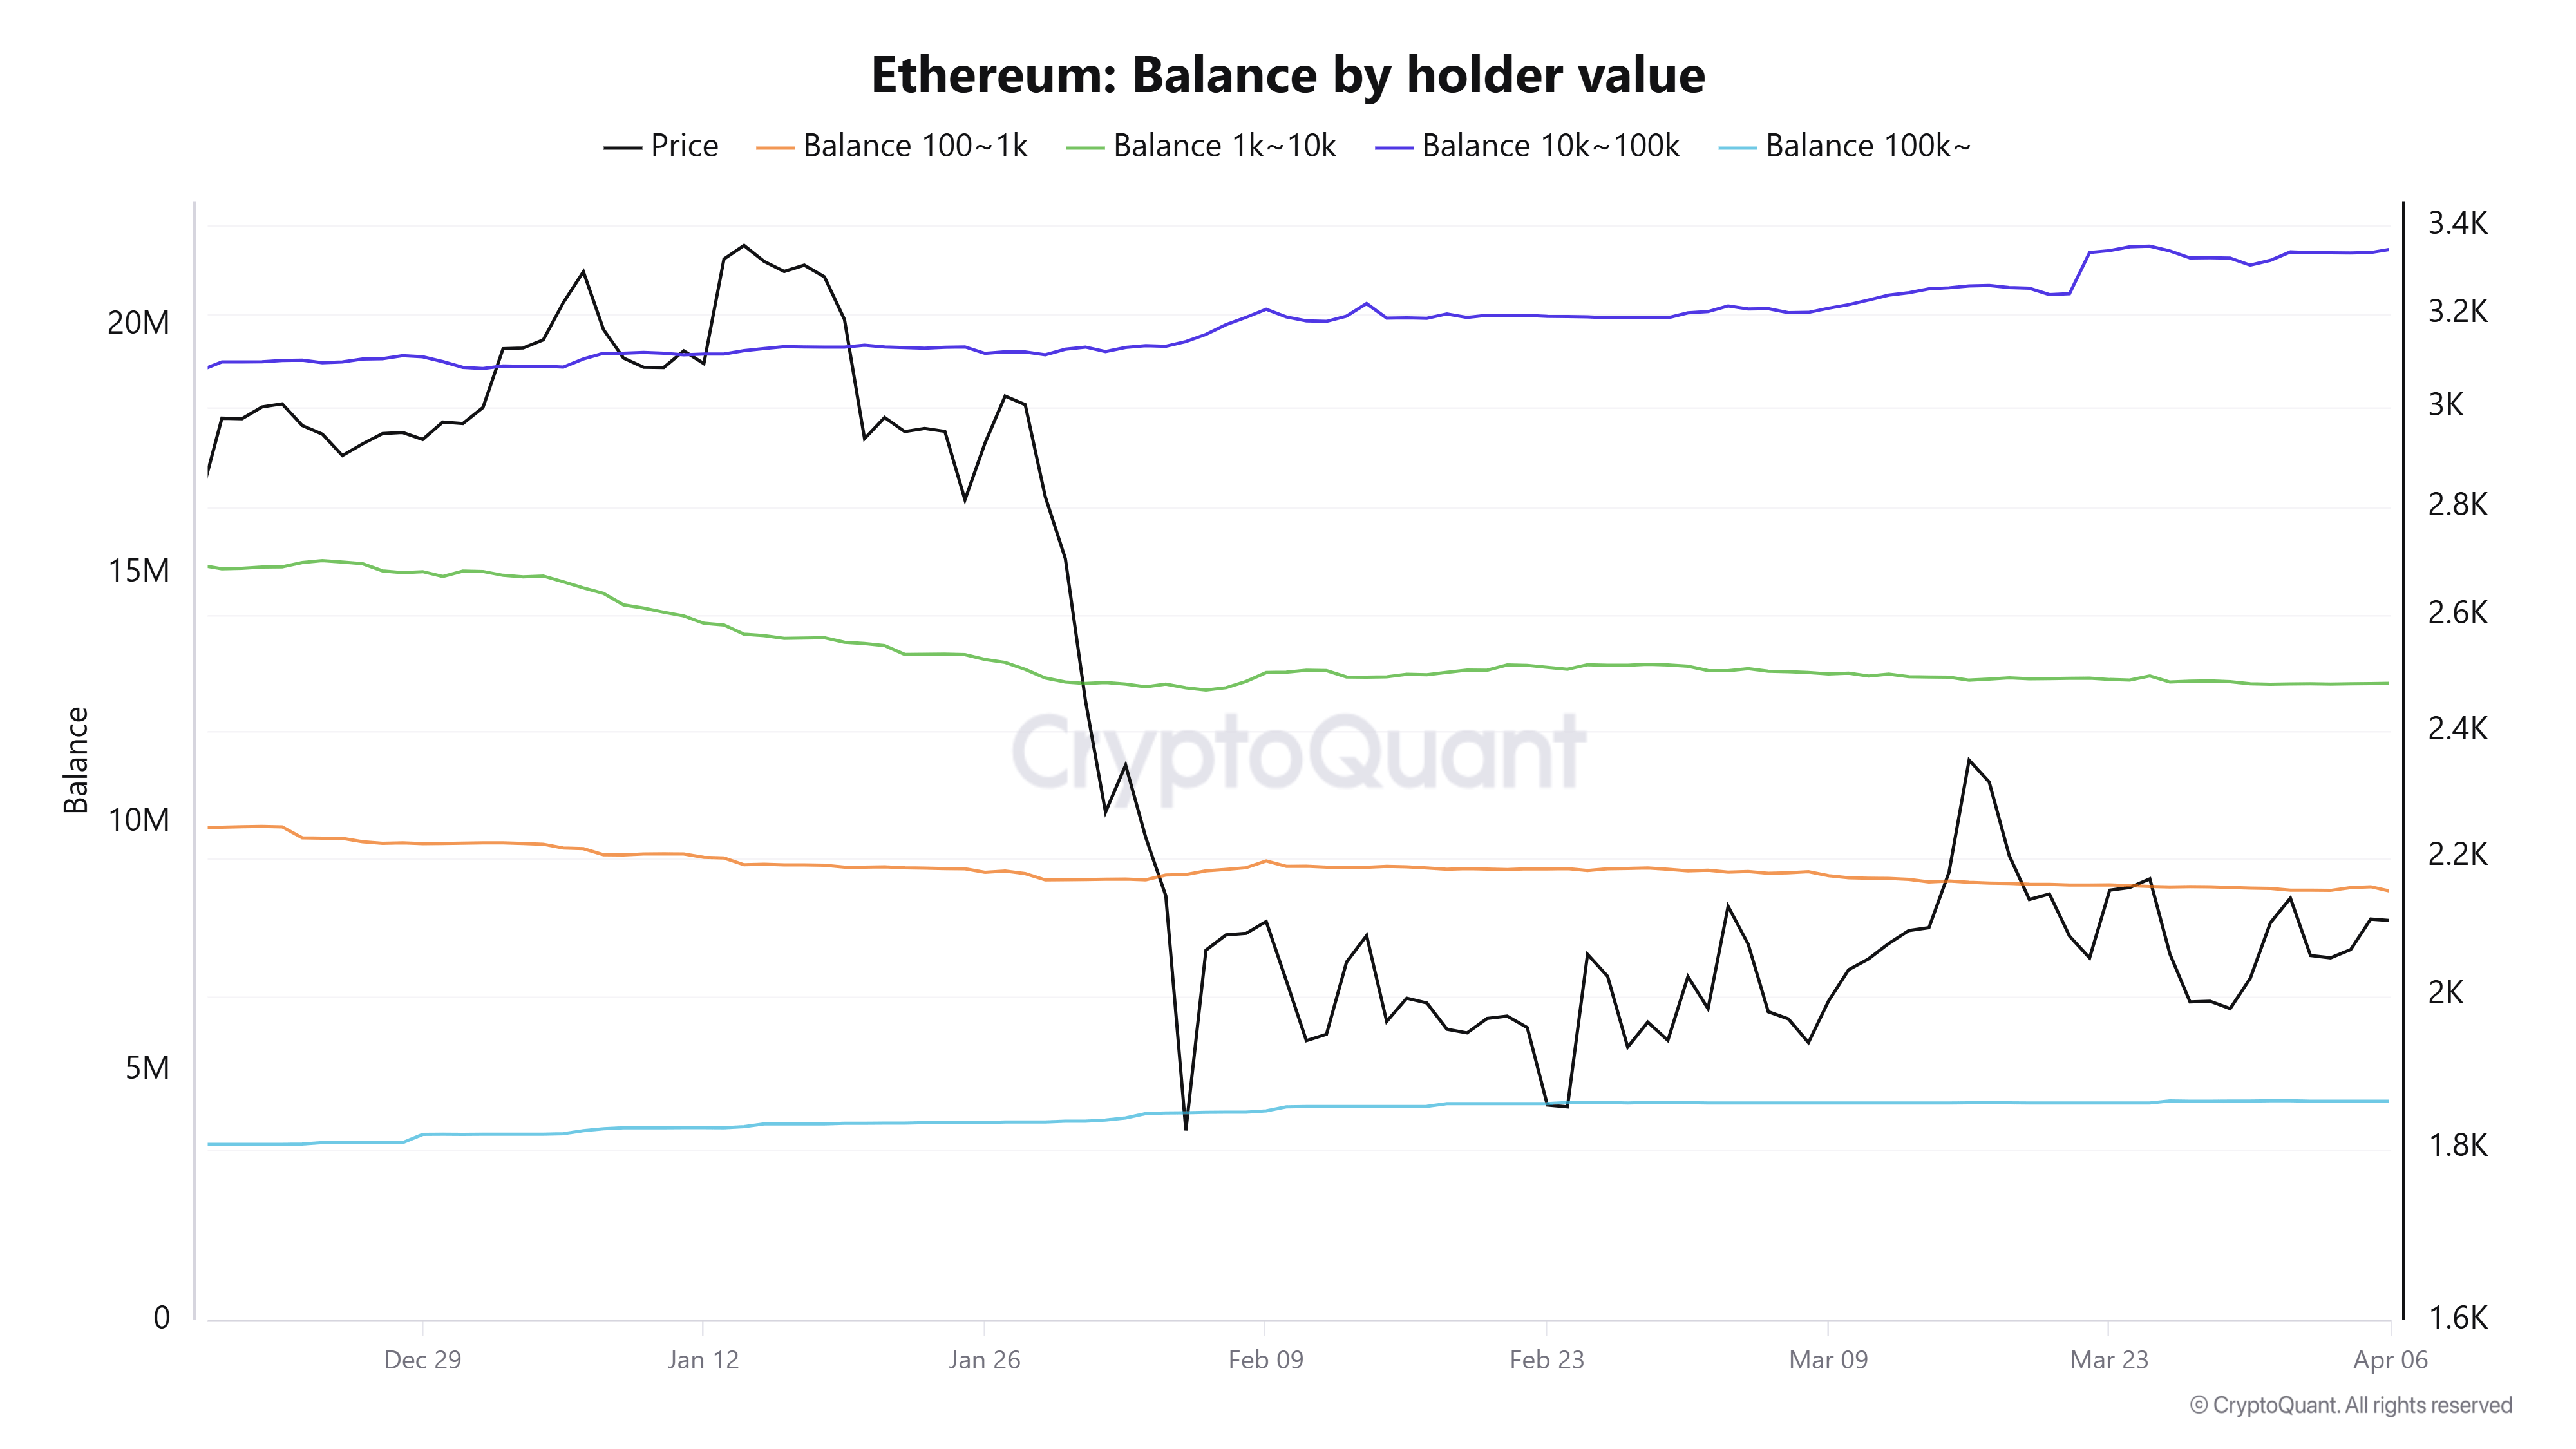
A continuation of reduced supply-side pressure from retail investors and steady whale accumulation could strengthen ETH's outlook on the spot market.
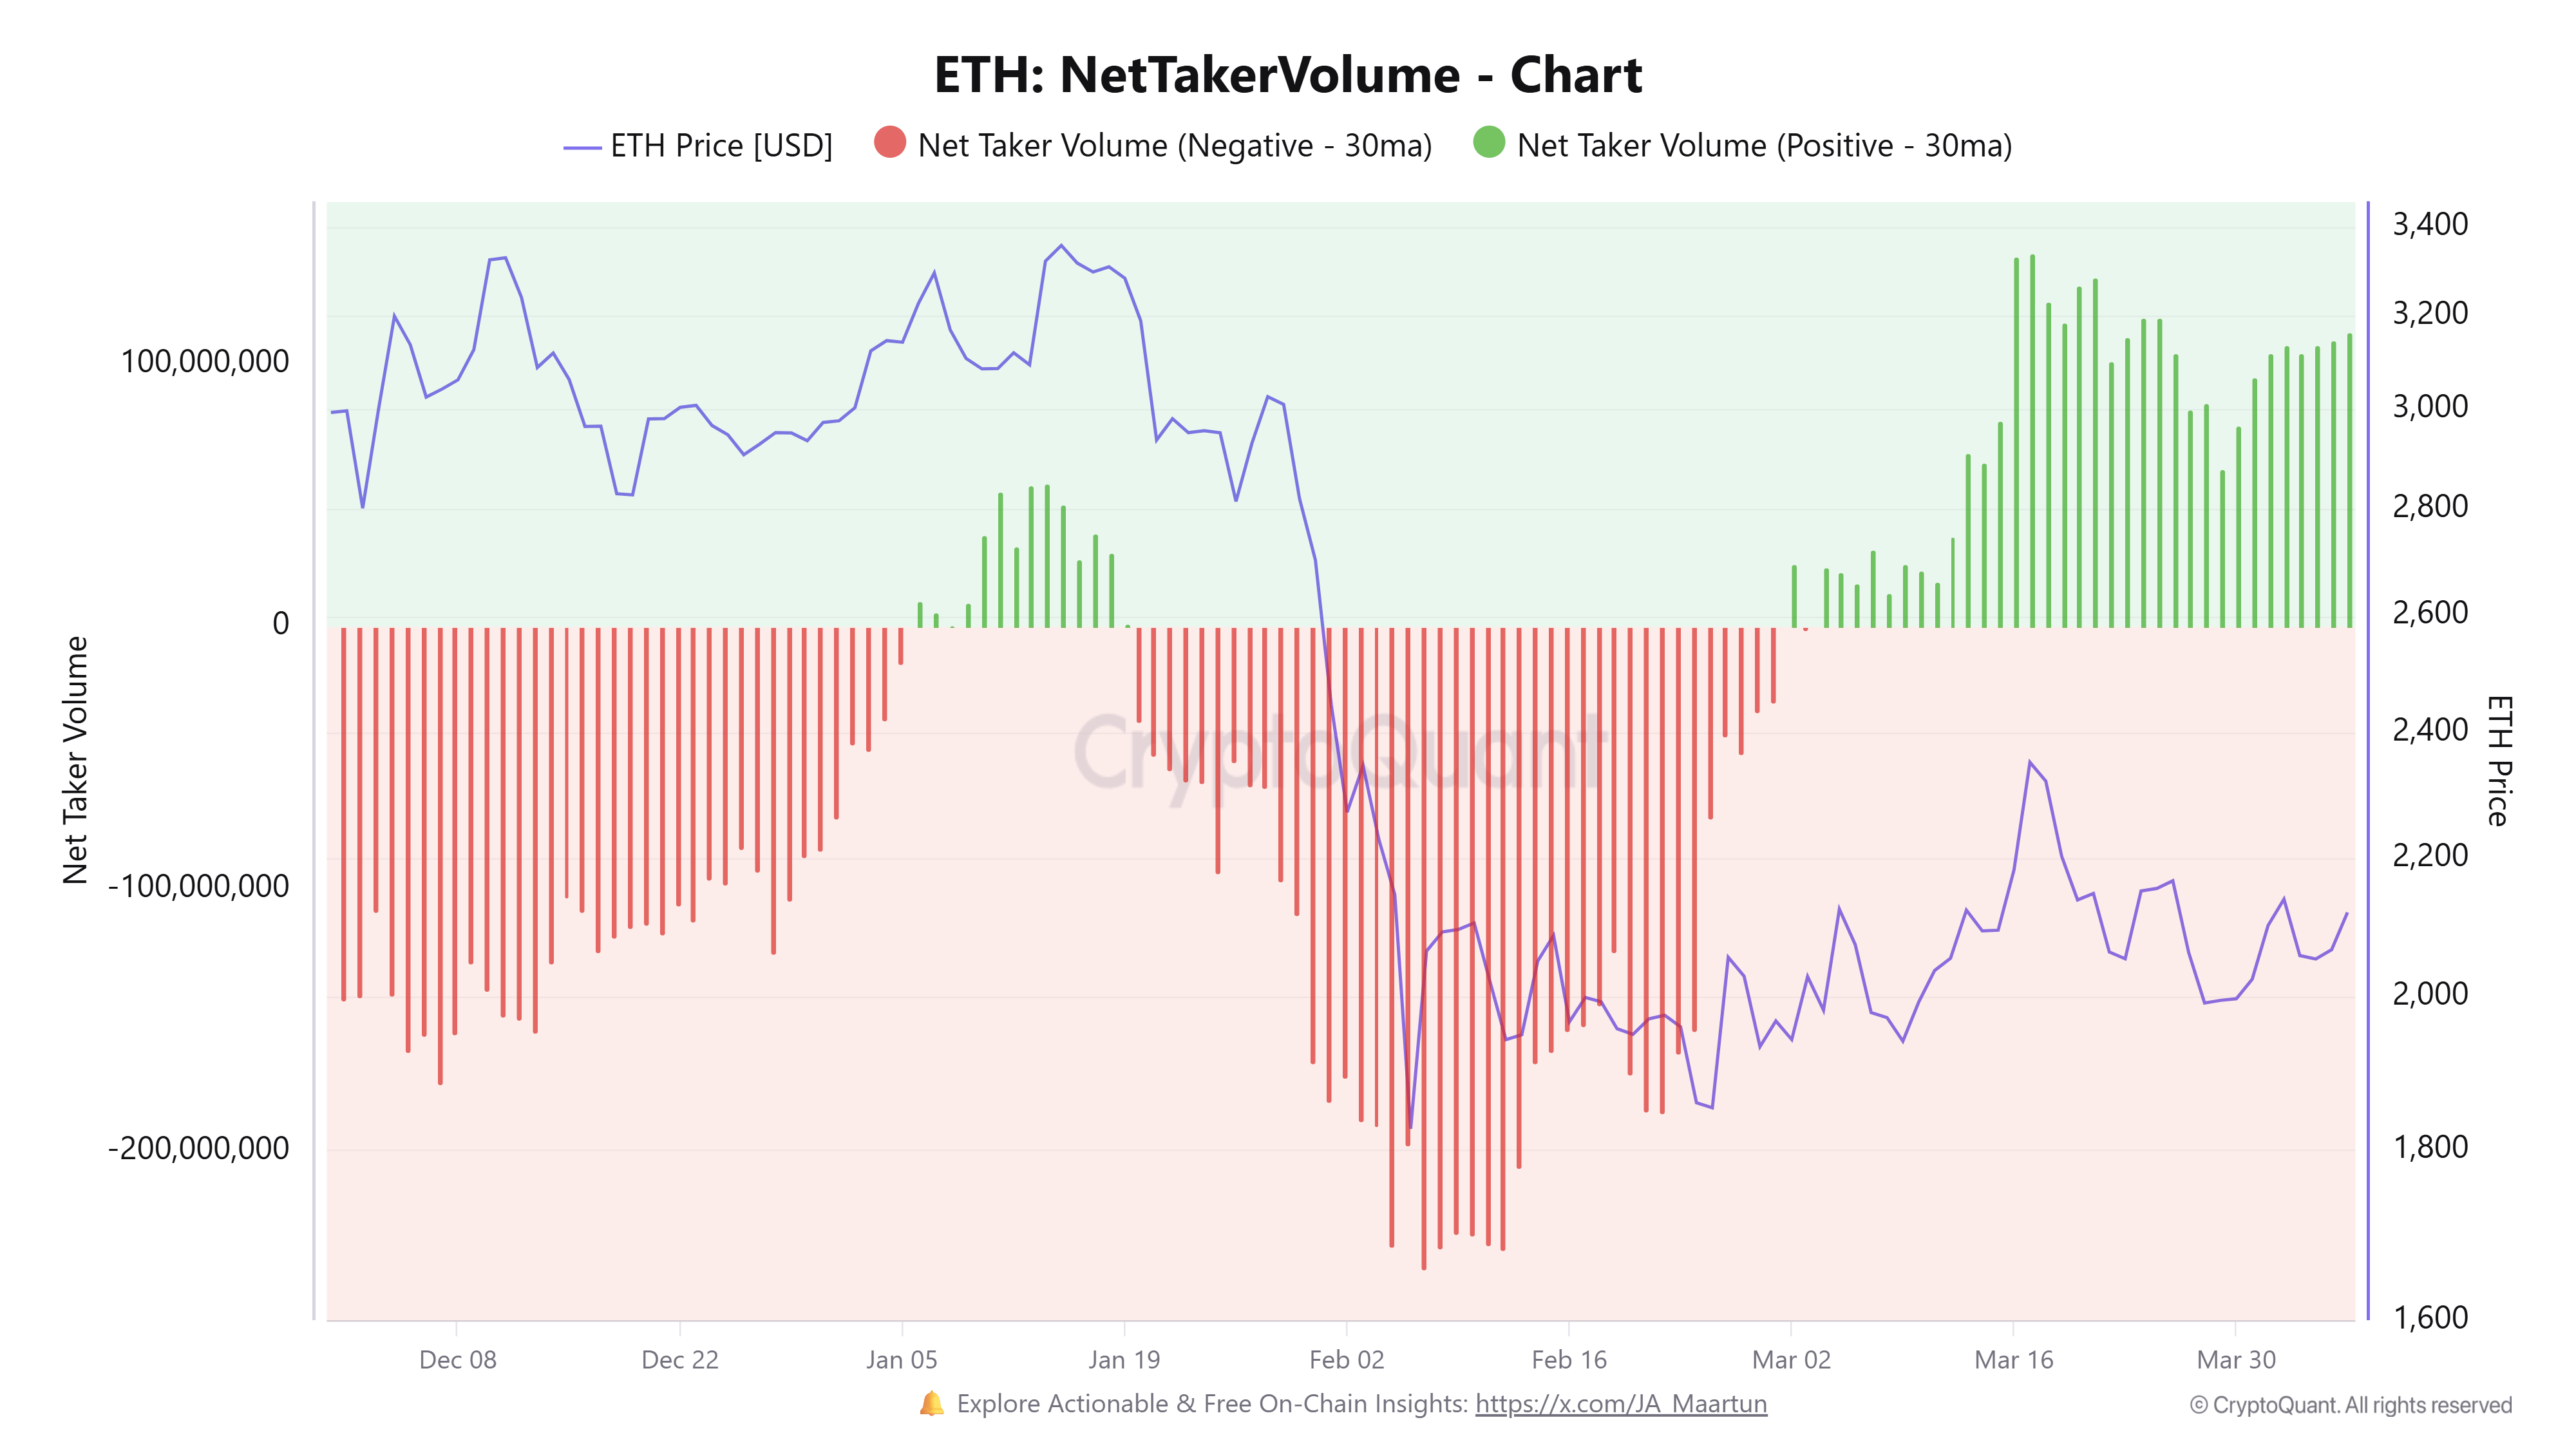
On the derivatives side, Ethereum's Net Taker Volume has maintained a positive tilt since early March amid range-bound prices.
Net Taker Volume measures the difference in trading volume between buyers and sellers who purchase ETH futures contracts with market orders. The consistent positive values indicate traders are slightly leaning bullish.
Meanwhile, the Estimated Leverage Ratio (ELR), which measures the leverage used by traders, spiked over the past month. The metric has risen from roughly 0.70 in February to 0.93 on Monday despite prices remaining flat during the period.
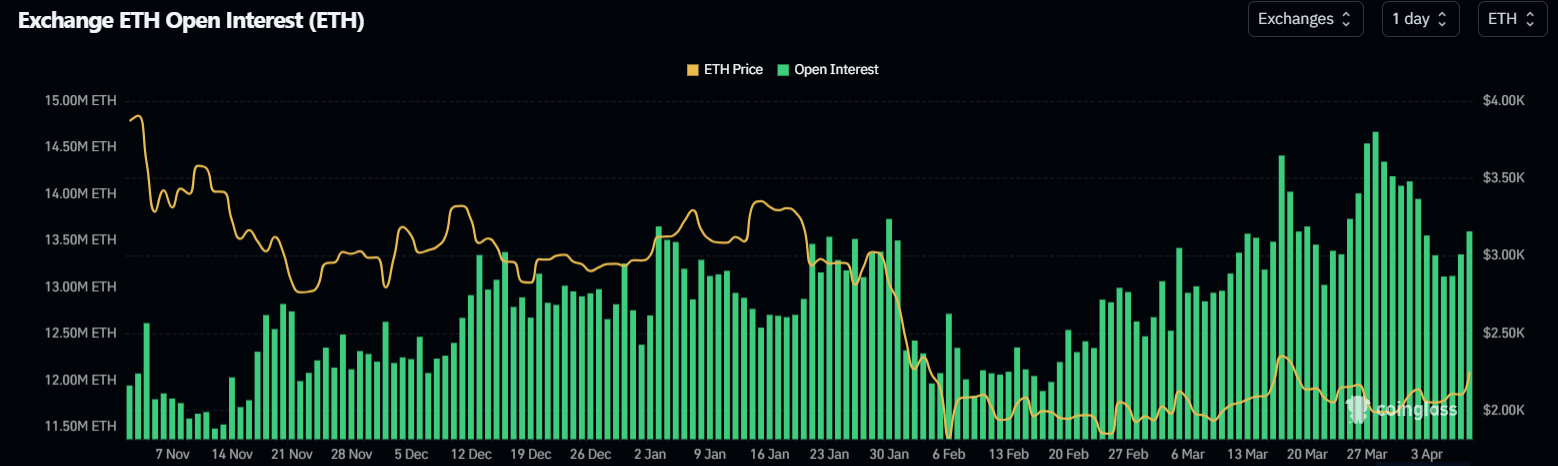
While derivatives exposure has expanded over the past month, it declined last week. Ethereum's open interest, the total value of unsettled contracts in a derivatives market, has dropped from 14.67 million ETH on March 28 to 13.6 million ETH on Tuesday.
Ethereum Price Forecast: ETH eyes $2,388 resistance after jump above 50-day EMA
Ethereum saw $114.6 million in futures liquidations over the past 24 hours, driven by $90.6 million in liquidated short positions, according to Coinglass data.
In the daily chart, ETH trades at $2,240. The top altcoin sits just above the 20-day Exponential Moving Average (EMA) near $2,090, while the 50-day EMA around $2,145 flattens, pointing to a mildly bullish bias within a broader corrective context below the distant 100-day EMA.
Momentum improves as the Relative Strength Index (RSI) moves back above 50 and the Stochastic pushes into higher ground, indicating recovering upside pressure. The rebound from last week's lows keeps short-term buyers engaged, but the lack of a clean break above the 50-day EMA caps conviction for a stronger trend extension.
Immediate resistance stands at the $2,388 zone, where a horizontal cap aligns with the recent reaction high. A rise above would give way for a move toward $2,746. On the downside, first support is seen at $2,108, just below the 20-day EMA, with a break below exposing $1,911, and then $1,741 as a lower downside level.
As long as price holds above $2,108, the near-term bias favors renewed tests of $2,388. A daily close below $2,108 would shift focus back toward the lower supports and undermine the emerging bullish tone.
(The technical analysis of this story was written with the help of an AI tool.)


