




Ethereum Weekly Price Forecast: Onchain data paints bearish picture
- Investors are selling into the market weakness, booking $667 million in losses over the past three days.
- US institutional derisking continues with 14 consecutive days of net outflows in US spot ETH ETFs.
- ETH has recovered the $2,000 level, but momentum remains weak.
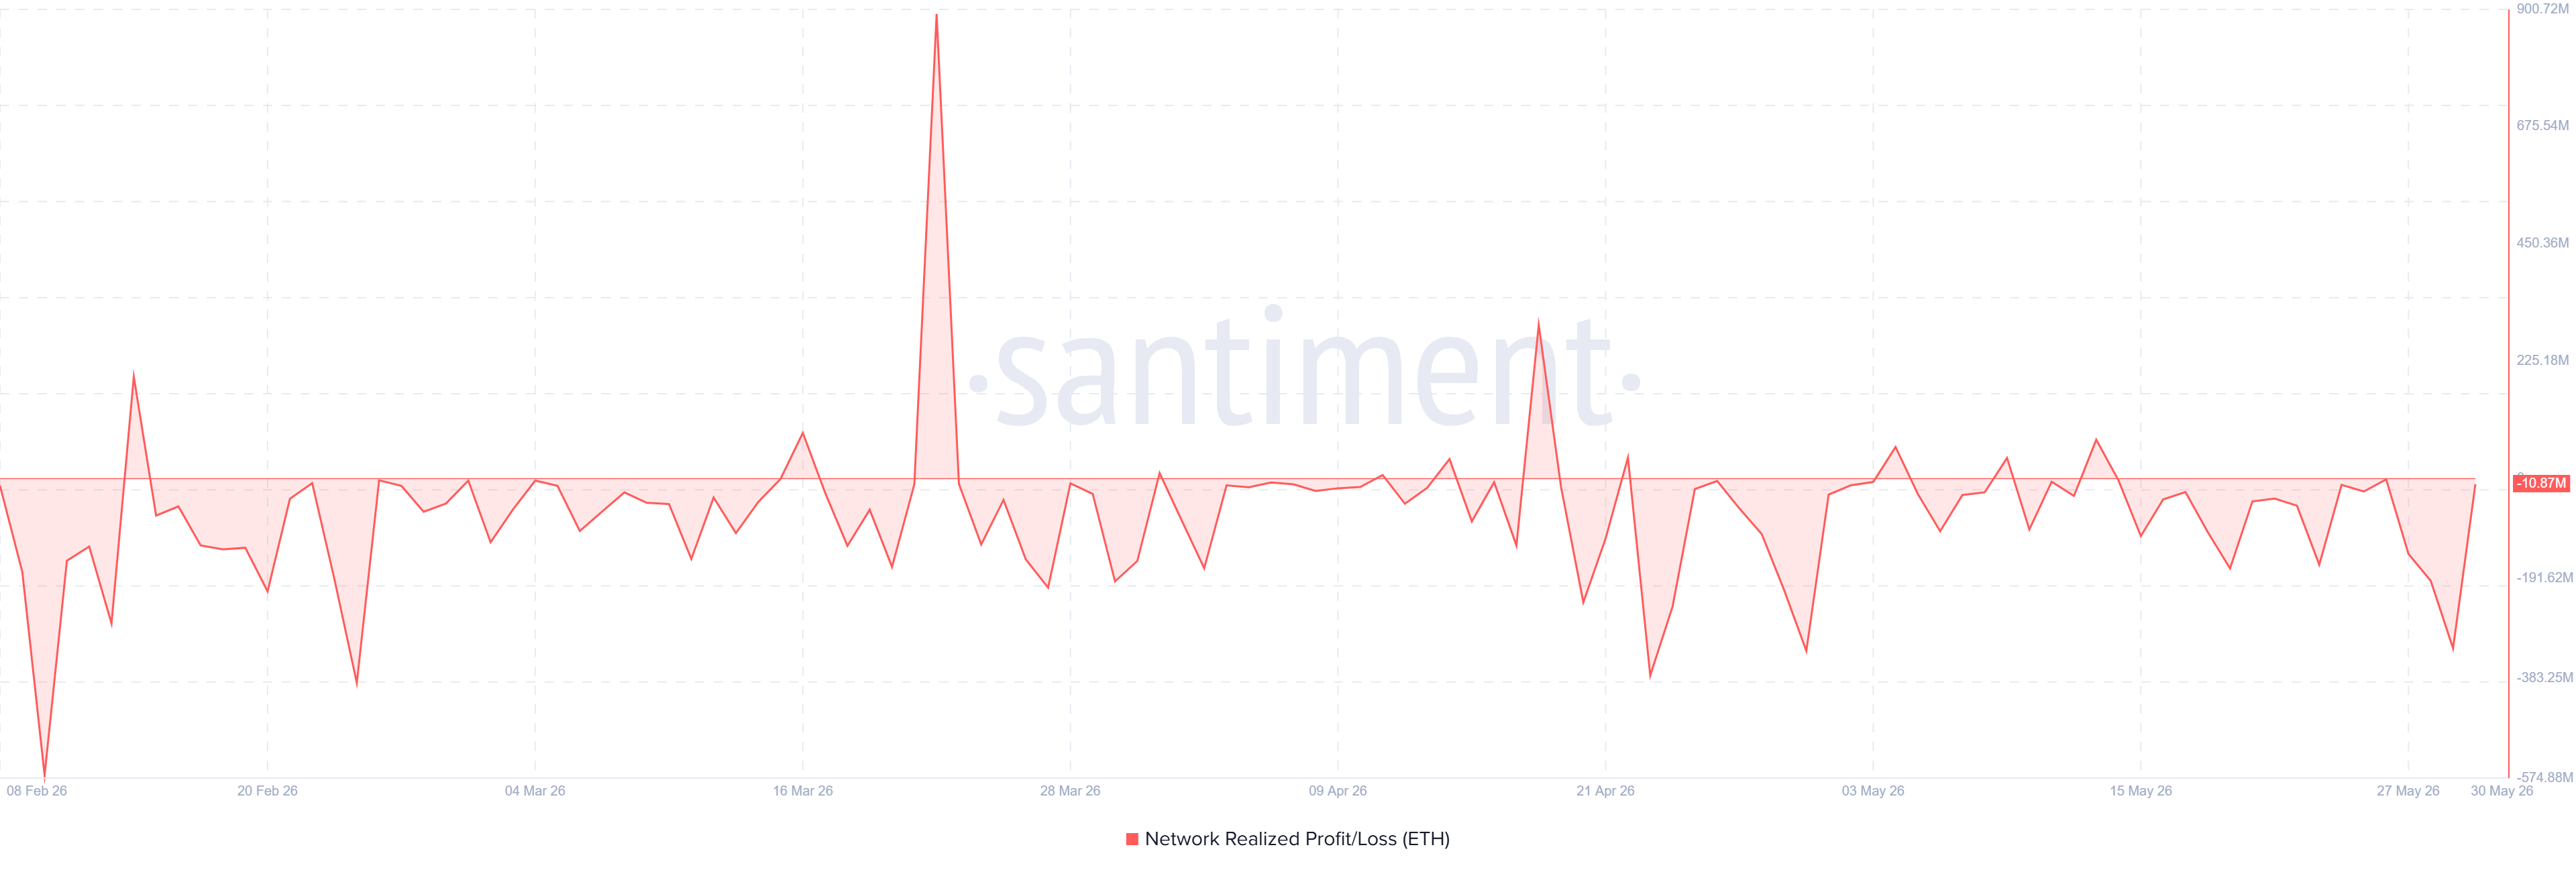
Following Ethereum's (ETH) decline to the $2,000 psychological level over the past few days, loss realization has increased.
Investors have booked losses of roughly $667 million over the past three days, the largest since early May.
The move signals investors are selling into the market weakness and expanding downside risks.

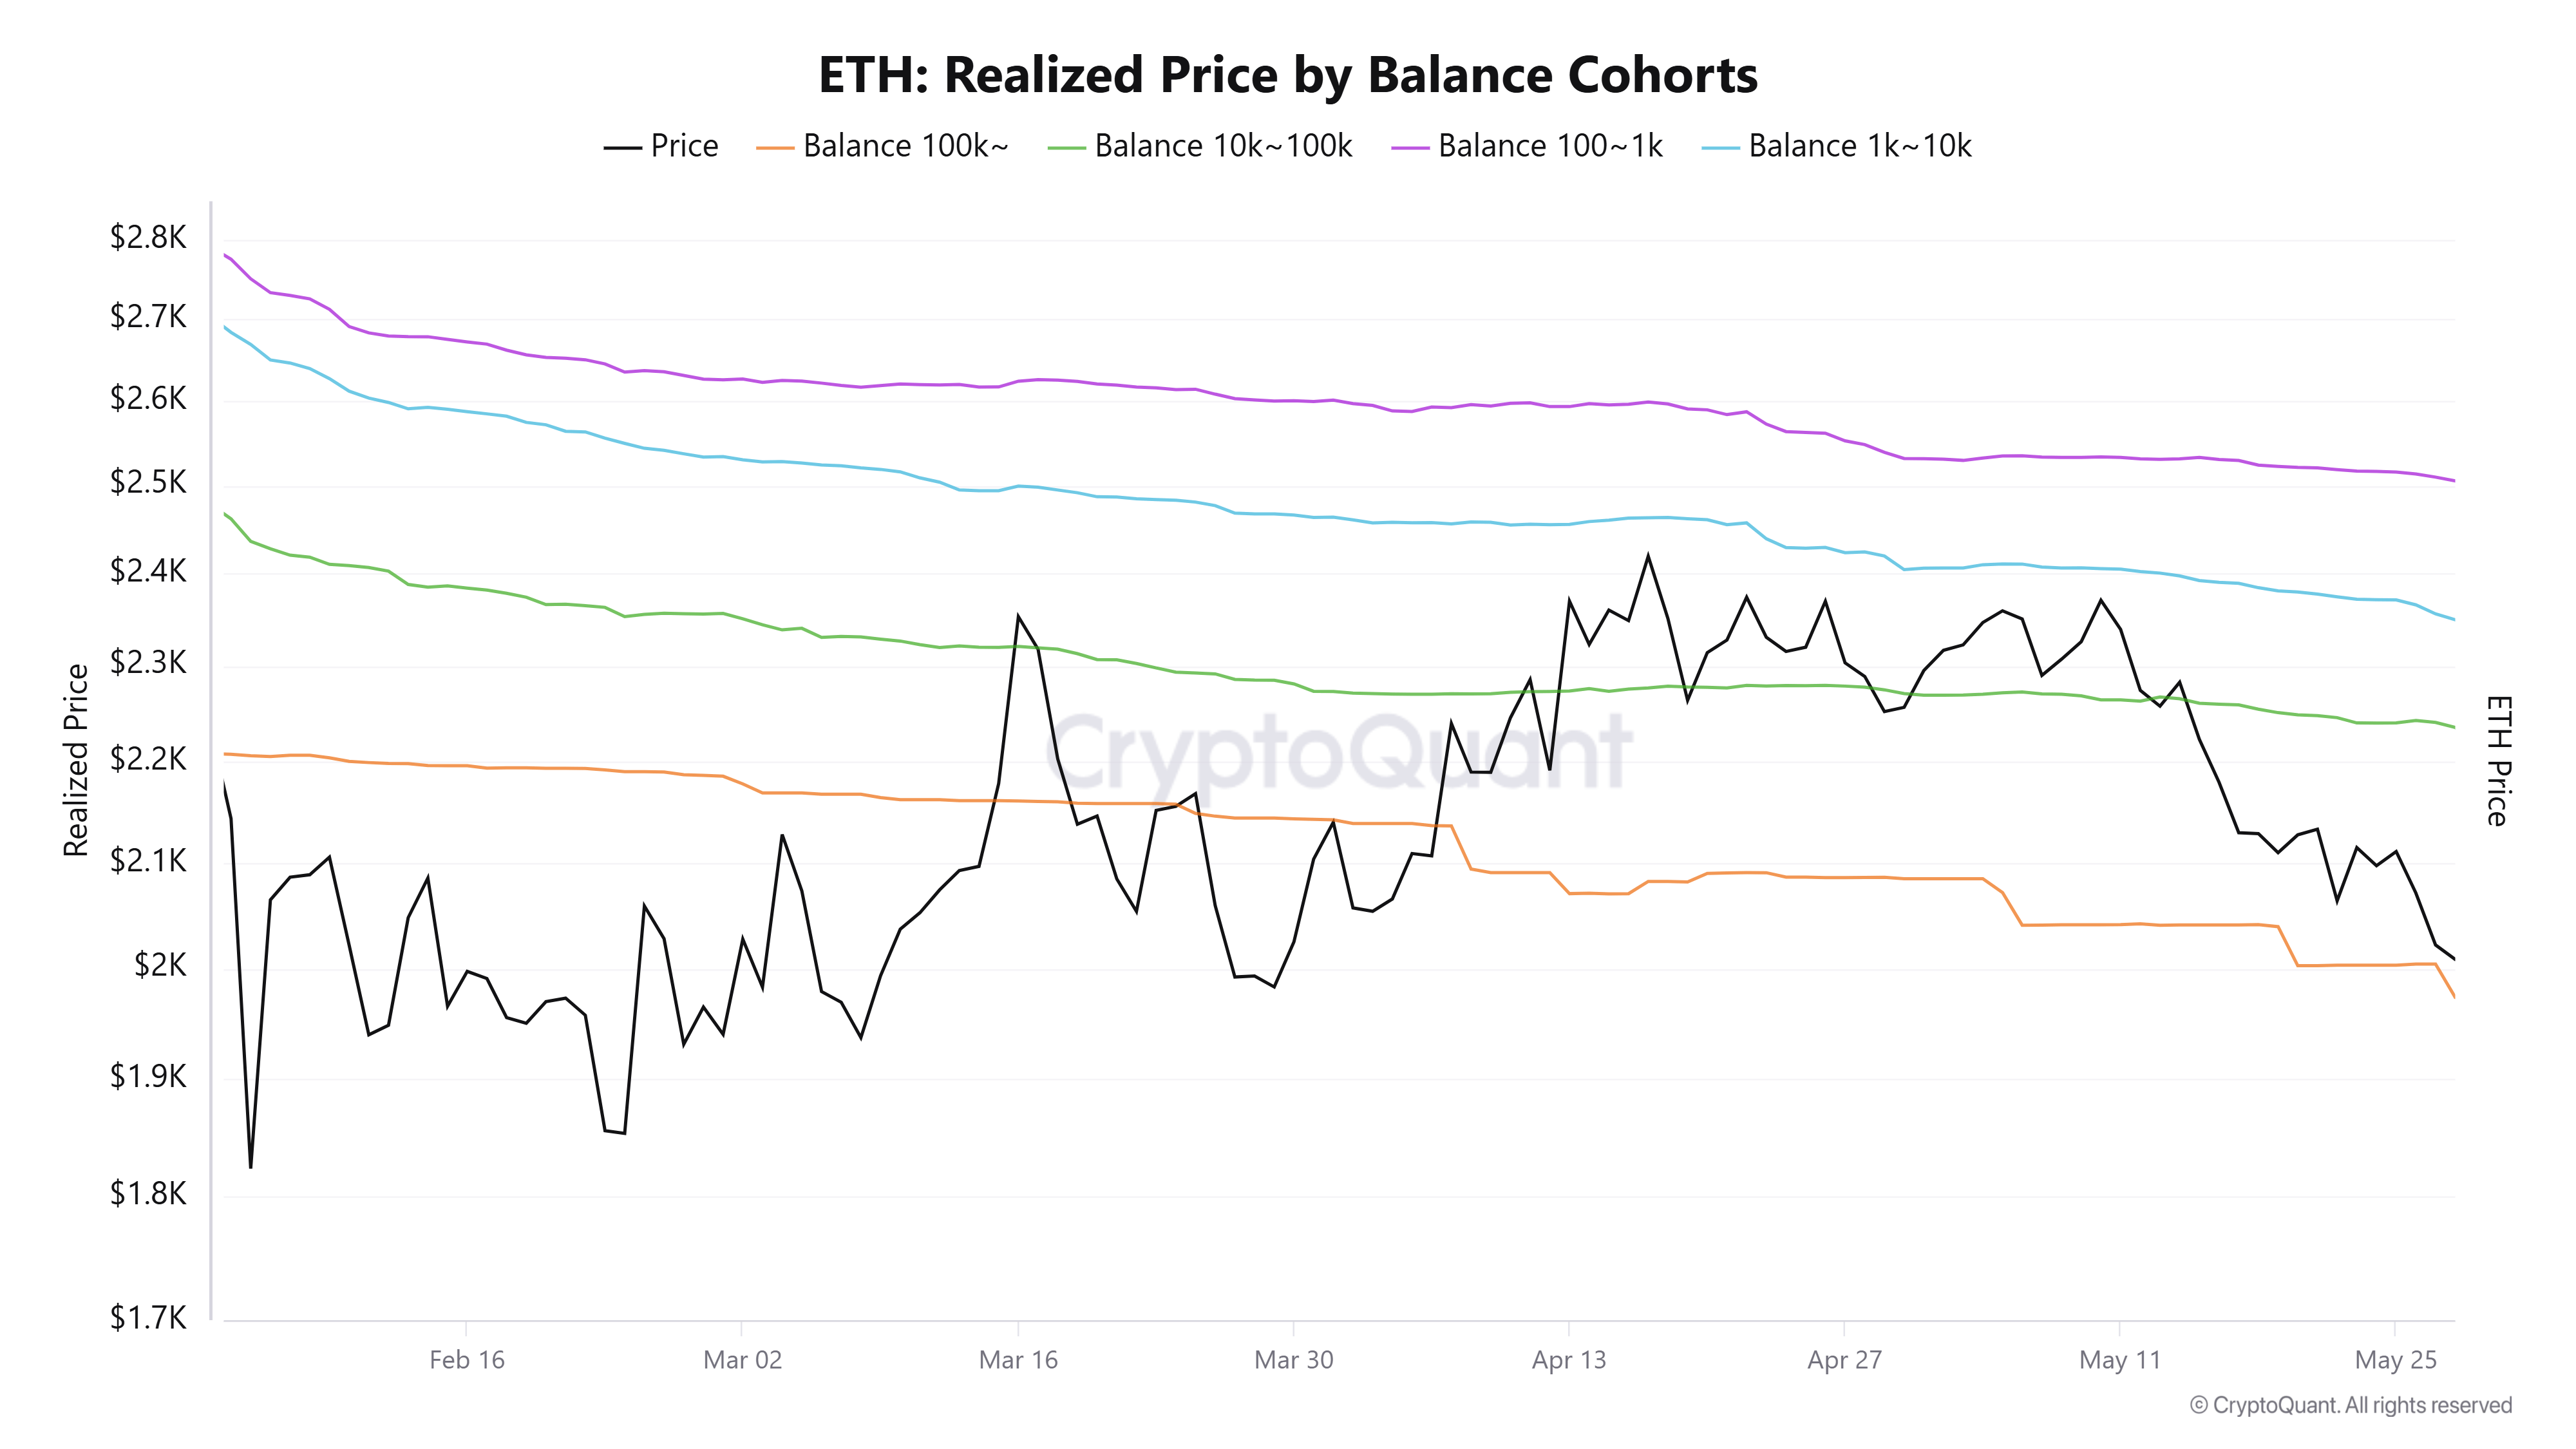
Notably, selling accelerated after buyers failed to push prices above the realized price/average onchain cost basis of retail investors. Over the past three months, that level has served as a significant overhead resistance, reinforcing a break-even distribution pattern among retail cohorts that often sell as prices approach it.
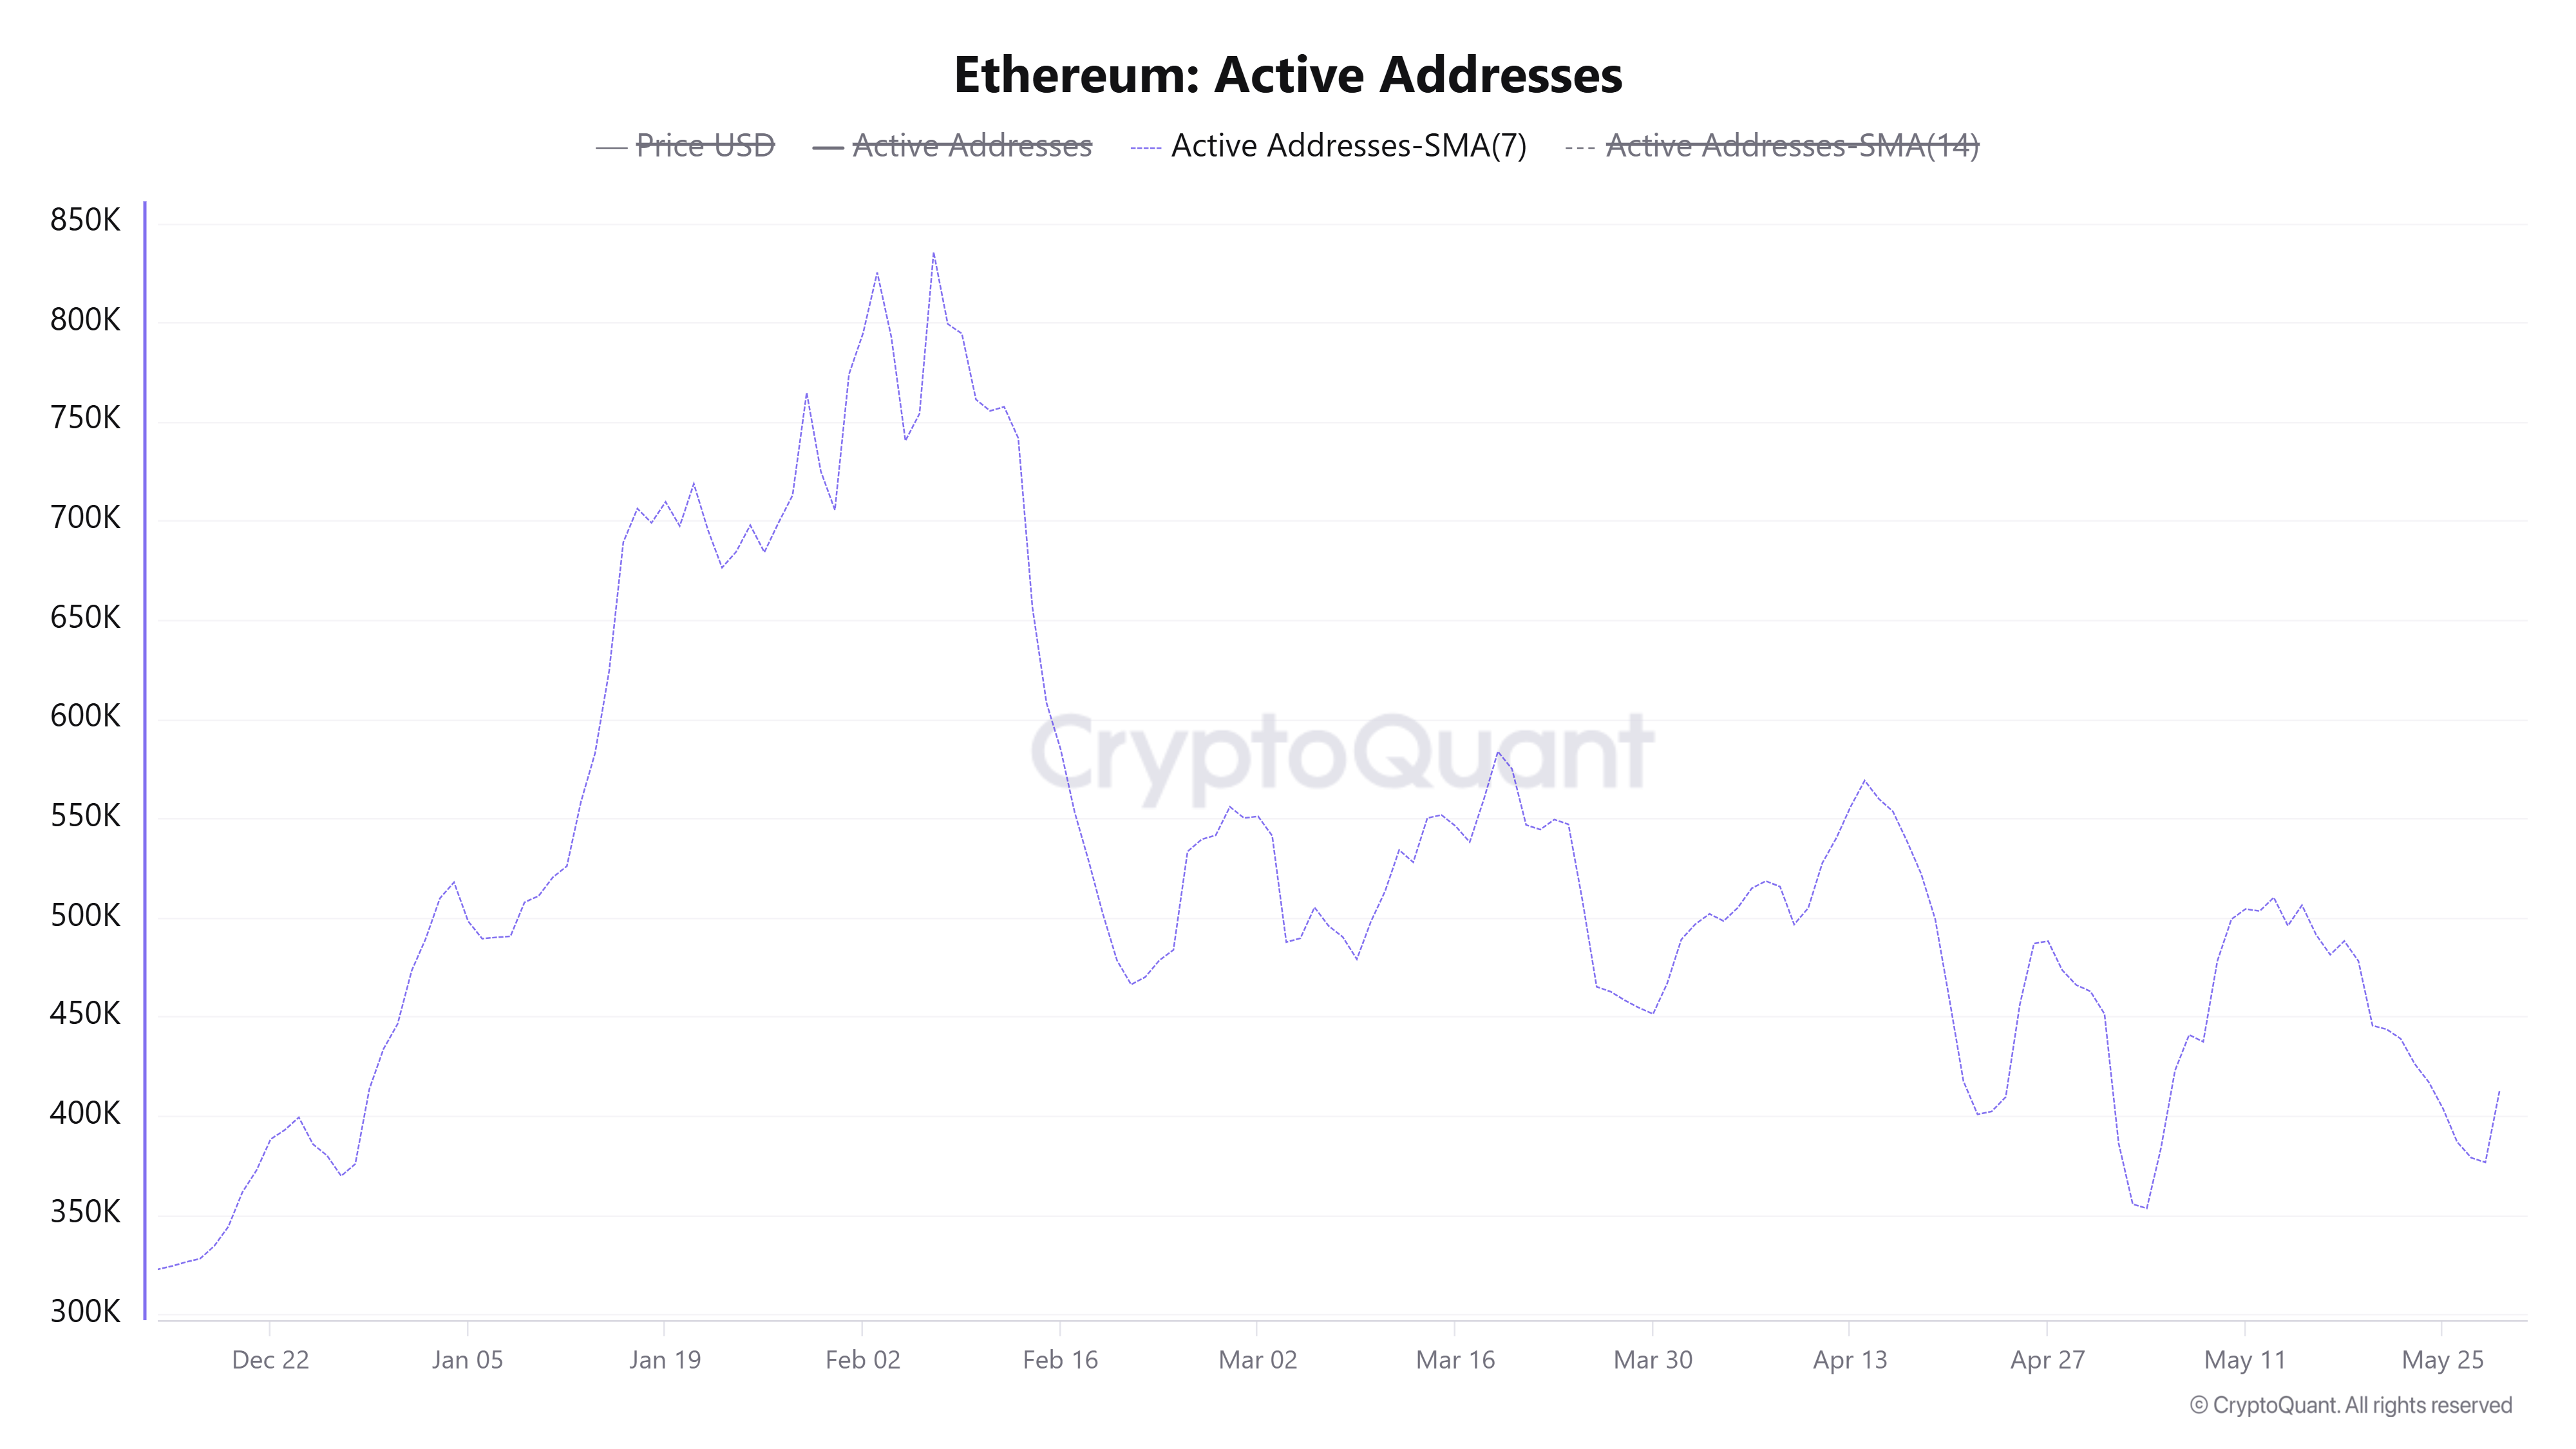
Simultaneously, network activity is falling again, with active addresses approaching levels last seen in early May. Notably, the metric has dived by 50% since February, reflecting rapidly weakening onchain engagement in the top Layer 1 blockchain.
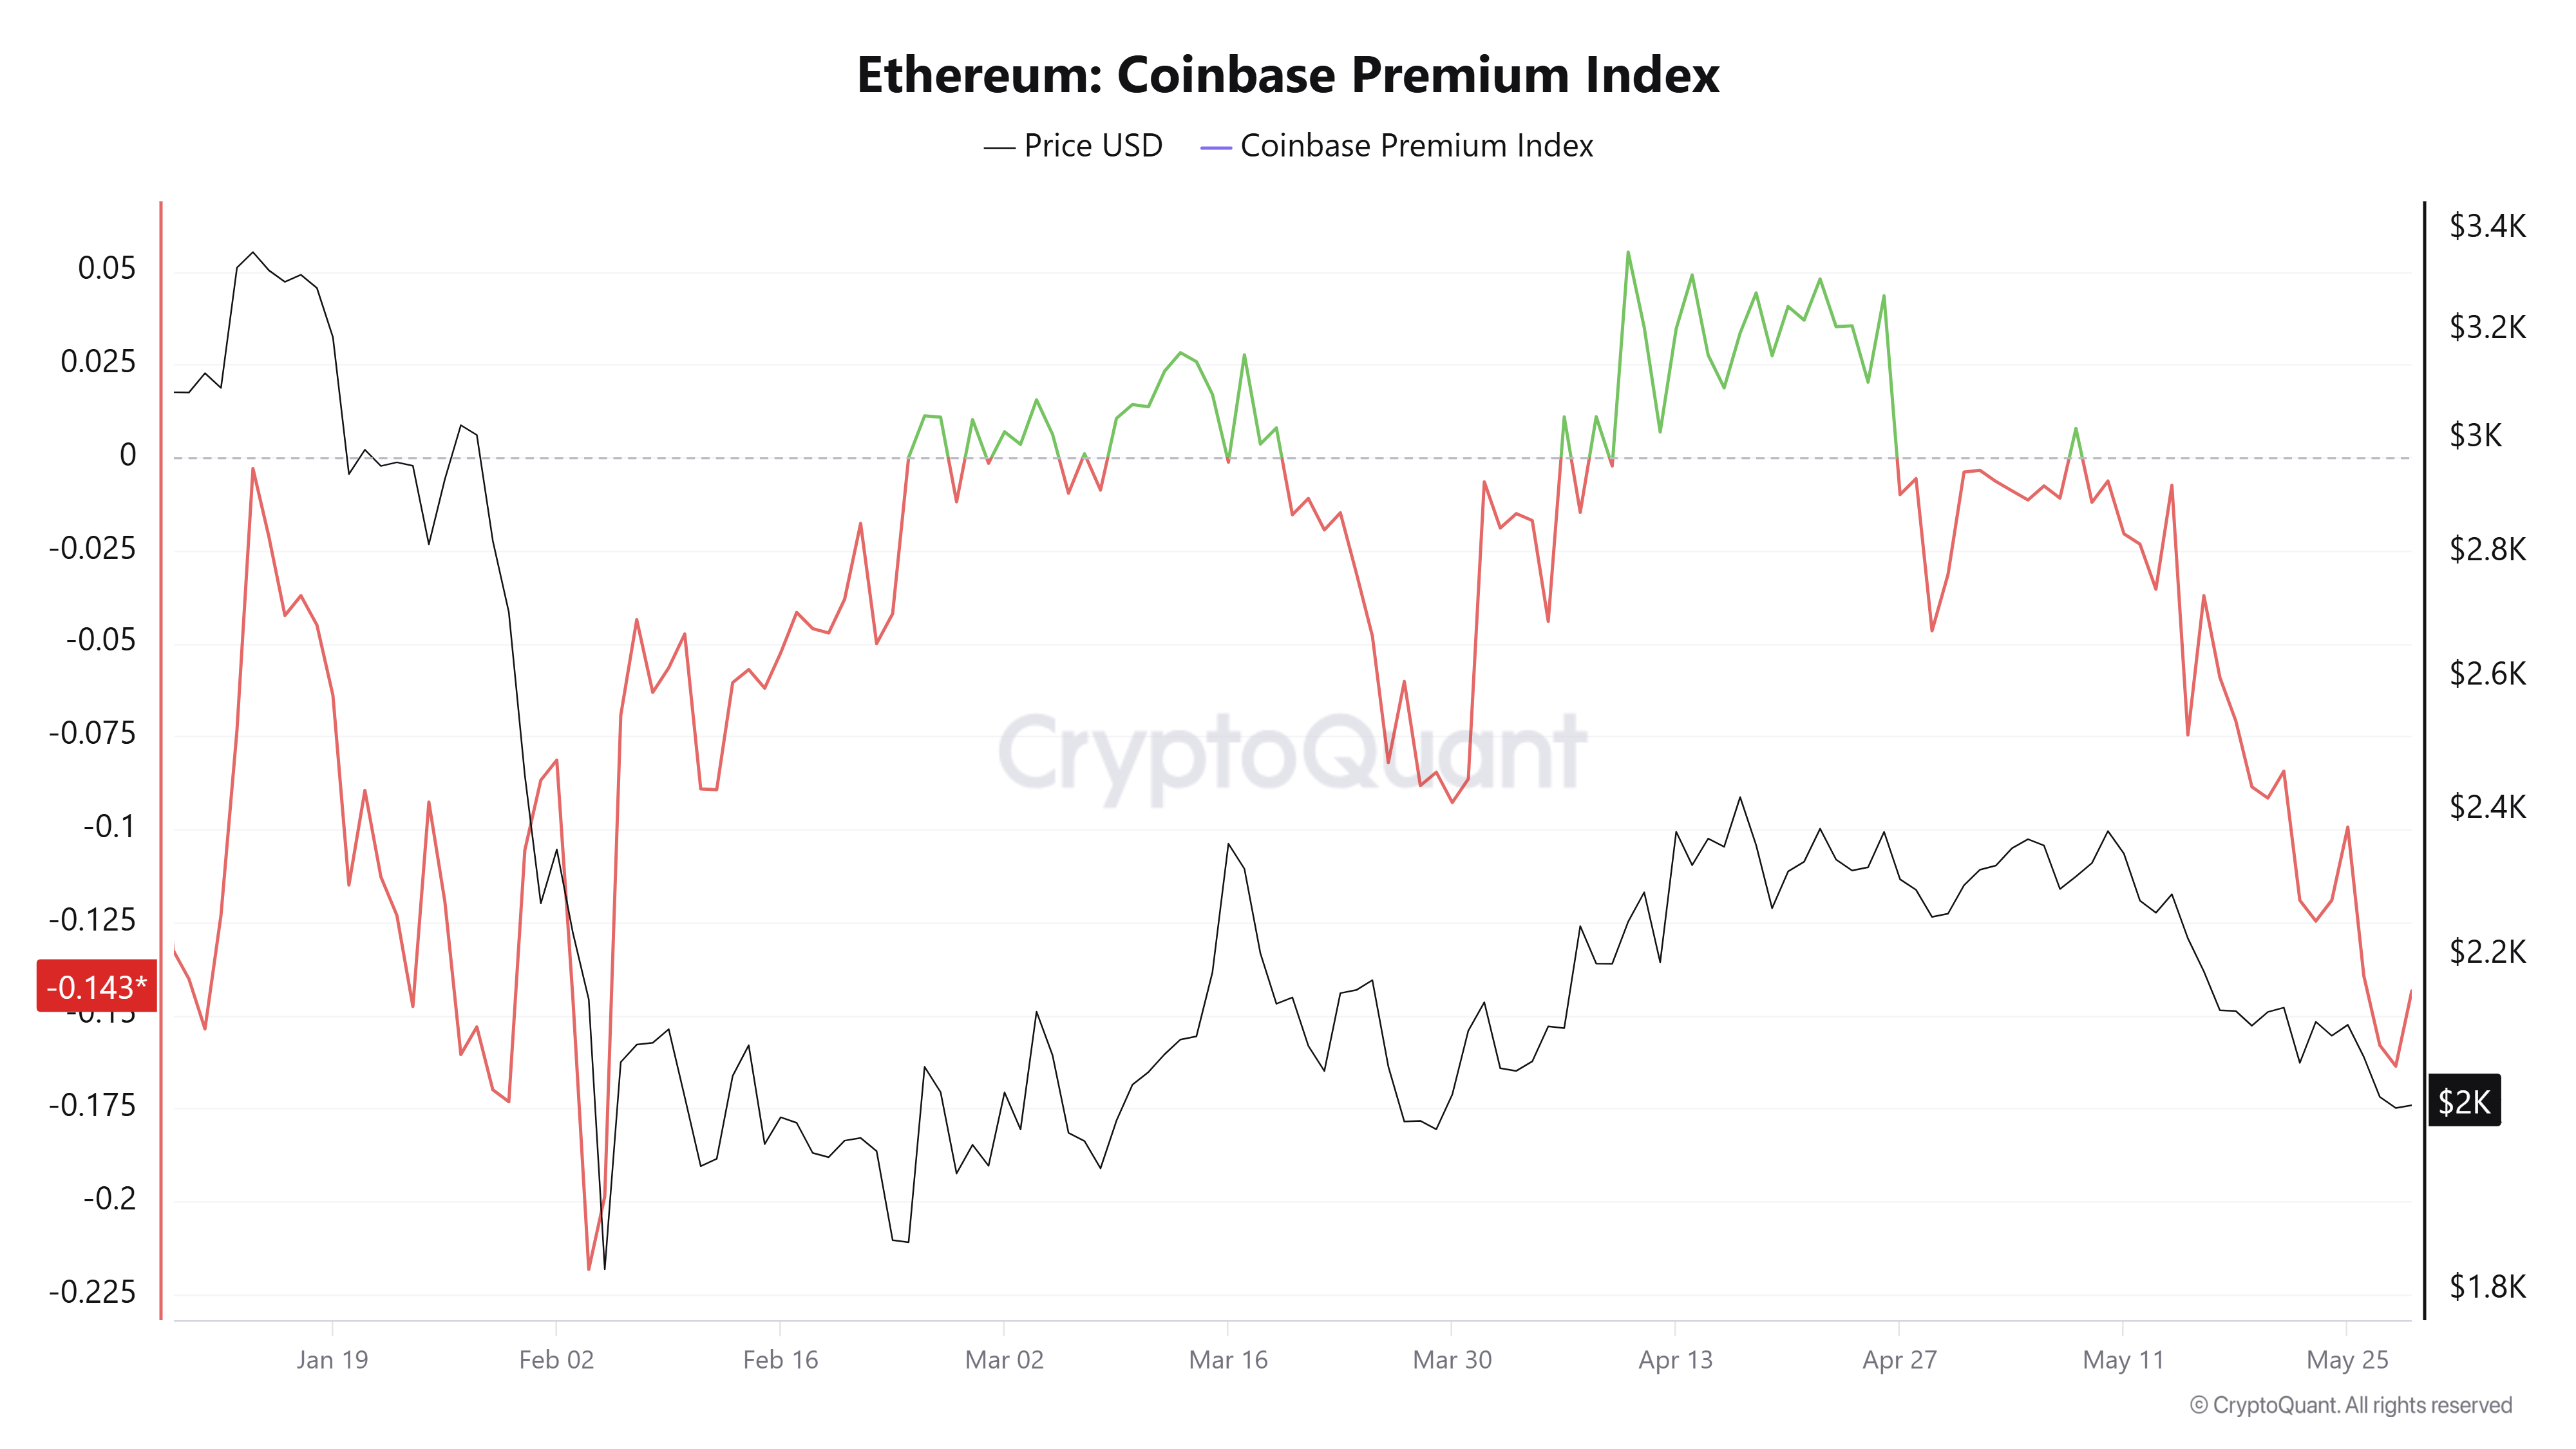
Regionally, a majority of selling activity is driven by US investors, who have been a major factor in shaping market sentiment. This is evident in the Coinbase Premium Index, a measure of US investors' sentiment, which has continued to decline since late April.
Additionally, US spot ETH exchange-traded funds (ETFs) extended their negative streak to 14 consecutive days of net outflows, highlighting heightened institutional risk-off sentiment in the region.
The only notable institutional accumulator so far has been BitMine, which expanded its stash of the top altcoin to 5.39 million ETH.
Meanwhile, on the derivatives side, open interest has continued to expand, clocking a record high above 16 million in the week, even as funding rates remain positive. However, prices have been falling during the same period, indicating shorts are likely opening new positions while long traders are buying the dip or holding onto underwater positions.
Ethereum Price Forecast: ETH recovers $2,000, but momentum remains weak
On the daily chart, ETH holds a bearish near-term bias as price remains below the 20-, 50-, and 100-day Exponential Moving Averages (EMAs), clustered from roughly $2,122 to $2,281, reinforcing a cap on rebounds.
Momentum conditions are weak but stabilizing, with the 14-day Relative Strength Index (RSI) hovering just above oversold territory near 34 and the Stochastic Oscillator (Stoch) slowly recovering from deeply oversold readings.
On the downside, immediate support is seen at the horizontal level around $2,018. A clear break there would expose the next demand zone near $1,909, ahead of deeper supports at $1,741, $1,524 and $1,404.
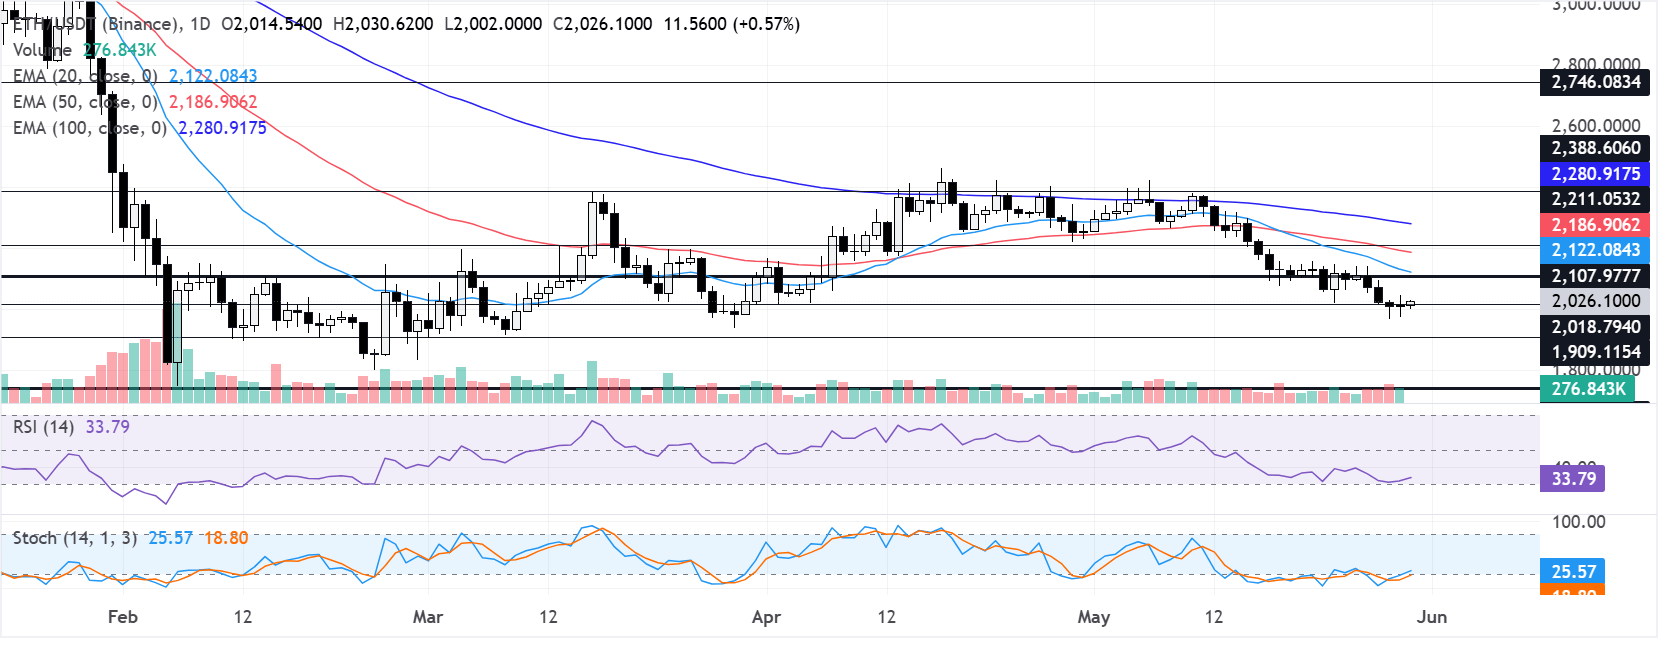
On the topside, initial resistance aligns at $2,107, followed by the 20-day EMA at $2,122 and the 50-day EMA near $2,186. A sustained move above these levels would be needed to ease the current bearish pressure and open the way toward $2,211, the 100-day EMA at $2,280 and higher horizontal barriers at $2,388, $2,746 and $3,411.
(The technical analysis of this story was written with the help of an AI tool.)













