
EUR/JPY Price Forecast: Falls to near 184.00 despite positive momentum
Par Akhtar Faruqui
Date de publication: 26 Feb 2026 | Date de modification: 26 Feb 2026


ARTICLES POPULAIRES

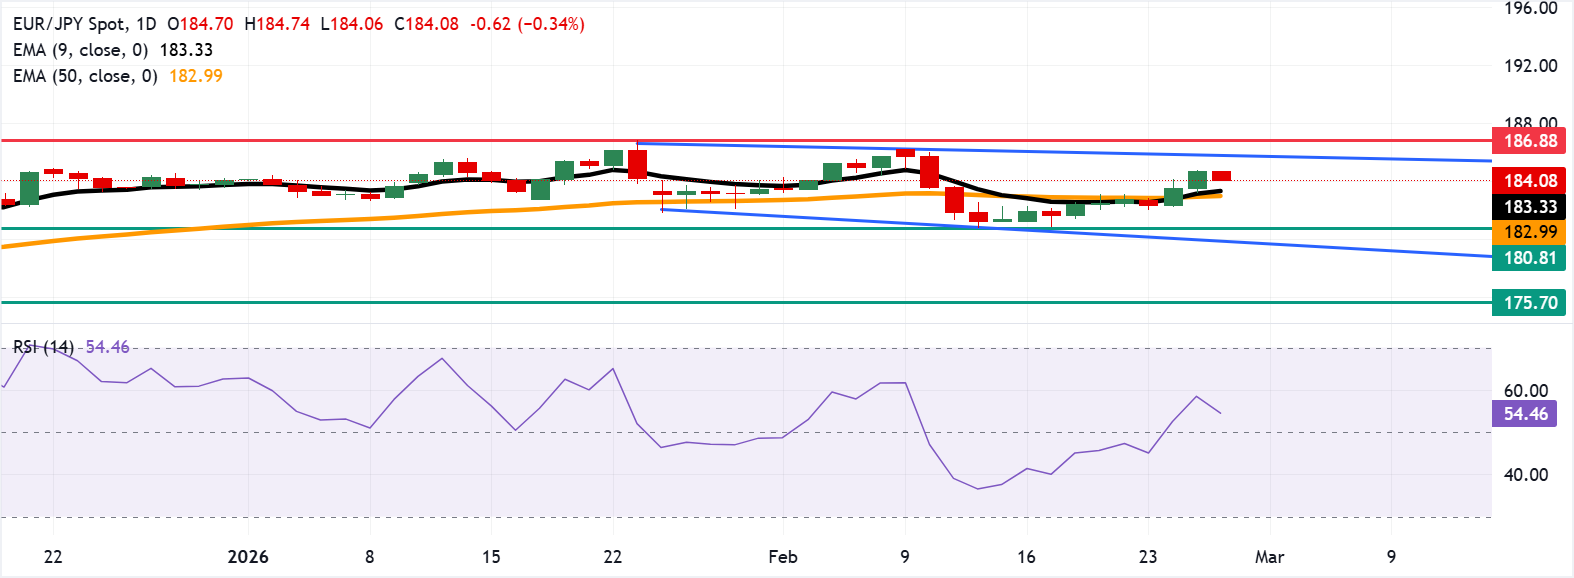
EUR/JPY loses ground after two days of gains, trading around 184.10 during the European hours on Thursday. The technical analysis of the daily chart shows a consolidation phase as the currency cross remains within the horizontal channel.
- EUR/JPY may rebound toward the horizontal channel’s upper boundary near 186.00.
- The 14-day Relative Strength Index stands at 56, confirming positive momentum.
- Primary support stands at the nine-day EMA near 183.33.
EUR/JPY loses ground after two days of gains, trading around 184.10 during the European hours on Thursday. The technical analysis of the daily chart shows a consolidation phase as the currency cross remains within the horizontal channel.
The 14-day Relative Strength Index (RSI) at 56 stays above the 50 line, confirming positive momentum rather than overbought conditions and supporting scope for a further recovery.
The near-term bias is mildly bullish as the EUR/JPY cross holds above both the nine-day and 50-day Exponential Moving Averages (EMAs), keeping the broader uptrend intact despite recent consolidation. The nine-day EMA has turned higher again, showing buyers regaining short-term control after the pullback from the 186.00 area.
The EUR/JPY cross may rebound toward the upper boundary of the horizontal channel around 186.00, followed by the all-time high of 186.88, reached on January 23.
On the downside, primary support lies at the nine-day EMA at 183.33, followed by the 50-day EMA at 182.99. Further declines below the averages would weaken the momentum and expose a two-month low at 180.81, recorded on February 12, followed by the lower horizontal channel around 180.10. Further declines would cause the emergence of the bearish bias and put downward pressure on the EUR/JPY cross to navigate the region around the four-month low at 175.70.
(The technical analysis of this story was written with the help of an AI tool.)
Euro Price Today
The table below shows the percentage change of Euro (EUR) against listed major currencies today. Euro was the weakest against the Japanese Yen.
| USD | EUR | GBP | JPY | CAD | AUD | NZD | CHF | |
|---|---|---|---|---|---|---|---|---|
| USD | 0.03% | 0.22% | -0.31% | -0.02% | 0.08% | 0.18% | 0.03% | |
| EUR | -0.03% | 0.19% | -0.31% | -0.05% | 0.05% | 0.15% | 0.00% | |
| GBP | -0.22% | -0.19% | -0.51% | -0.25% | -0.14% | -0.04% | -0.19% | |
| JPY | 0.31% | 0.31% | 0.51% | 0.29% | 0.40% | 0.47% | 0.35% | |
| CAD | 0.02% | 0.05% | 0.25% | -0.29% | 0.11% | 0.20% | 0.05% | |
| AUD | -0.08% | -0.05% | 0.14% | -0.40% | -0.11% | 0.10% | -0.05% | |
| NZD | -0.18% | -0.15% | 0.04% | -0.47% | -0.20% | -0.10% | -0.14% | |
| CHF | -0.03% | -0.00% | 0.19% | -0.35% | -0.05% | 0.05% | 0.14% |
The heat map shows percentage changes of major currencies against each other. The base currency is picked from the left column, while the quote currency is picked from the top row. For example, if you pick the Euro from the left column and move along the horizontal line to the US Dollar, the percentage change displayed in the box will represent EUR (base)/USD (quote).

Plus d’un million d’utilisateurs se tournent vers FXStreet pour des données de marché en temps réel, des outils de graphiques, des analyses d’experts et des actualités Forex. Leur calendrier économique complet et leurs webinaires éducatifs aident les traders à rester informés et à prendre des décisions éclairées. FXStreet s’appuie sur une équipe d’environ 60 professionnels répartis entre le siège de Barcelone et diverses régions du monde.
Lire la suite


