
EUR/USD hesitates at 1.1660 with Iran’s ceasefire on tenterhooks
Par Guillermo Alcala
Mis à jour: 9 Apr 2026


ARTICLES POPULAIRES

The (EUR) is trading practically flat, right above 1.1660 against the US Dollar at Thursday’s European session opening. The pair pùlled back from Wednesday’s highs, at 1.1721, as Tehran closed the Strait of Hormuz following massive Israeli attacks on Lebanon.
- EUR/USD wavers around 1.1660 after pulling back from 1.1721 highs.
- A fragile ceasefire in the Iran war is keeping investors on edge.
- The minutes of the last Fed meeting showed more openness for interest rate hikes.
The (EUR) is trading practically flat, right above 1.1660 against the US Dollar at Thursday’s European session opening. The pair pùlled back from Wednesday’s highs, at 1.1721, as Tehran closed the Strait of Hormuz following massive Israeli attacks on Lebanon.
The Iranian authorities complained about violations of the ceasefire proposal while the US and Israel affirm that Lebanon is not part of the agreement, and US President Donald Trump threatened action if Tehran fails to comply with the deal. Despite the tensions, both parties have announced that they will send delegations for direct talks in Pakistan, which keeps peace hopes alive for now.
The Fed turns more hawkish
Apart from that, a moderate hawkish tilt on the minutes of March’s Federal Open Market Committee (FOMC) has contributed to the US Dollar’s rebound. Federal Reserve (Fed) policymakers acknowledged that progress towards the 2% inflation target will be longer than previously thought, and some committee members considered that higher interest rates might be appropriate if inflation remains above target levels.
Later on Thursday, the US Personal Consumption Expenditures (PCE) Price Index, but above all, Friday’s Consumer Prices Index (CPI), which refers to March, will reveal the inflationary impact of the Iran war, and might give further insight into the central bank’s monetary policy path.
In Europe, German Industrial Production figures revealed that factory output declined against expectations in February, while the trade surplus contracted less than expected, with imports and exports increasing beyond forecasts. The impact of these figures on the Euro has been marginal.
Technical Analysis: The near-term bias remains bullish
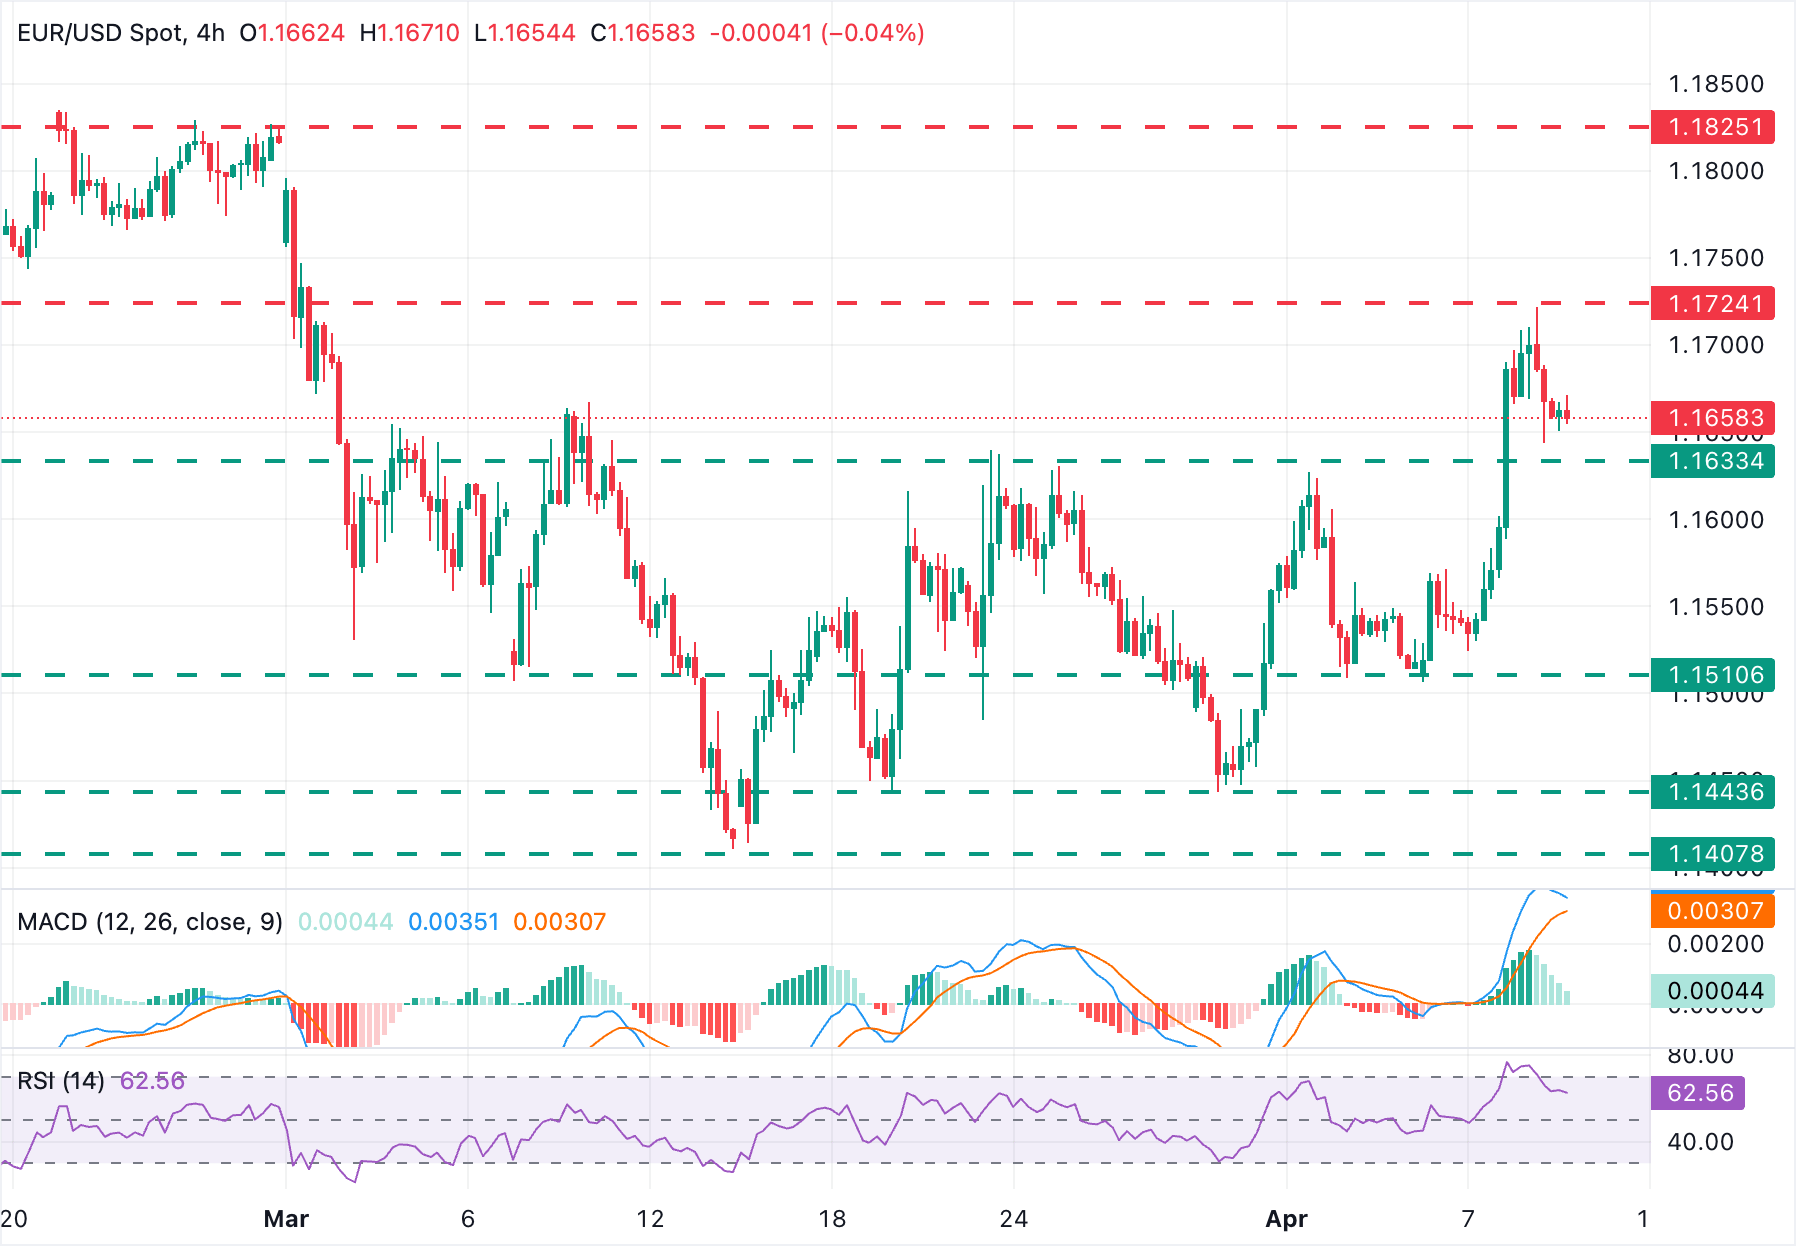
EUR/USD maintains a constructive near-term bias, despite the recent pullback, as it holds most of the gains taken over the previous three days.
The 4-hour Relative Strength Index (RSI) is hovering in bullish territory, and the Moving Average Convergence Divergence (MACD) remains marginally positive, which together suggest that upward momentum is still in play.
On the topside, the area between Wednesday's high at 1.1721 and the February 19 low near 1.1740 is likely to challenge bulls ahead of the late-February highs, around 1.1830. Bears remain capped above previous highs, in the 1.1630-1.1640 area, so far closing the path towards the weekly lows, at 1.1505.
(The technical analysis of this story was written with the help of an AI tool.)
Economic Indicator
Industrial Production s.a. (MoM)
The Industrial Production released by the Statistisches Bundesamt Deutschland measures outputs of the German factories and mines. Changes in industrial production are widely followed as a major indicator of strength in the manufacturing sector. A high reading is seen as positive (or bullish) for the EUR, whereas a low reading is seen as negative (or bearish).
Read more.Last release: Thu Apr 09, 2026 06:00
Frequency: Monthly
Actual: -0.3%
Consensus: 0.9%
Previous: -0.5%
Source: Federal Statistics Office of Germany
Economic Indicator
Trade Balance s.a.
The Trade Balance released by the Statistisches Bundesamt Deutschland is a balance between exports and imports of total goods and services. A positive value shows a trade surplus, while a negative value shows a trade deficit. It is an event that generates some volatility for the EUR. If a steady demand in exchange for German exports is seen, that would turn into a positive growth in the trade balance, and that should be positive for the EUR.
Review Alex Nekritin's Article - Trading the Euro with Germany Trade Balance
Last release: Thu Apr 09, 2026 06:00
Frequency: Monthly
Actual: €19.8B
Consensus: €18.5B
Previous: €21.2B
Source: Federal Statistics Office of Germany

Plus d’un million d’utilisateurs se tournent vers FXStreet pour des données de marché en temps réel, des outils de graphiques, des analyses d’experts et des actualités Forex. Leur calendrier économique complet et leurs webinaires éducatifs aident les traders à rester informés et à prendre des décisions éclairées. FXStreet s’appuie sur une équipe d’environ 60 professionnels répartis entre le siège de Barcelone et diverses régions du monde.
Lire la suite


