
GBP/JPY extends rally to 2008 highs as elevated Oil prices weigh on the Yen
Par Vishal Chaturvedi
Mis à jour: 14 Apr 2026


ARTICLES POPULAIRES

GBP/JPY advances on Tuesday, extending gains for a seventh consecutive day as elevated Oil prices continue to weigh on the Japanese Yen (JPY), while improving market sentiment, driven by renewed hopes of US-Iran negotiations, supports the British Pound (GBP).
- GBP/JPY rallies to multi-year highs as Oil-driven Yen weakness continues.
- US-Iran diplomacy hopes lift sentiment, supporting risk-sensitive currencies.
- Technically, GBP/JPY remains in a strong uptrend, supported above the 100- and 200-day SMAs.
GBP/JPY advances on Tuesday, extending gains for a seventh consecutive day as elevated Oil prices continue to weigh on the Japanese Yen (JPY), while improving market sentiment, driven by renewed hopes of US-Iran negotiations, supports the British Pound (GBP). At the time of writing, the cross is trading around 215.60, its highest level since July 2008.
Although Oil prices have eased somewhat from recent highs on prospects that a second round of negotiations could take place in Islamabad, they remain elevated as tensions around the reopening of the Strait of Hormuz persist.
The International Monetary Fund (IMF) warned that a more severe scenario could see Oil prices averaging $110 per barrel in 2026 and rising to $125 in 2027, compared with around $82 under its baseline outlook. Kristalina Georgieva, Managing Director of the IMF, cautioned that such a scenario could push some economies into recession, with global inflation climbing above 6%.
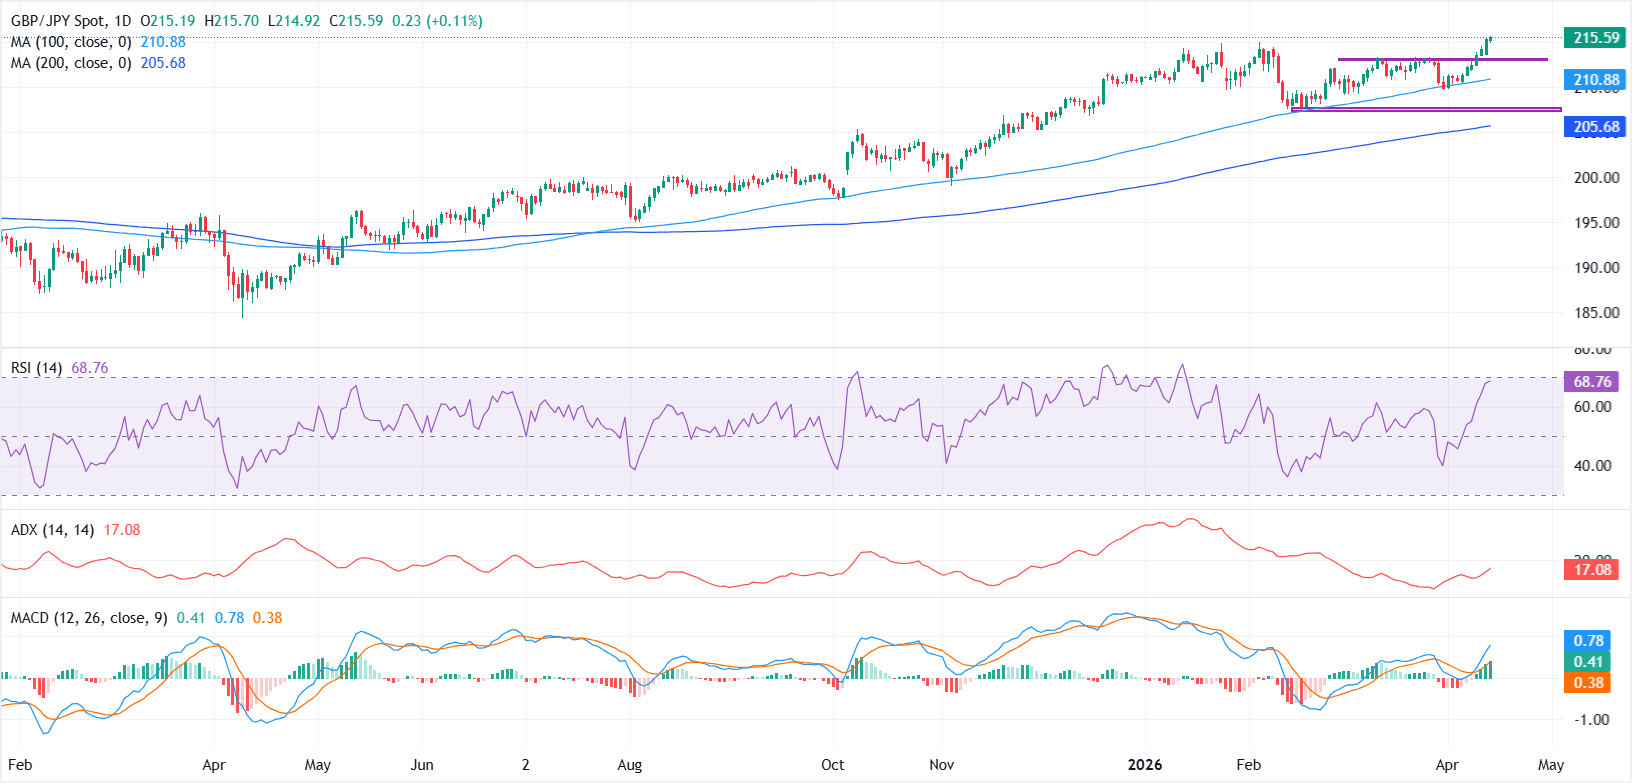
From a technical perspective, the daily chart suggests GBP/JPY maintains a bullish bias, with the pair extending its upward trend and trading well above the 100-day Simple Moving Average (SMA) at 210.88 and the 200-day SMA at 205.68, reinforcing the broader uptrend.
Momentum stays constructive, with the Relative Strength Index (14) near overbought territory at 68 and the Moving Average Convergence Divergence (MACD) indicator back in positive territory around 0.41, hinting that buying pressure remains in control despite the risk of short-term consolidation after the latest advance. Meanwhile, the Average Directional Index (ADX) near 17 suggests the trend is still developing rather than overextended.
On the upside, if the pair sustains a break above the 215.00 zone, it could pave the way for further gains toward the 217.00 region, with scope to extend toward 220.00.
On the downside, a failure to hold above the 215.00 level could see the pair retest initial support near 213.00, followed by the 100-day SMA around 210.88. A break below this level would shift the near-term bias to bearish, exposing the 200-day SMA near 205.68.
Japanese Yen Price Today
The table below shows the percentage change of Japanese Yen (JPY) against listed major currencies today. Japanese Yen was the strongest against the US Dollar.
| USD | EUR | GBP | JPY | CAD | AUD | NZD | CHF | |
|---|---|---|---|---|---|---|---|---|
| USD | -0.32% | -0.49% | -0.38% | -0.36% | -0.53% | -0.66% | -0.41% | |
| EUR | 0.32% | -0.17% | -0.04% | -0.03% | -0.22% | -0.35% | -0.10% | |
| GBP | 0.49% | 0.17% | 0.13% | 0.15% | -0.05% | -0.17% | 0.07% | |
| JPY | 0.38% | 0.04% | -0.13% | 0.03% | -0.15% | -0.28% | -0.03% | |
| CAD | 0.36% | 0.03% | -0.15% | -0.03% | -0.19% | -0.29% | -0.06% | |
| AUD | 0.53% | 0.22% | 0.05% | 0.15% | 0.19% | -0.12% | 0.11% | |
| NZD | 0.66% | 0.35% | 0.17% | 0.28% | 0.29% | 0.12% | 0.24% | |
| CHF | 0.41% | 0.10% | -0.07% | 0.03% | 0.06% | -0.11% | -0.24% |
The heat map shows percentage changes of major currencies against each other. The base currency is picked from the left column, while the quote currency is picked from the top row. For example, if you pick the Japanese Yen from the left column and move along the horizontal line to the US Dollar, the percentage change displayed in the box will represent JPY (base)/USD (quote).

Plus d’un million d’utilisateurs se tournent vers FXStreet pour des données de marché en temps réel, des outils de graphiques, des analyses d’experts et des actualités Forex. Leur calendrier économique complet et leurs webinaires éducatifs aident les traders à rester informés et à prendre des décisions éclairées. FXStreet s’appuie sur une équipe d’environ 60 professionnels répartis entre le siège de Barcelone et diverses régions du monde.
Lire la suite


